
BeInCrypto takes a look at the eight altcoins that decreased the most over the past seven days, from Sept 24 to Oct 1.
These altcoins are:
- Digitalbits (XBD) : -22.60%
- Huobi Token (HT) : -11.98%
- Celo (CELO) : -8.13%
- Avalanche (AVAX) : -6.21%
- Decred (DCR) : -3.11%
- Quant (QNT) : -2.77%
- NEAR Protocol (NEAR) : -2.28%
- Waves (WAVES) : -0.95%
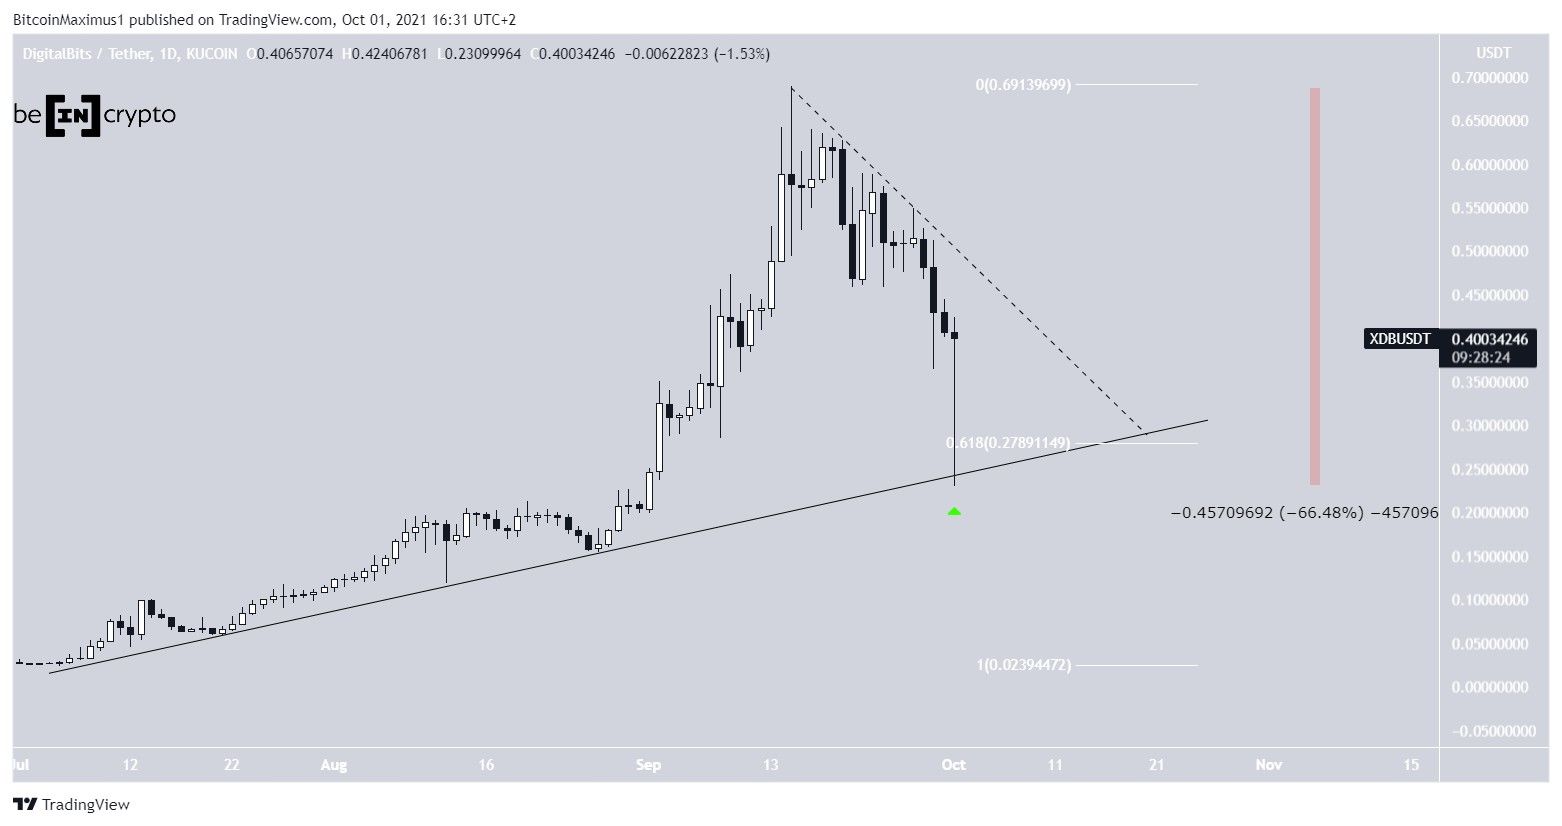
XDB
XDB has been decreasing since Sept 15, when it reached an all-time high price of $0.69. The downward movement led to a low of $0.23 on Oct 1. This amounted to a drop of 66% since the highs.
The token bounced significantly the same day, creating a very long lower wick (green icon).
The bounce served to validate an ascending support line and the 0.618 Fib retracement support level at $0.28.
In order to confirm the bullish reversal, XDB has to break out from the descending resistance line (dashed) that has been in place since the aforementioned all-time high.
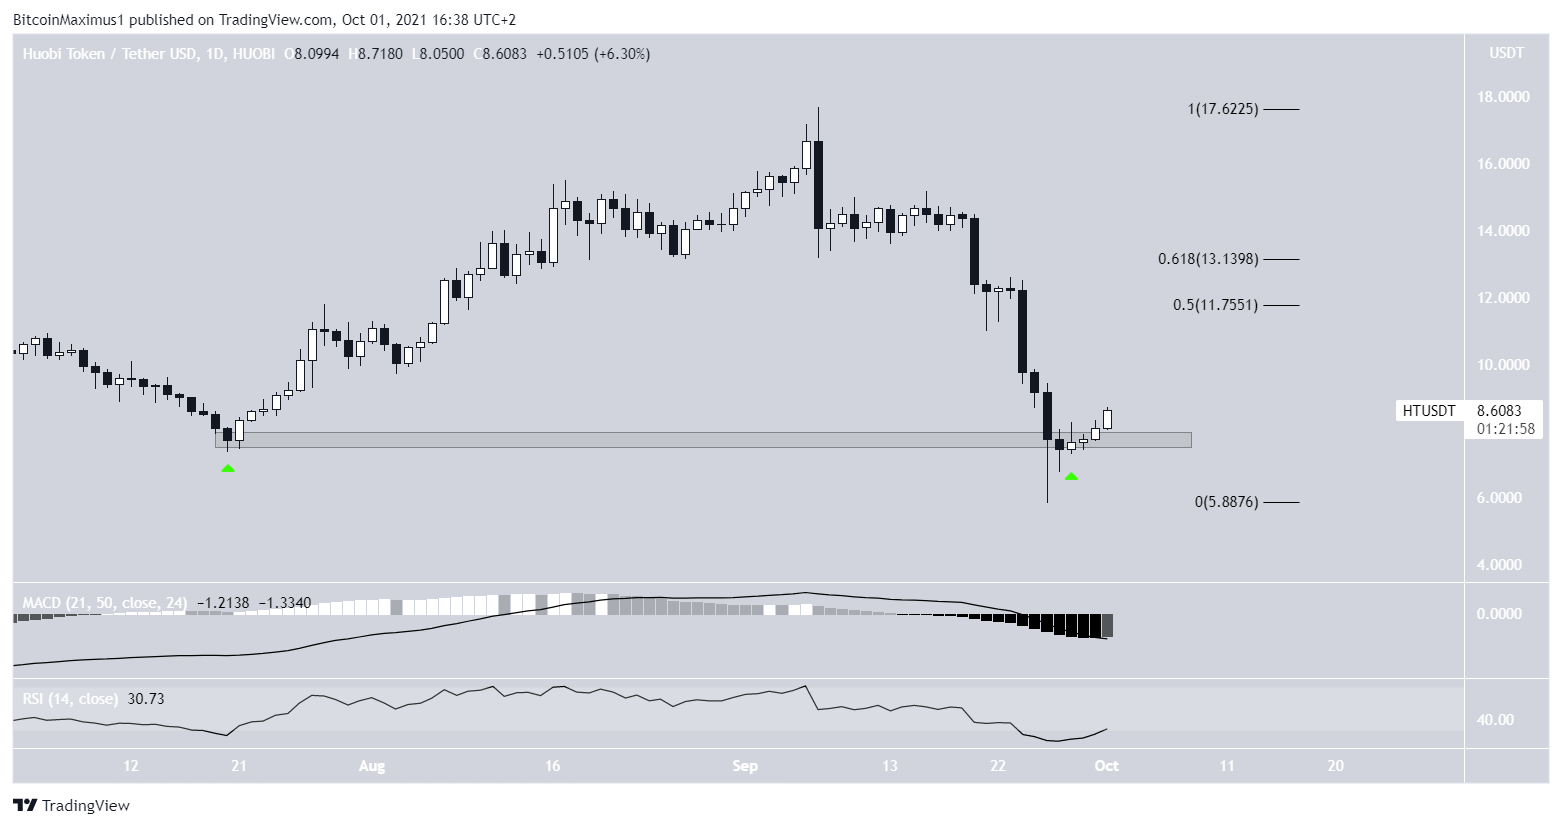
HT
HT has been falling sharply since Sept 7. On Sept 26, it reached a low of $5.85. However, it created a long lower wick and potentially a double bottom pattern relative to the price on July 20.
While the token has been moving upwards, the bounce has been weak so far. Furthermore, the RSI and MACD are both bearish.
There is very strong resistance between $11.75 and $13.13.
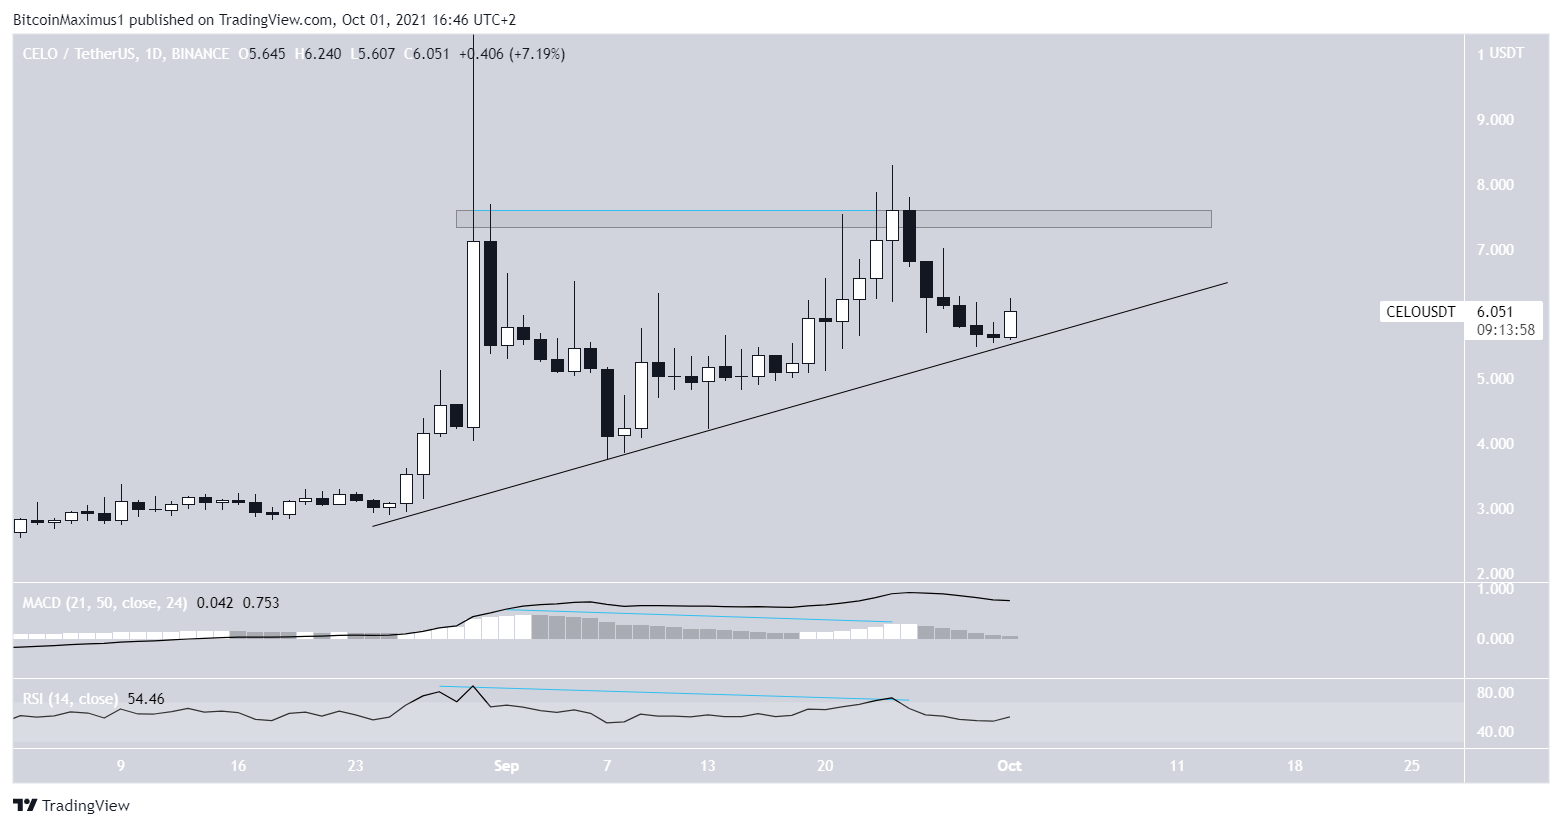
CELO
CELO has been moving downwards since creating the second portion of a double top pattern on Sept 24. The pattern was combined with bearish divergences in both the RSI and MACD.
However, after the ensuing drop, CELO bounced at an ascending support line (green icon) on Sept 30. When combined with the $7.50 resistance area, this creates a potential ascending triangle, which is considered a bullish pattern.
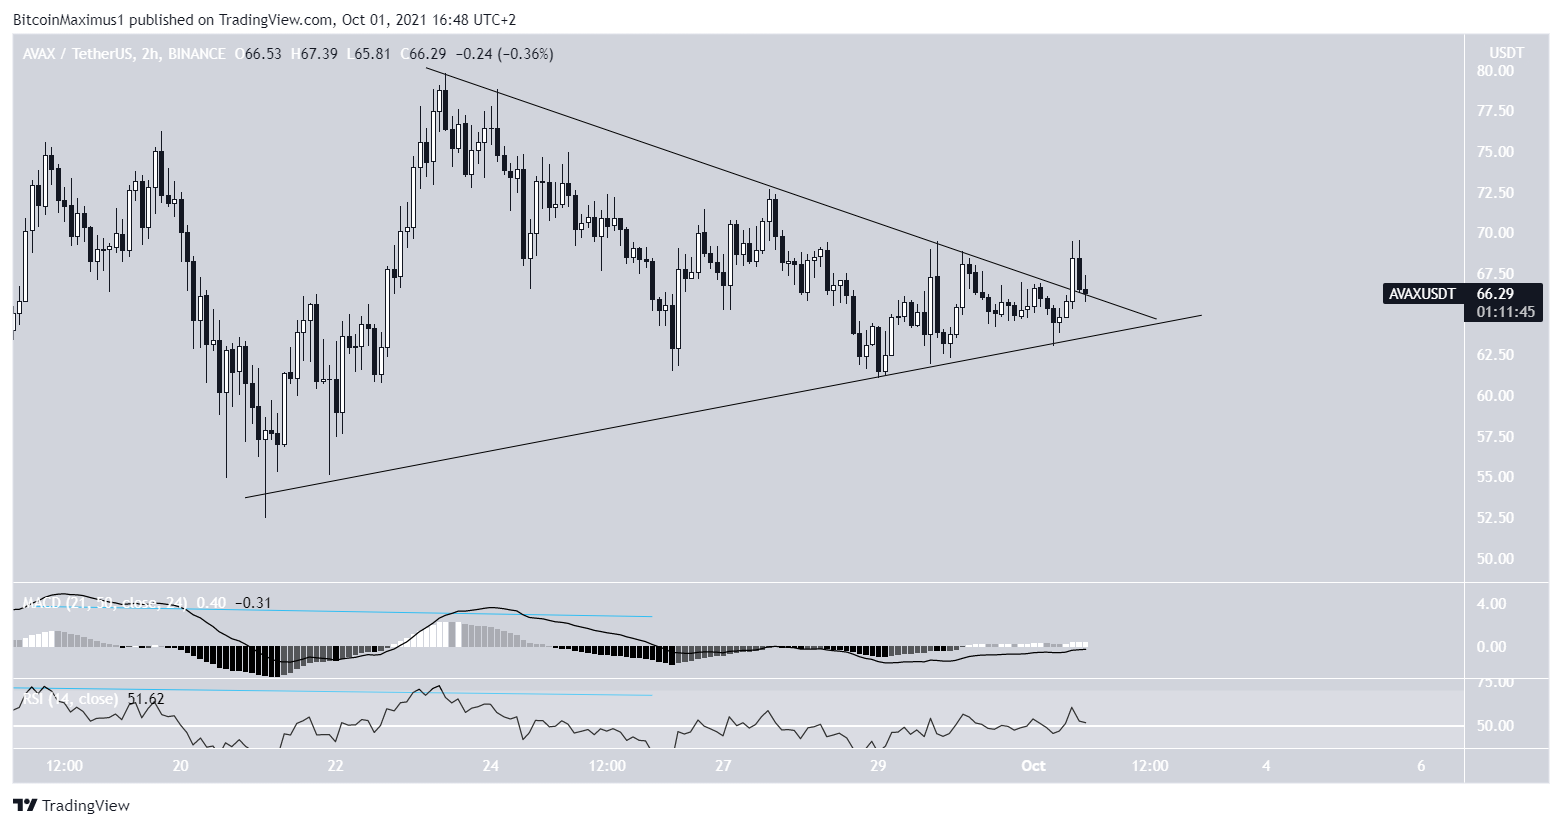
AVAX
AVAX has been decreasing since reaching an all-time high price of $79.80 on Sept 23. It is possible that it is trading inside a symmetrical triangle, which is considered a neutral pattern.
Furthermore, technical indicators in short-term time-frames are neutral. The RSI is right at the 50 line and the MACD is at the 0 line.
Therefore, the direction of the trend is undetermined.
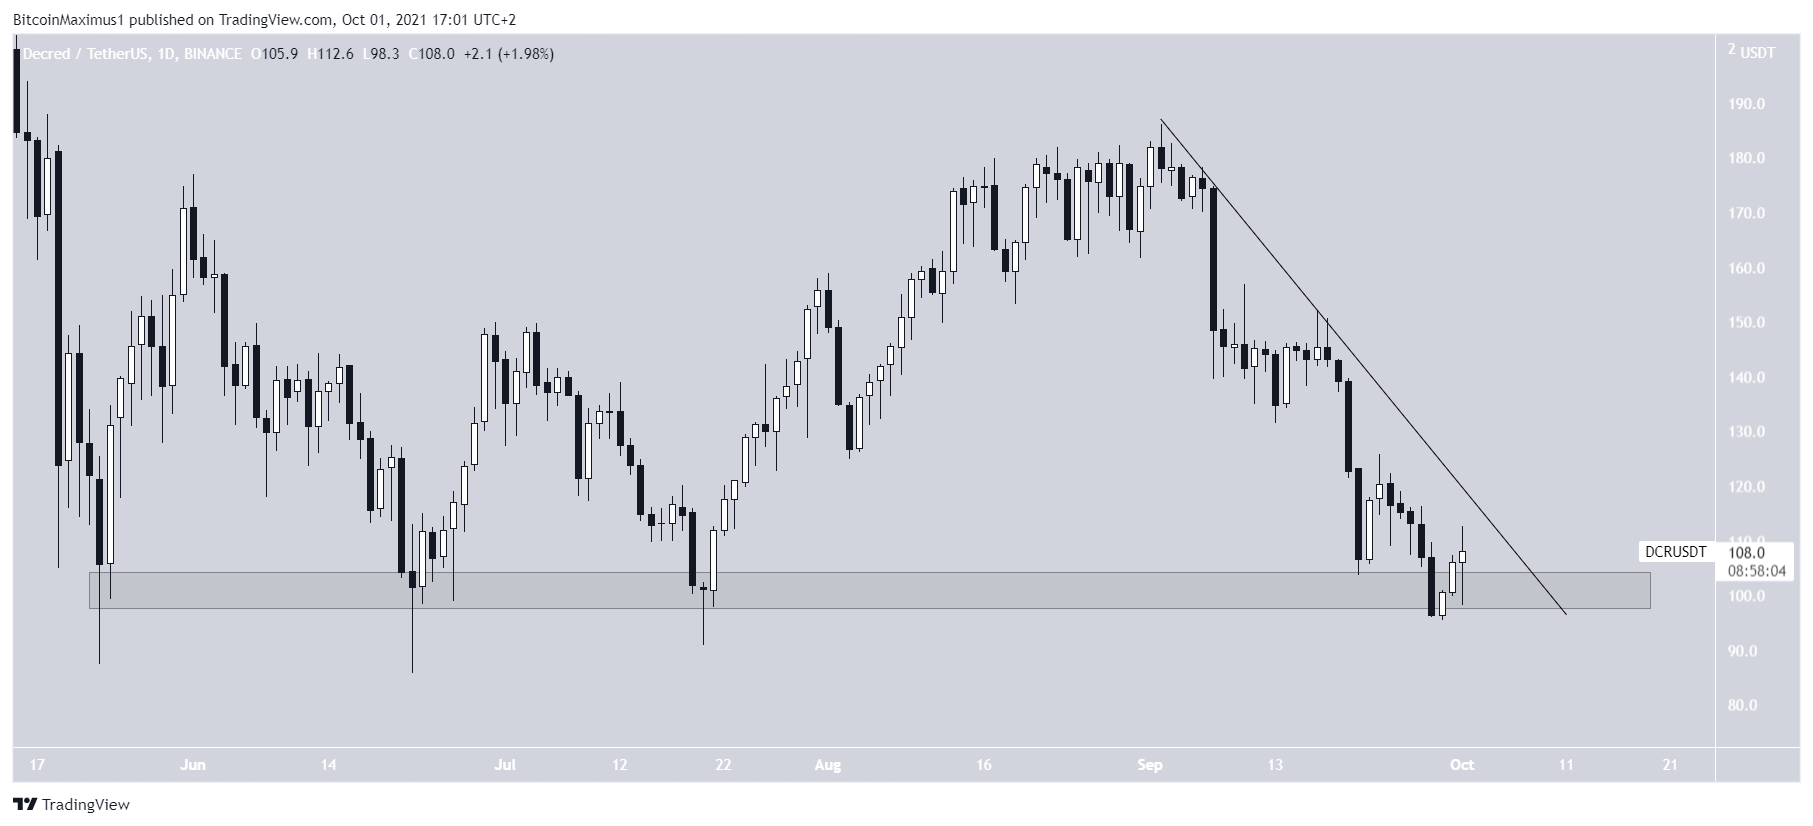
DCR
DCR has been decreasing since Sept 2. On Sept 28, it reached a low of $96 and bounced, validating the $100 support area for the fourth time since the end of May.
However, the bounce has been weak so far. Furthermore, DCR is still following a descending resistance line. Until it breaks out, the short-term trend cannot be considered bullish.
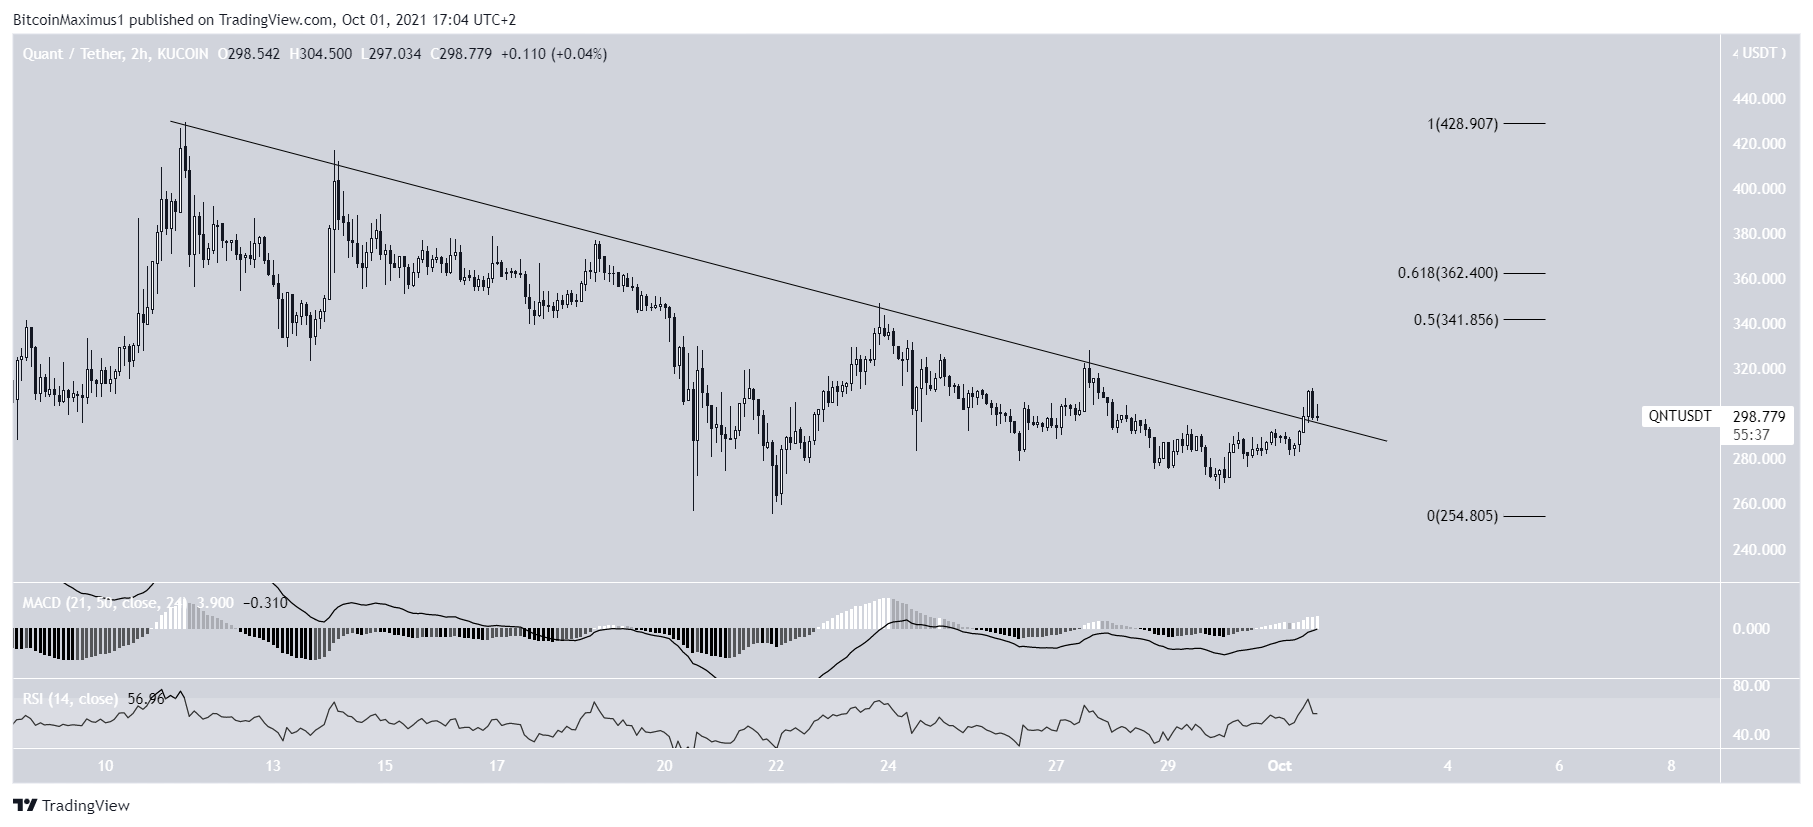
QNT
QNT has been decreasing underneath a descending resistance line since reaching an all-time high price of $429 on Sept 11.
The downward movement led to a low of $256 on Sept 21 before the trend reversed.
QNT broke out from the resistance line on Oct 1.
The closest resistance area is between $341 and $362.
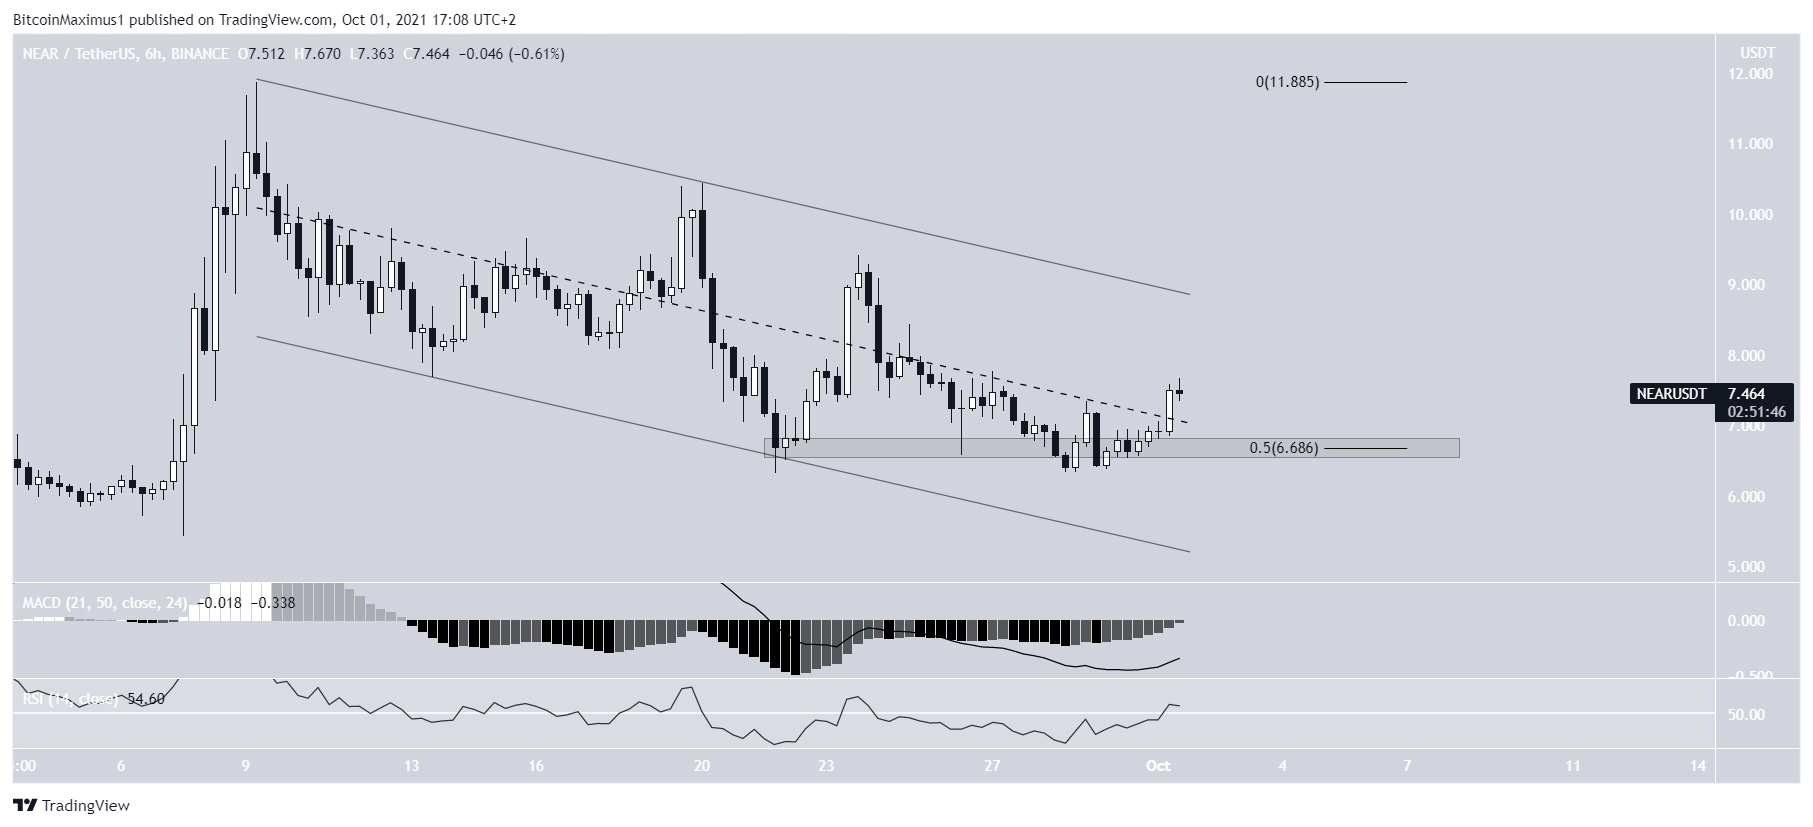
NEAR
NEAR has been decreasing inside a descending parallel channel since reaching an all-time high price on Sept 29. The decrease has been gradual and choppy, indicating that it is likely to be corrective.
In the period between Sept 21-29, the token bounced at the 0.5 Fib retracement support level at $6.70, creating a horizontal support area.
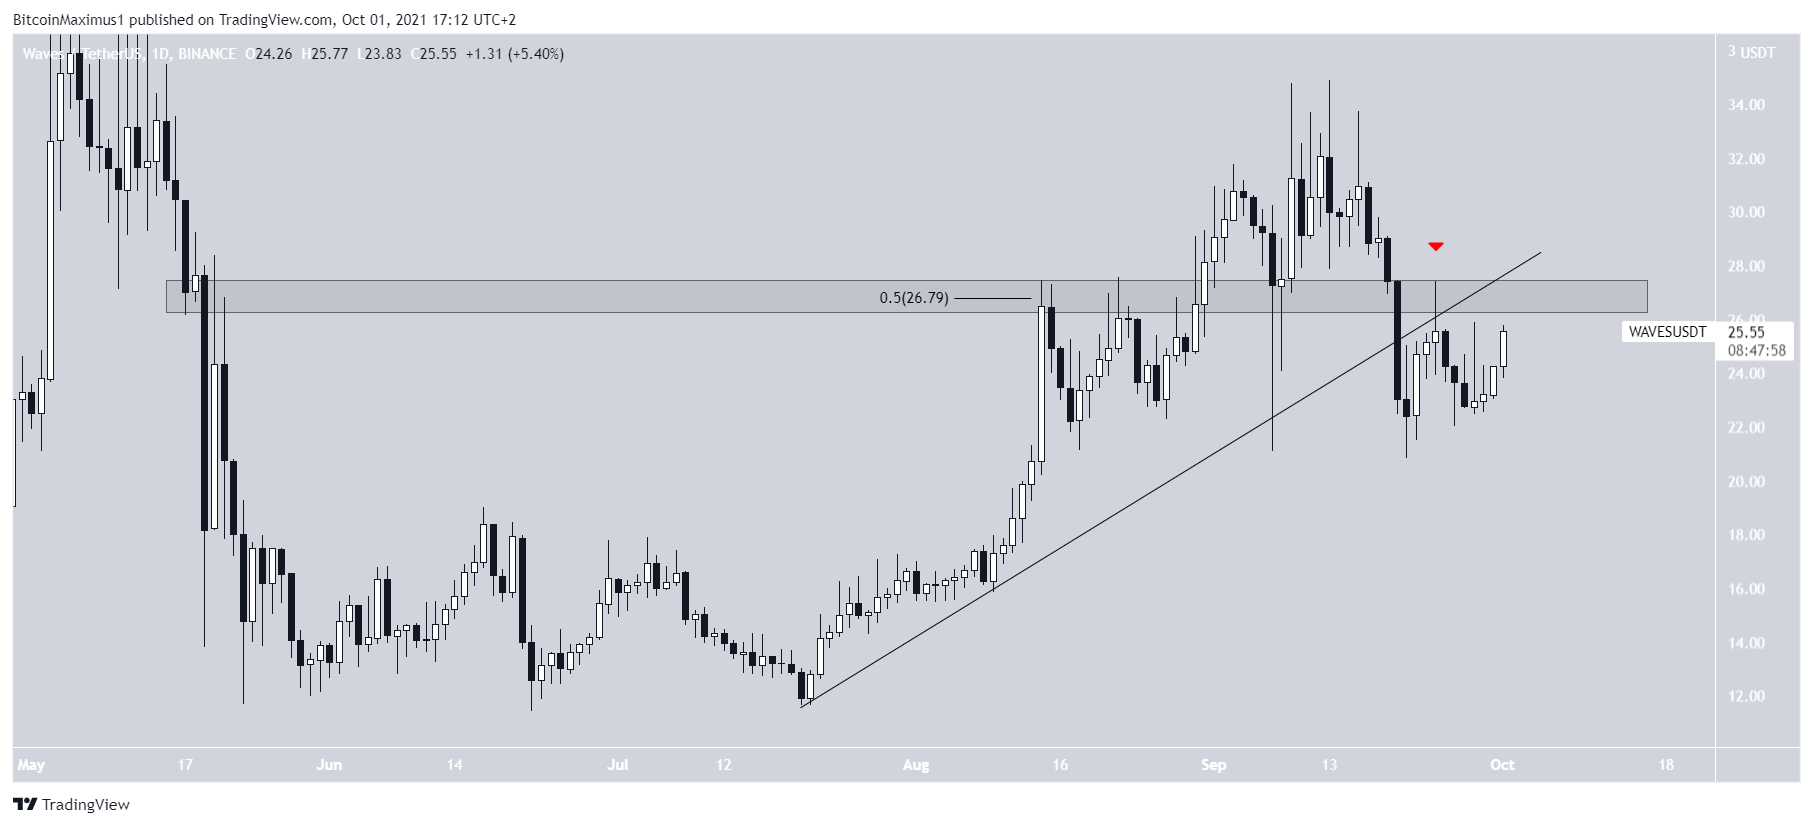
WAVES
WAVES has been moving downwards since Sept 13. On Sept 20, it broke down, from an ascending support line. Four days later, it validated the line as resistance alongside the $26.80 horizontal resistance area (red icon).
Until it manages to reclaim both the resistance area and the previous ascending support line, the trend cannot be considered bullish.
For BeInCrypto’s latest Bitcoin (BTC) analysis, click here.
What do you think about this subject? Write to us and tell us!
