


The past seven days have been mostly bullish for the cryptocurrency industry. Only two tokens have decreased in double digits. The eight tokens that decreased the most last week were:
- Amp (AMP) : -16.78%
- Flow (FLOW): -13.64%
- Telcoin (TEL): -6.78%
- MyNeighborAlice (ALICE): -4.17%
- Decred (DCR): -3.13%
- Theta Fuel (TFUEL): -2.68%
- Shiba INU (SHIB): -1.94%
- Dogecoin (DOGE): -1.50%
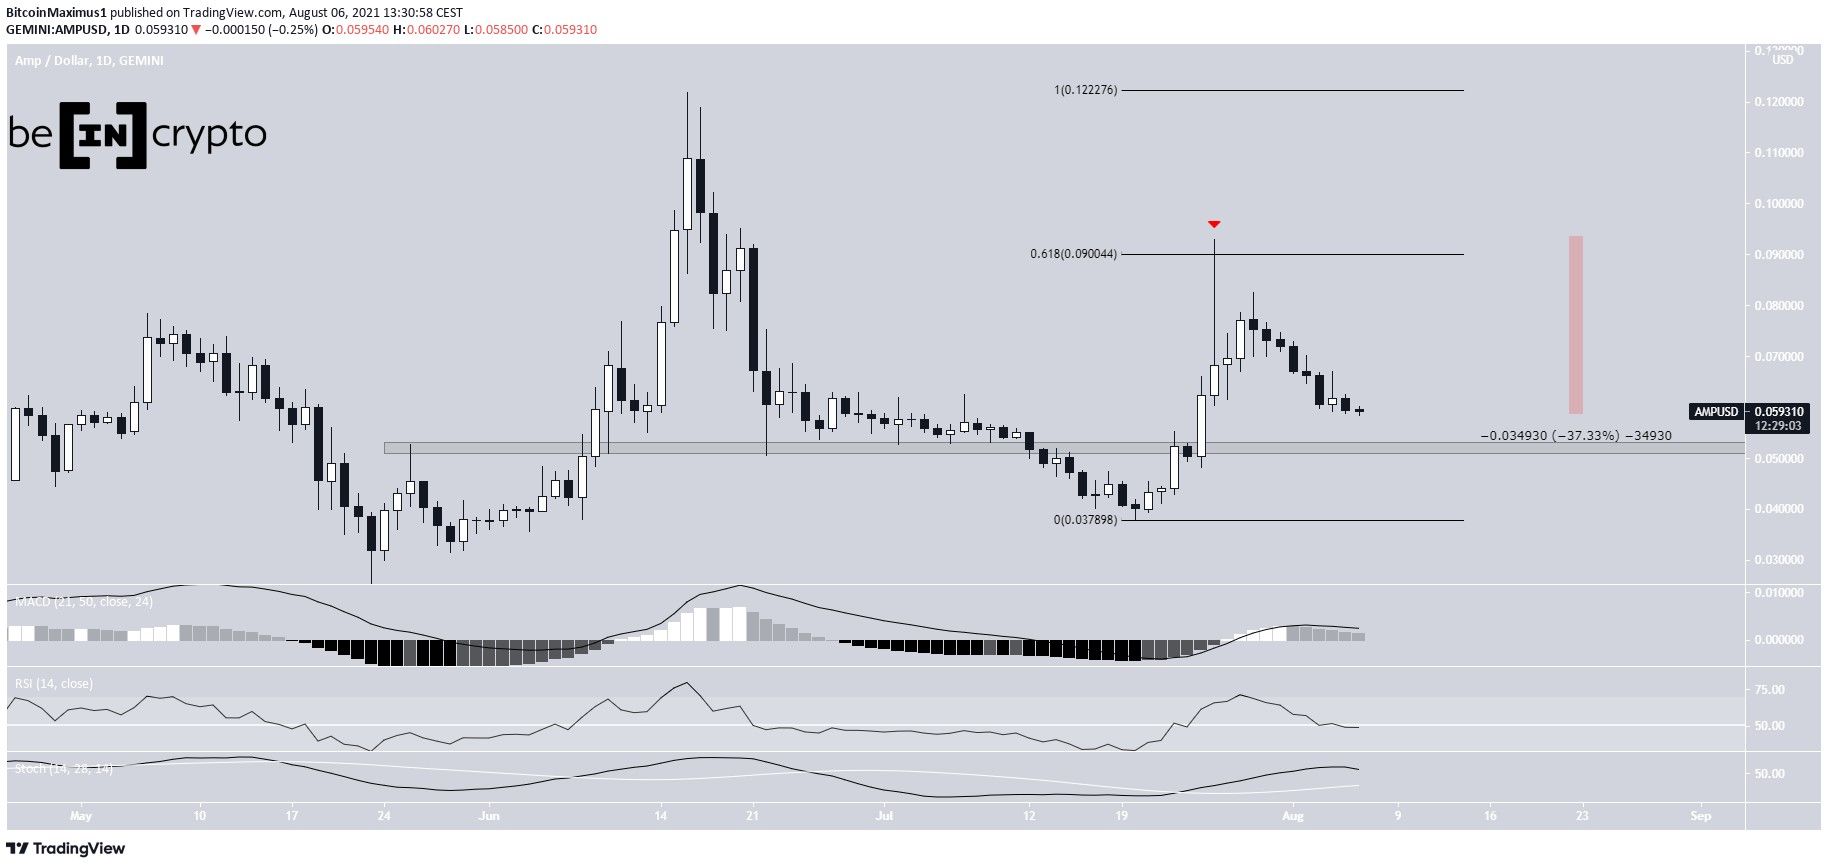
AMP
AMP has been moving downwards since July 26, when it had reached a high of $0.092. The high was made just above the 0.618 Fib retracement resistance level at $0.09. It left a long upper wick in place (red icon).
So far, it has fallen by 36% and is approaching the $0.052 horizontal support area.
At the current time, there are no bullish signs in place.
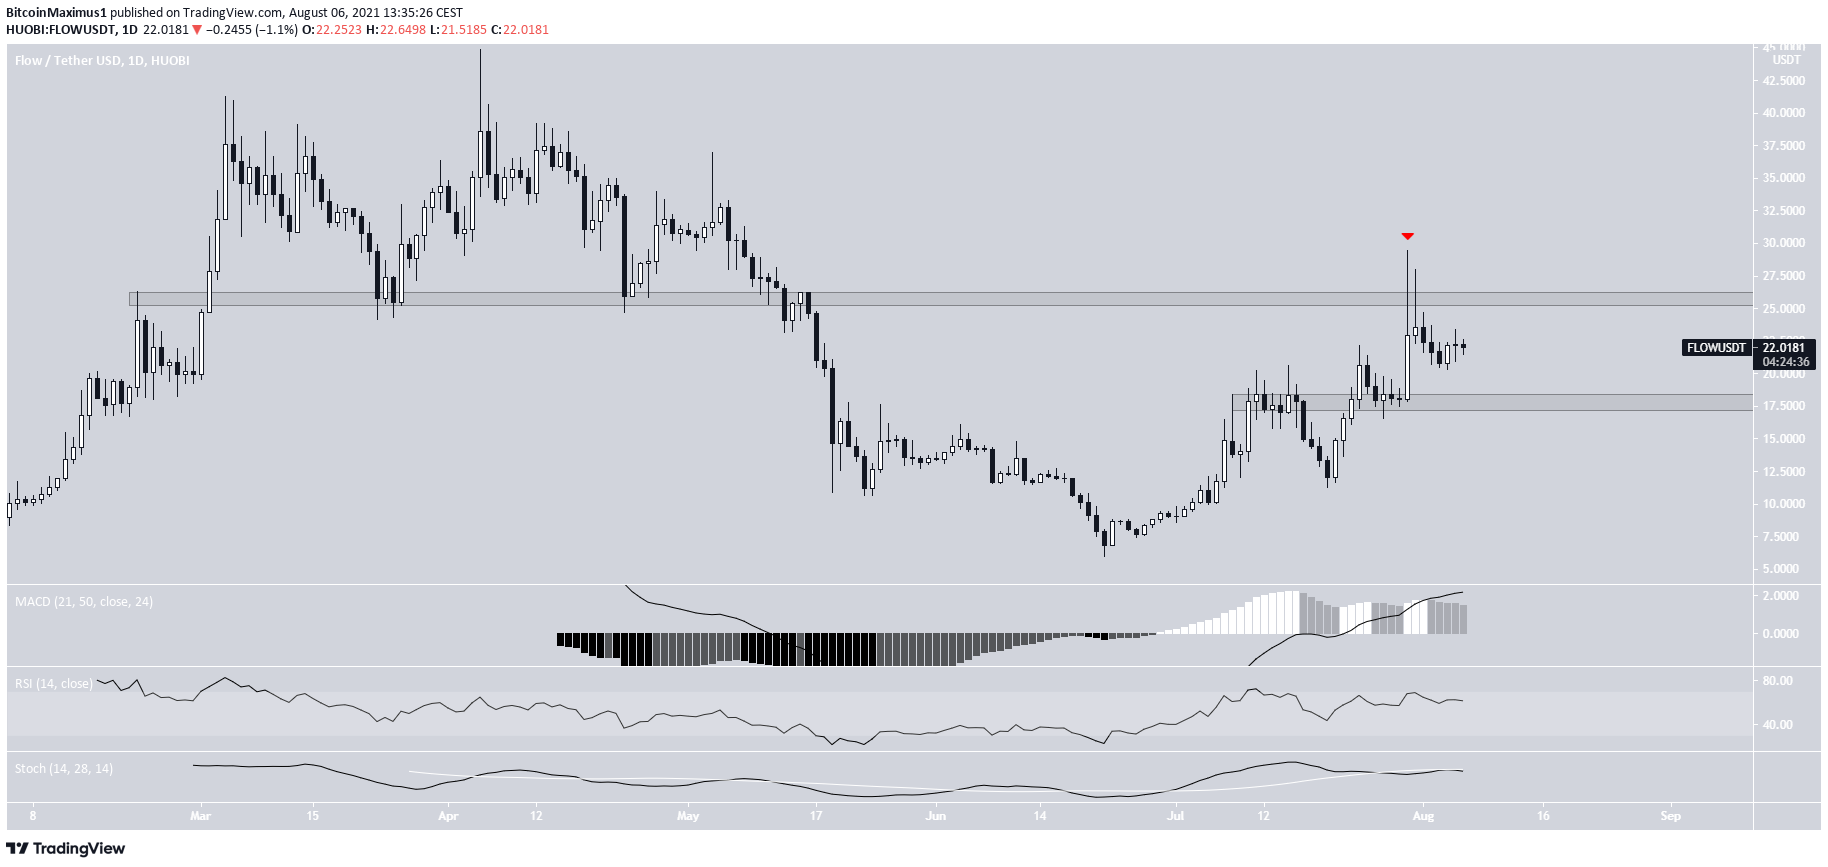
FLOW
FLOW has been increasing since validating the $17.60 area as support on July 27, It managed to reach a high of $29.43 three days later.
However, it failed to sustain the higher prices and created a long upper wick instead (red icon). The ensuing drop validated the $25.80 area as resistance.
Technical indicators are relatively neutral.
Therefore, FLOW could continue consolidating inside the $17.60-$25.80 range.
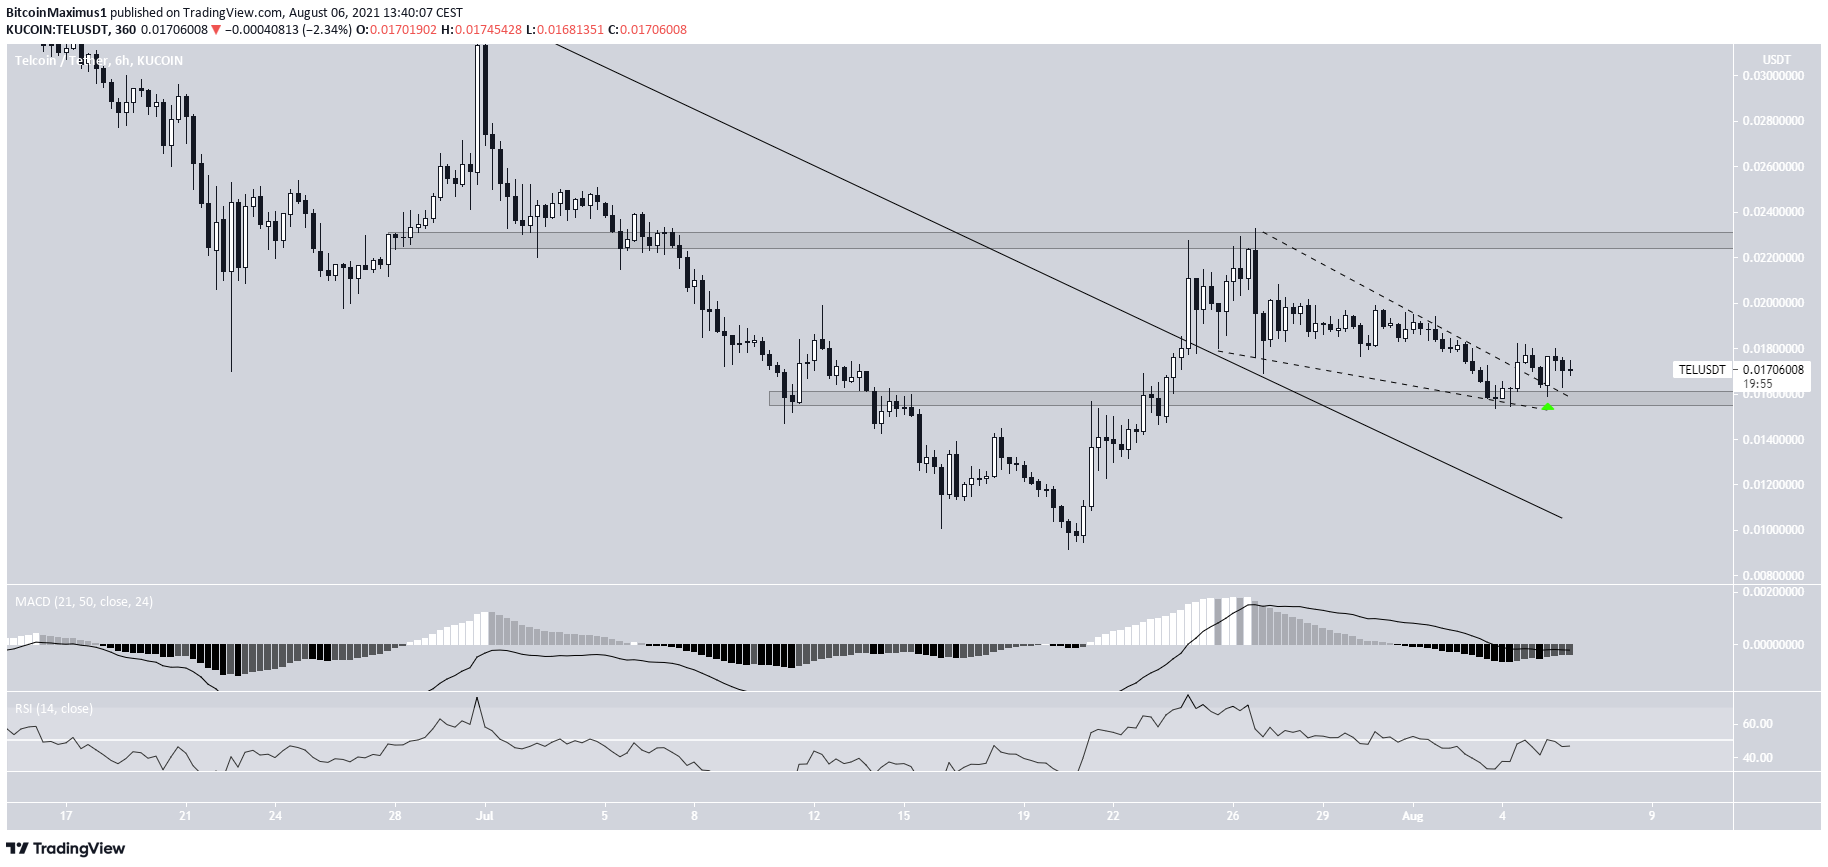
TEL
TEL has been moving upwards since July 20. On July 24, it broke out from a descending resistance line and reached a high of $0.023 two days later.
However, it failed to break out and was rejected by the $0.023 resistance area instead. This led to a low of $0.0158 on Aug. 3.
Afterwards, TEL bounced at the $0.0158 horizontal support area, which is also the 0.5 Fib retracement support level. It broke out from a descending resistance line on Aug. 5 and is currently validating it as support.
If successful, it would likely increase towards the $0.023 resistance area once more.
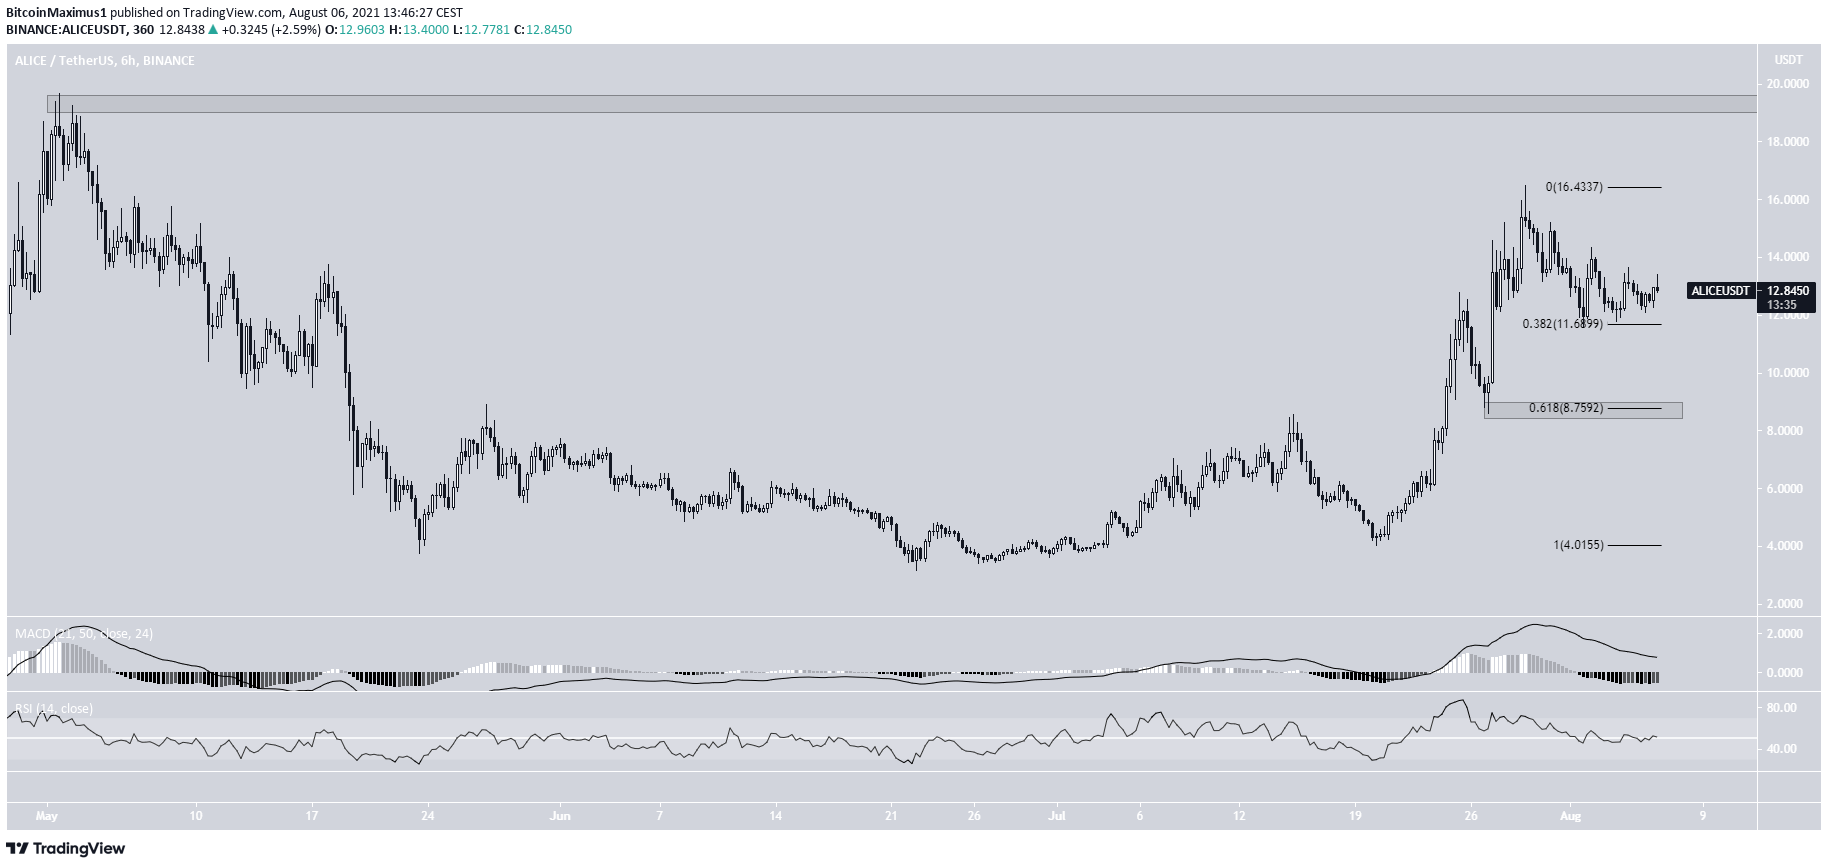
ALICE
ALICE has been moving upwards at an accelerated rate since July 20. This led to a high of $16.5 on July 29.
The token has been moving downwards since and is hovering above the 0.382 Fib retracement support area at $11.70.
Technical indicators are relatively neutral. The RSI is at the 50 line and the MACD is close to 0.
The closest resistance area is at $19 while the next closest support at $8.75.
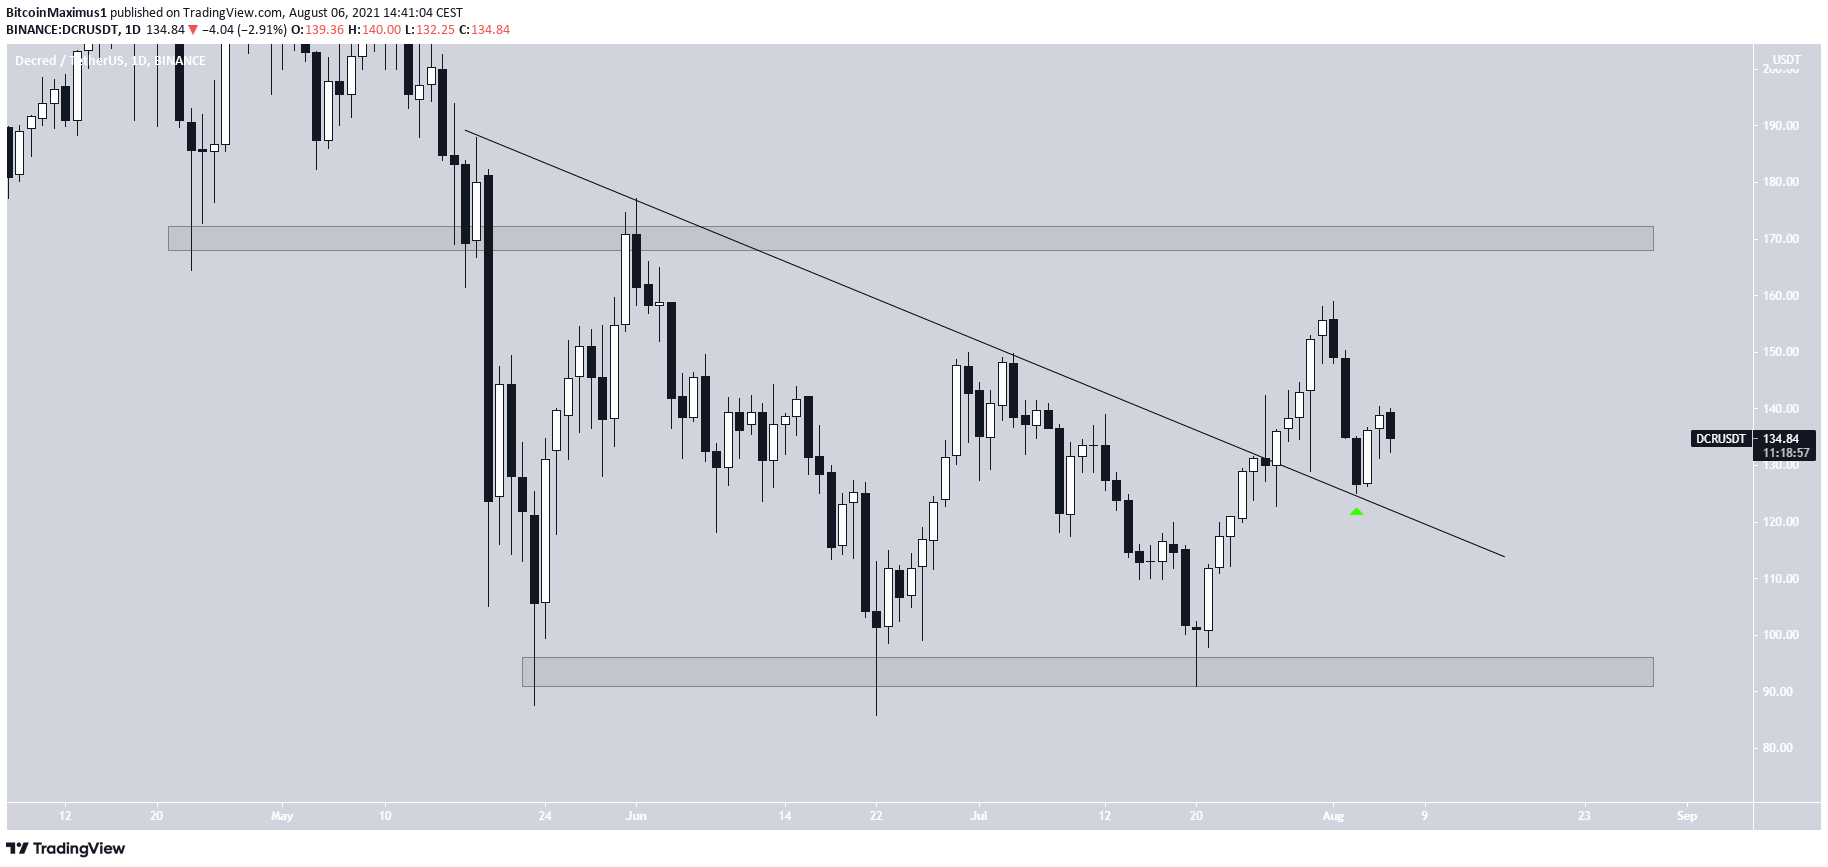
DCR
From May 23 to July 21, DCR completed a triple bottom pattern inside the $94 horizontal support area.
It began an upward movement afterwards and broke out from a descending resistance line on July 27.
DCR reached a high of $158.93 on Aug. 1 before decreasing. Currently, it is in the process of validating the resistance line as support (green icon).
If successful, the next resistance area would be at $170.
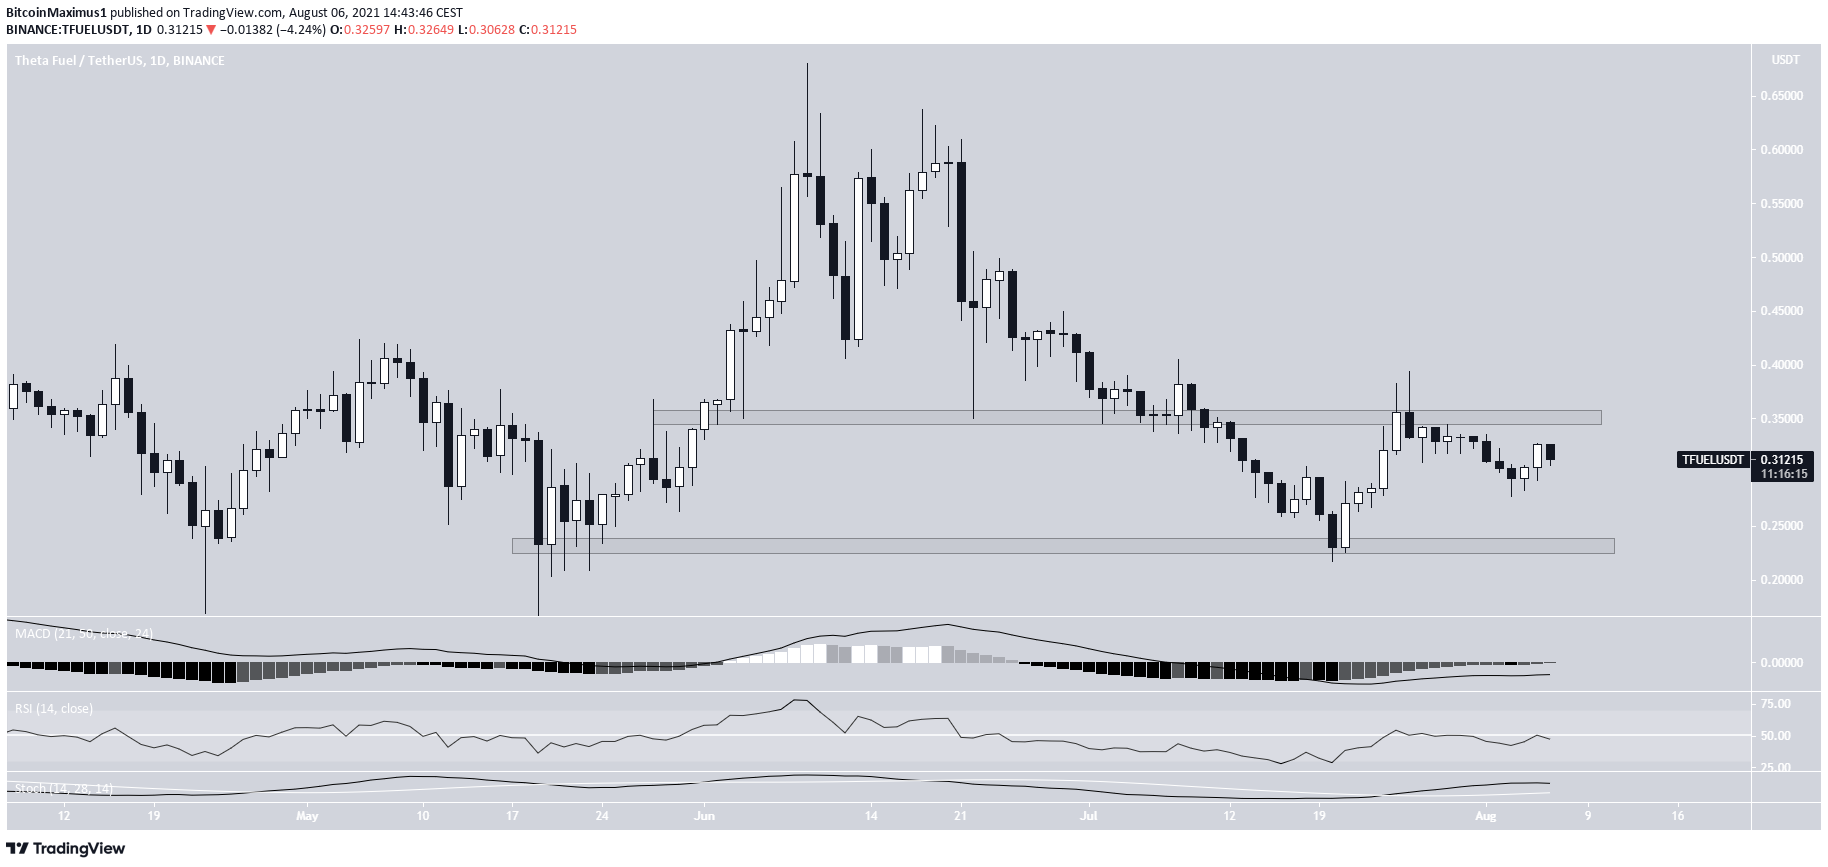
TFUEL
On July 20, TFUEL reached a low of $0.217 and bounced. The movement validated the $0.23 horizontal area as support (green icon).
The ensuing bounce led to a high of $0.393 on July 26. However, TFUEL failed to break out above the $0.35 resistance area and was rejected instead (red icon).
Currently, it is trading in the middle of the $0.21-$0.39 range. Technical indicators are also relatively neutral. Whether the token breaks out or down from this range will likely determine the direction of the future trend.
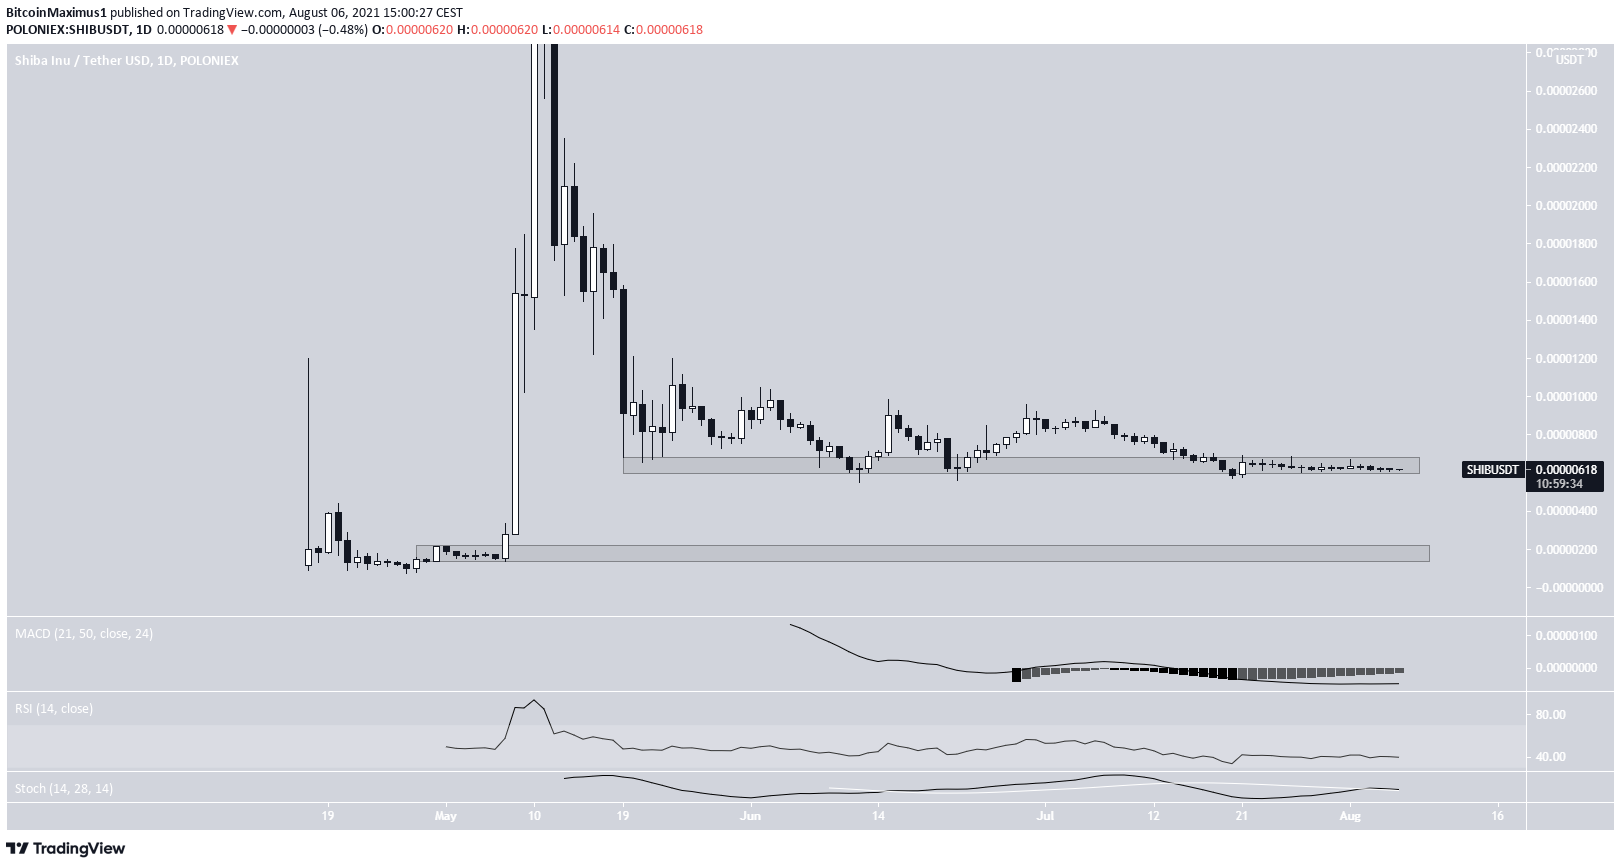
SHIB
SHIB has been trading inside the $0.0000064 support area since May 19. Furthermore, it has been trading virtually at the same level since July 20.
Technical indicators are completely neutral.
However, each successive bounce has been weaker than the preceding one, a sign that momentum is fading away.
If a breakdown were to occur, the next closest support area would be at $0.00000170.
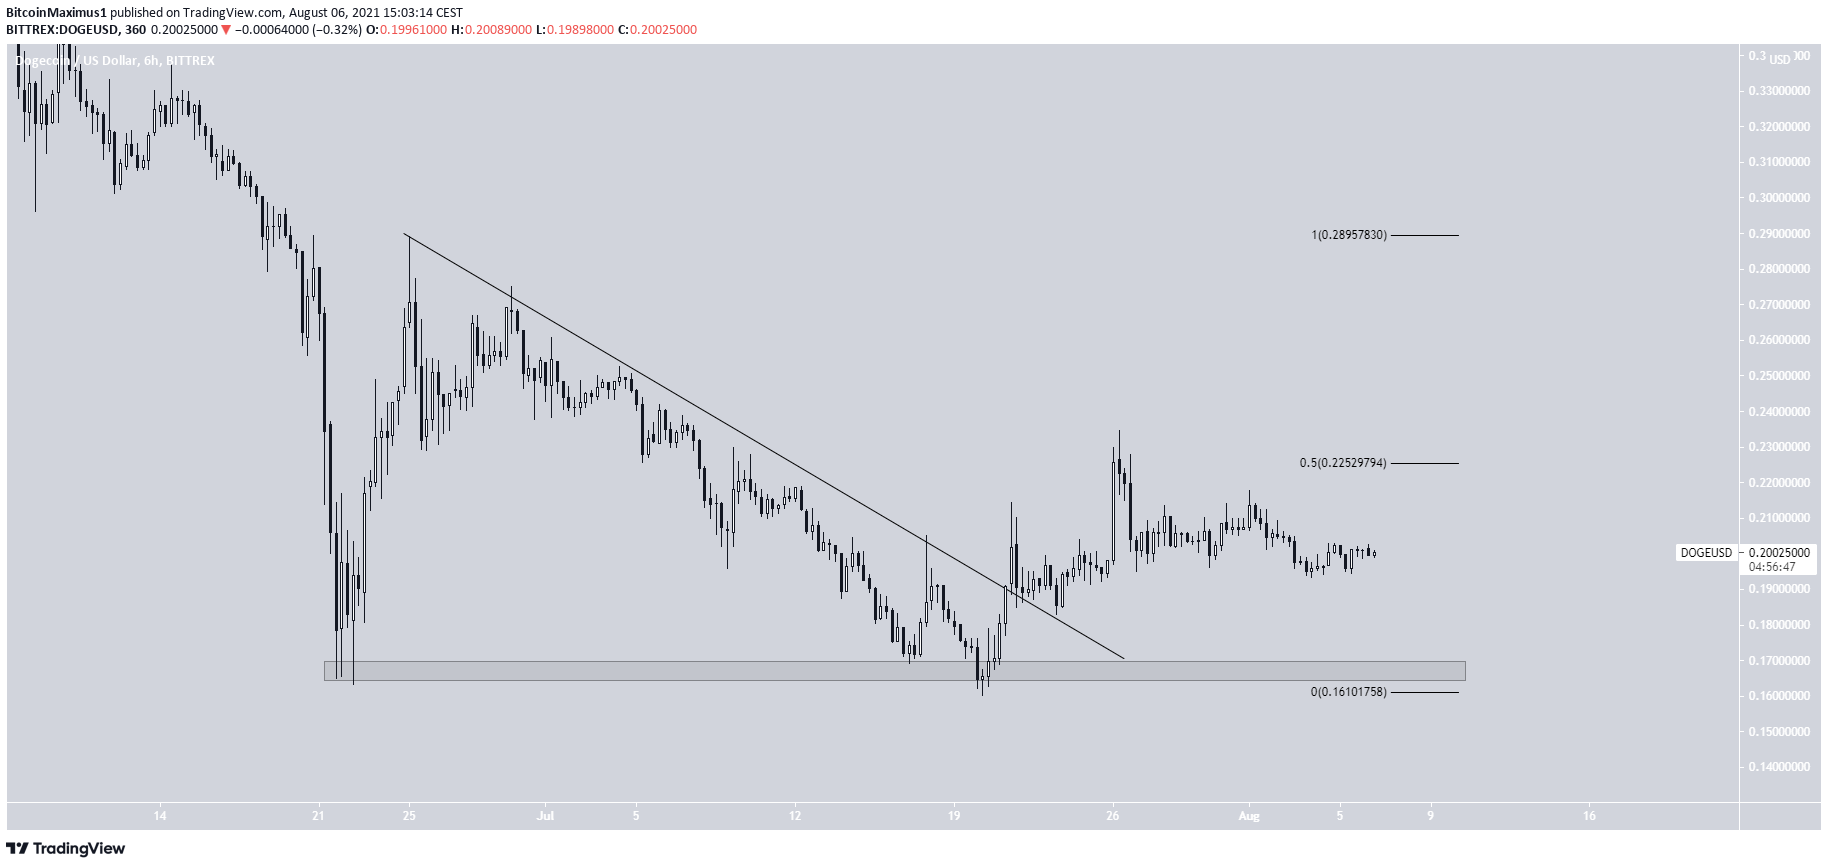
DOGE
On June 22 and July 21, DOGE completed a double bottom pattern inside the $0.165 horizontal support area and broke out from a descending resistance line afterwards.
It reached a high of $0.234 on July 26, but was rejected by the 0.5 Fib retracement support level.
It is currently attempting to create a higher low in anticipation of another upward movement.
For BeInCrypto’s latest bitcoin (BTC) analysis, click here.


