


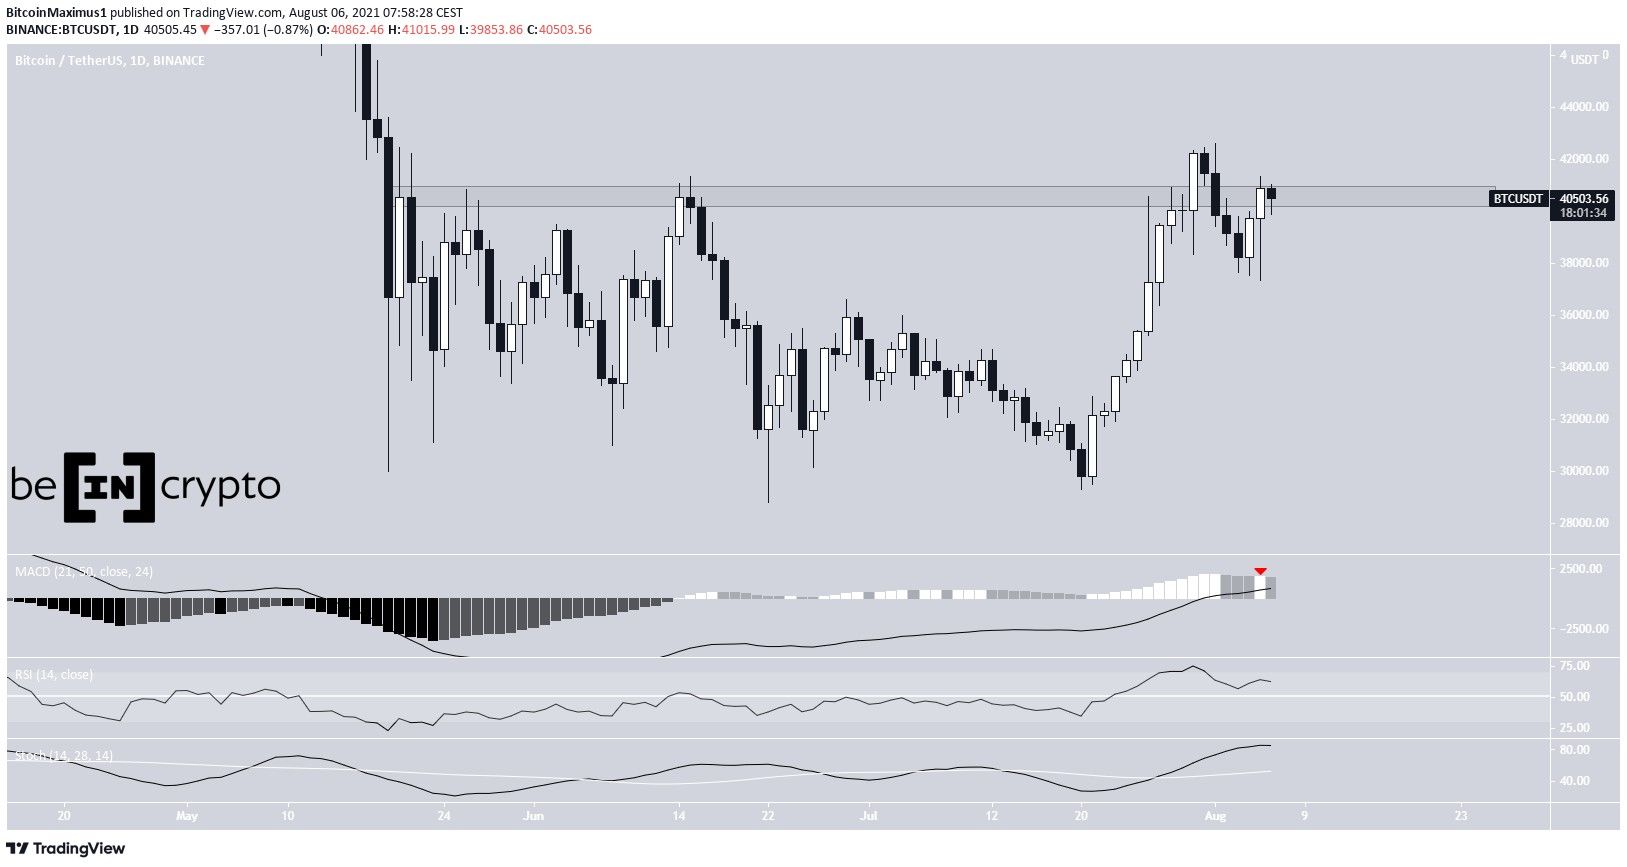
Bitcoin (BTC) has been moving upward since Aug 5 and is back inside the $40,550 resistance area, which has been in place since May 19.
It could be in the process of completing its corrective retracement after the original drop. If true, BTC could get rejected by the area and fall after.
BTC back at range highs
BTC reached a low of $37,332 on Aug 5. However, it immediately began moving upwards, creating a very long lower wick in the process and reached a bullish close of $40,862.
It’s currently trading inside the range high of $40,550. The resistance area has been in place since May 19, with the exception of the deviation above it between July 30 – Aug 2.
Technical indicators for BTC are somewhat neutral. The MACD created a higher momentum bar, but it looks like it’s beginning to decrease again. Both the RSI and Stochastic oscillator are bullish but are showing decreasing momentum.
Future movement
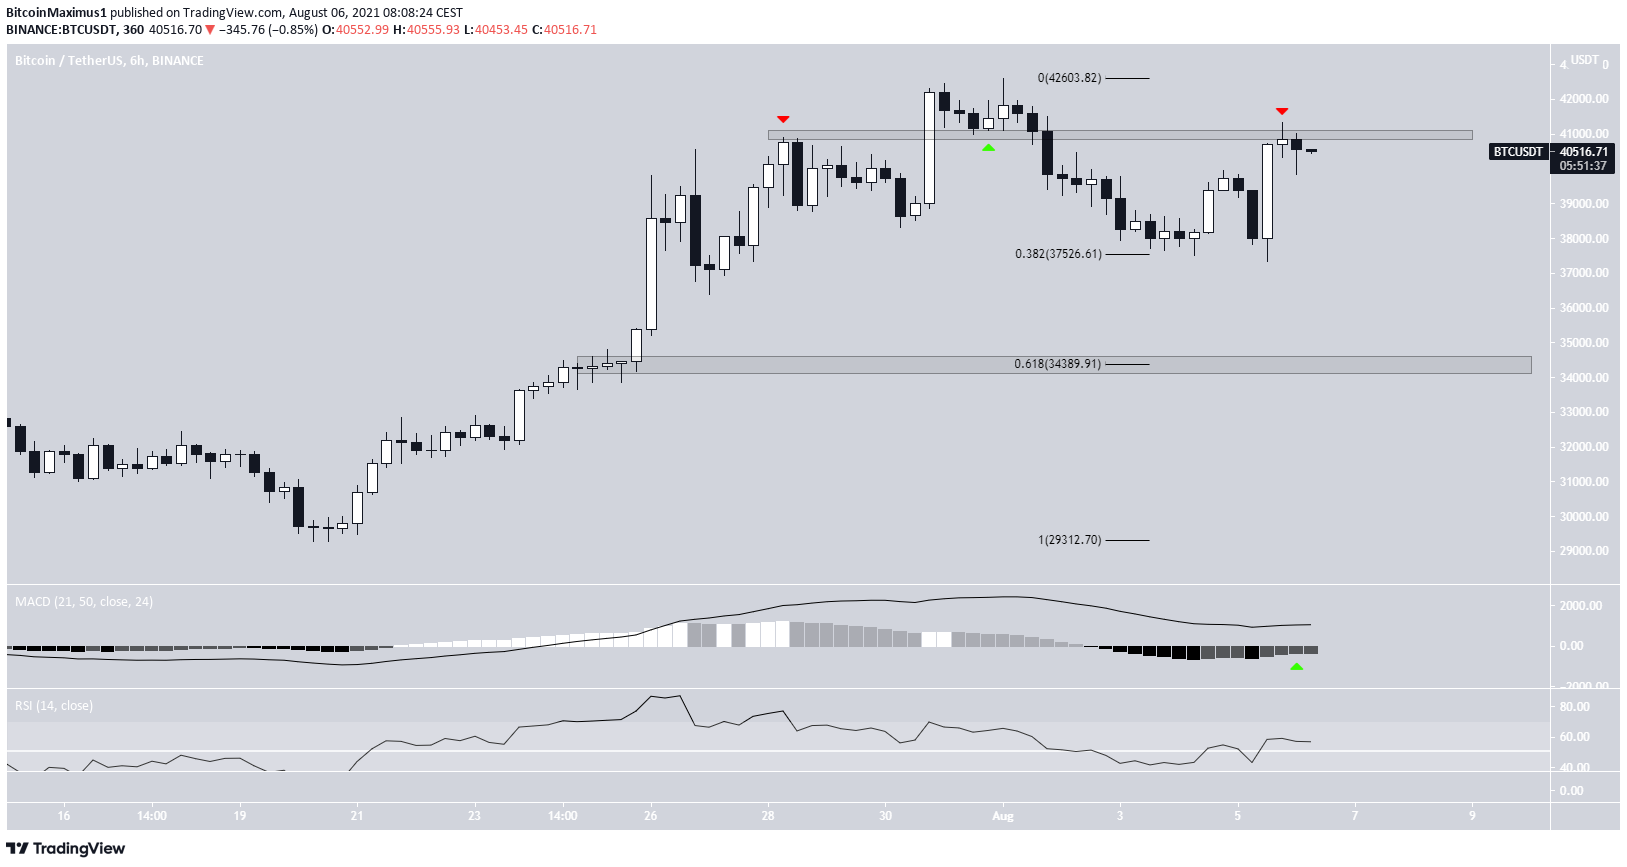
The six-hour chart shows that the rebound in price began after BTC reached the 0.382 Fib retracement support level at $37,525 and created a double bottom.
It’s currently facing a minor resistance level at $41,000. This area has intermittently acted as both resistance and support (red and green icons).
While the MACD is turning bullish, the RSI is neutral and sitting at the 50-line.
If a rejection occurs, the next support area would be found at $34,390.
Wave count
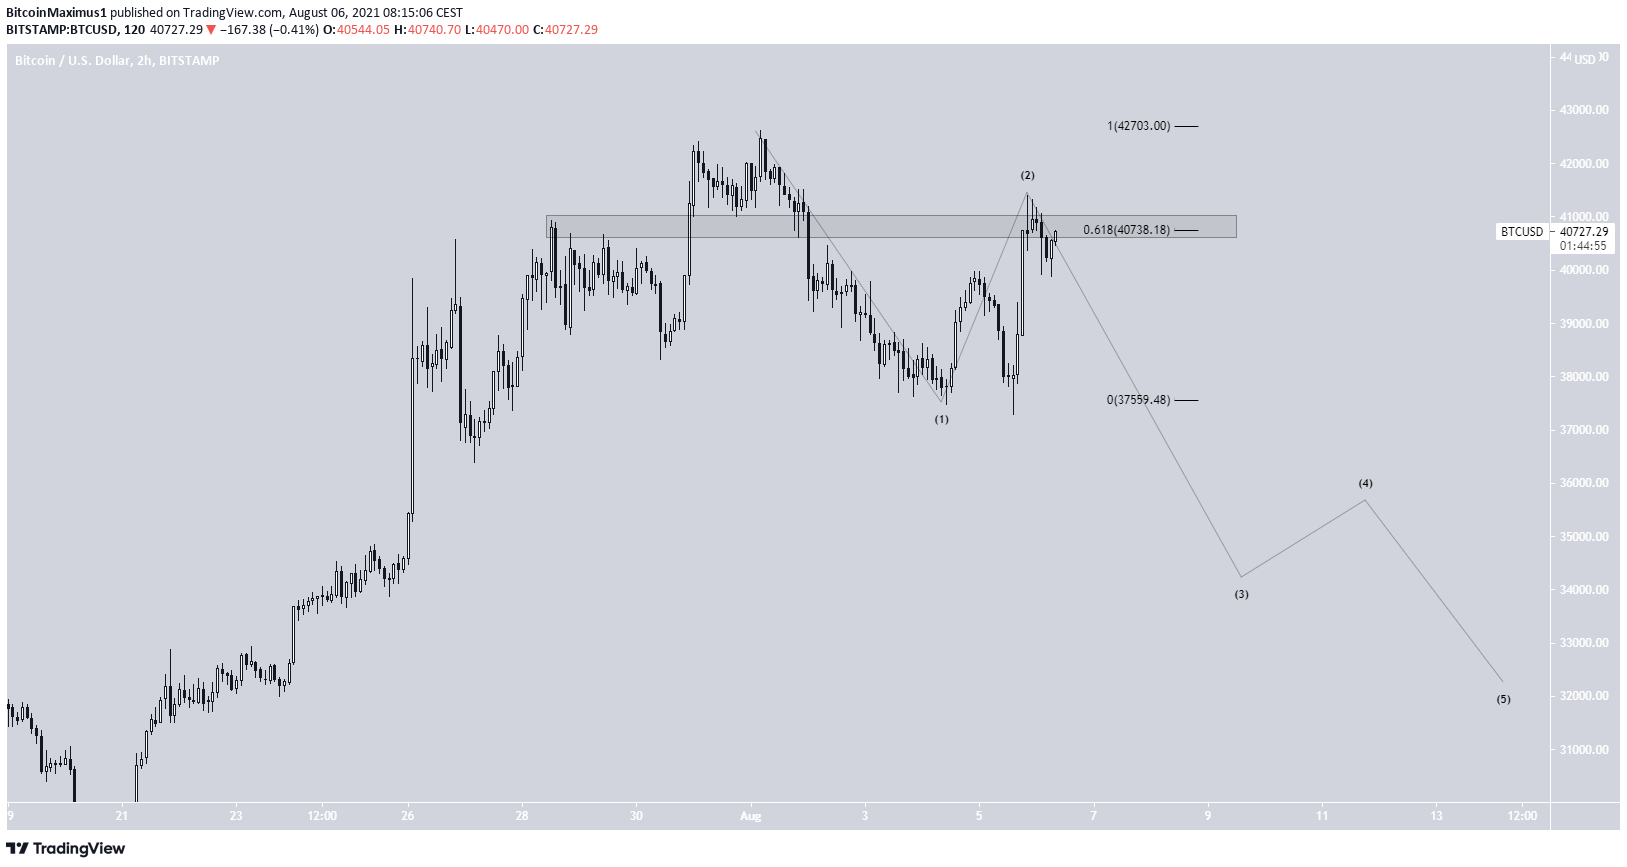
The wave count suggests that BTC is in wave two (black) of a bearish impulse that began with the $42,599 high on Aug 3.
If correct, BTC is currently in the process of completing sub-wave two at the 0.618 Fib retracement resistance level of $40,750. This is also a horizontal resistance area.
An increase above the aforementioned high of $42,599 would invalidate this particular wave count.
For the longer-term count, click here.
For BeInCrypto’s previous bitcoin (BTC) analysis, click here.



