![Has VeChain Reached Its 2019 High? [Premium Analysis]](/_mfes/post/_next/image/?url=https%3A%2F%2Fassets.beincrypto.com%2Fimg%2FAeHqvfj0ZFhpBvXP4l33J0cfCsk%3D%2Fsmart%2F15a9ce5b601b4f67bce6e9b2a8cd39a4&w=1920&q=75)
The VeChain price has likely reached its high for 2019 and a corrective period awaits. A short-term upward move could occur before the price resumes its downward movement.
The VeChain (VET) price began the year 2019 at 106 satoshis. It increased until April, reaching highs near 160 satoshis. However, it began its corrective period in October — reaching lows near 30 satoshis. The upward move that began on October 25 briefly caused the price to increase above its January 1, 2019 price. However, these prices could not be sustained and VET has been correcting since.
Cryptocurrency trader @imbagsy stated that the VeChain price has likely reached a local high and a period of retracement awaits. Before this movement transpires, however, the price could initiate a short relief rally. The outlined support areas are found at 67 and 50 satoshis.
$VET update:
Sniped the local top on this, reached target 1 at 80 sats and nearing target 2 at 62 sats; could see some short-term relief to retest 80 sats; ultimately I see this retracing further. pic.twitter.com/knLWhXmzkL
— Bagsy (@Bagsy) December 18, 2019
Will the VET price retrace to the support areas or will it reach new highs? Keep reading below if you are interested in finding out.
VeChain Elliot Formation
The VET price movement from October 25 to December closely resembles a five-wave Elliott formation. Since then, it looks as if the price has finished the A wave of an A-B-C correction. The “relief rally” mentioned in the tweet would constitute the B wave, after which another downward wave is expected to take place.
Our support areas are slightly different from those mentioned in the tweet. The VeChain price is currently inside the 70 satoshis minor support area, with the next support areas found at 60 and 50 satoshis, respectively.
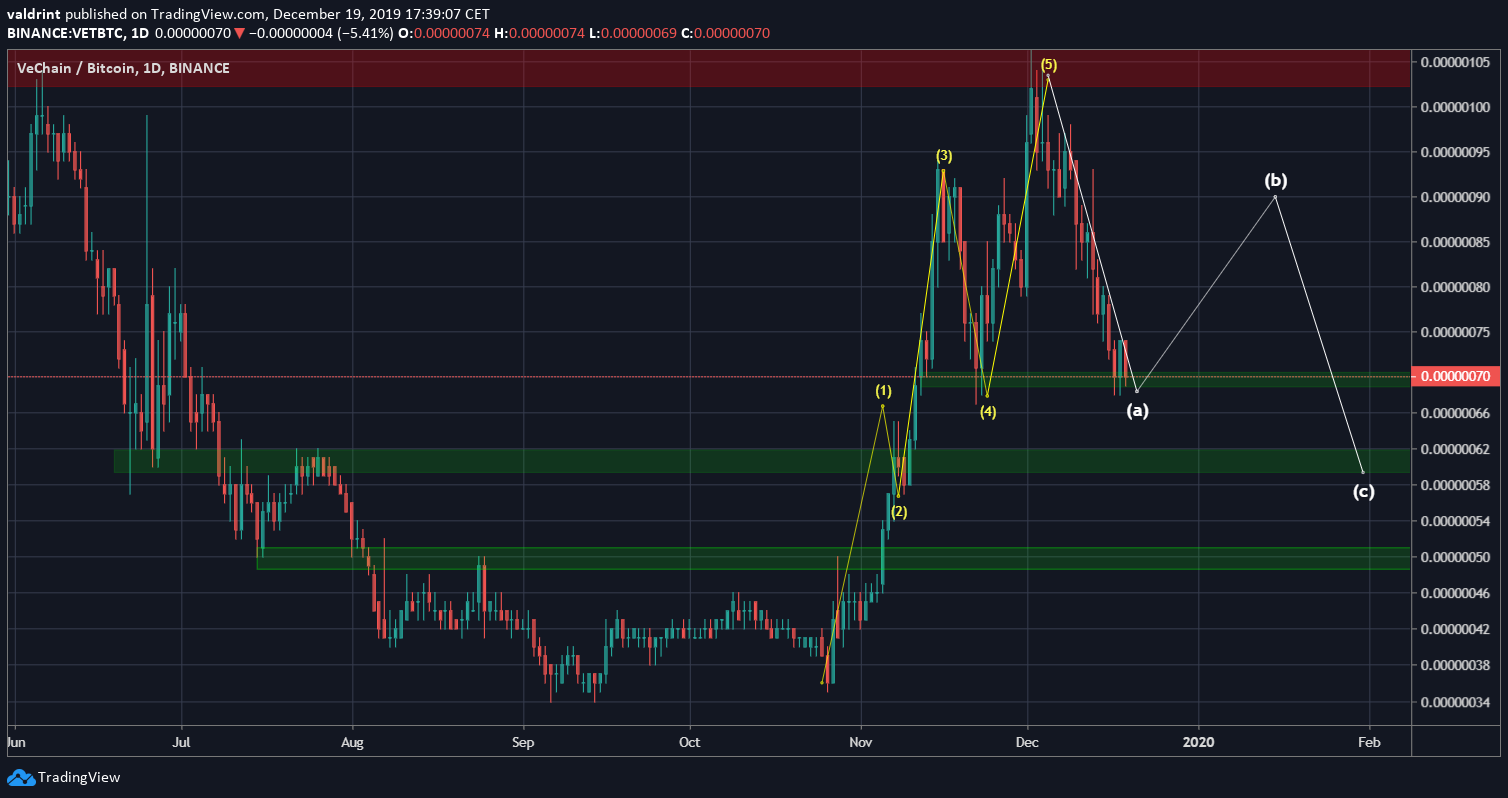
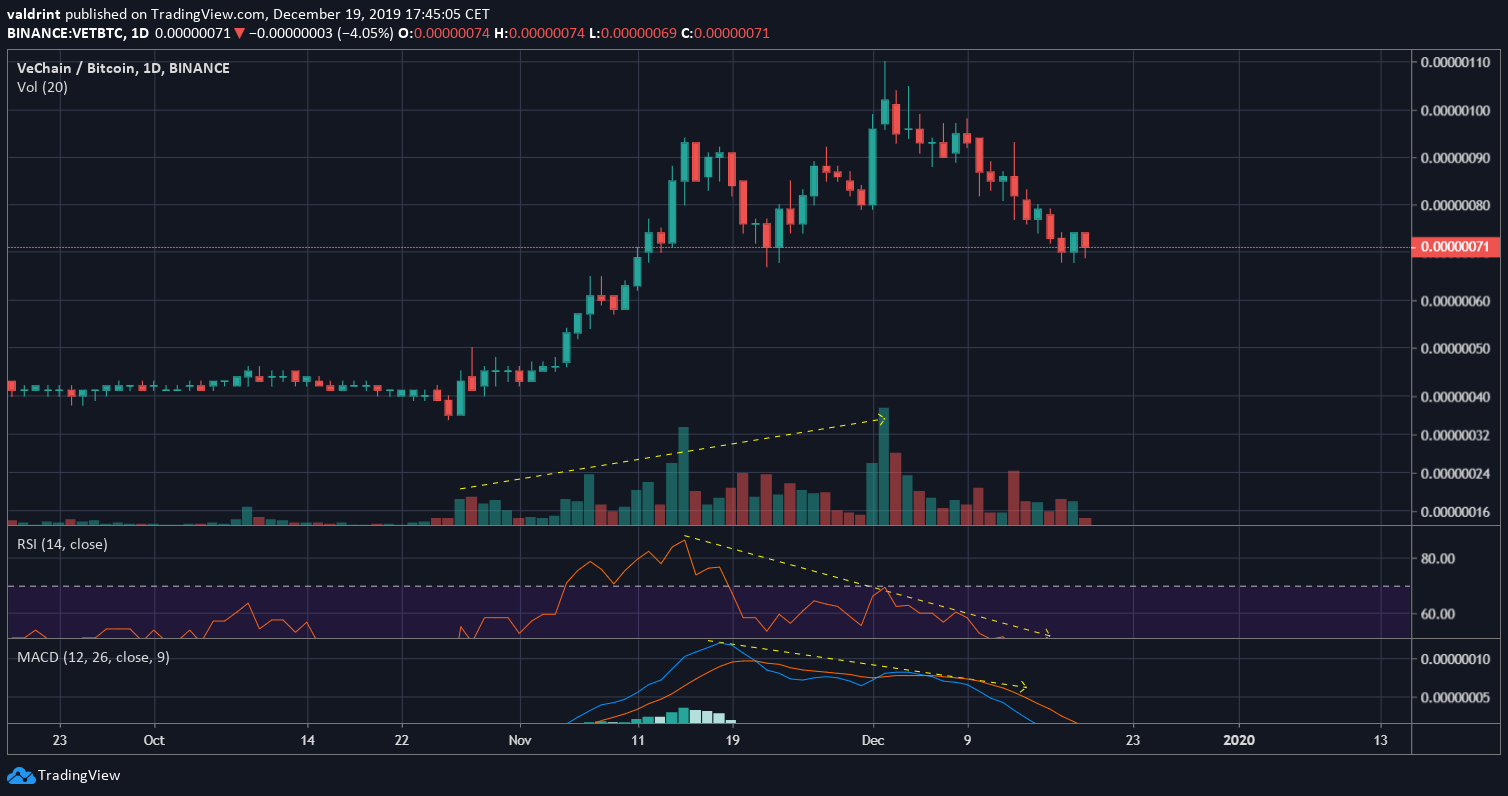
However, volume was increasing throughout and was at its highest on December 2, when the high of 110 satoshis was reached. Elliott theory dictates that volume should be the highest on wave three and decrease afterward. While this does not invalidate the possibility of the formation, it casts some doubt on its validity.
Long-Term Chart
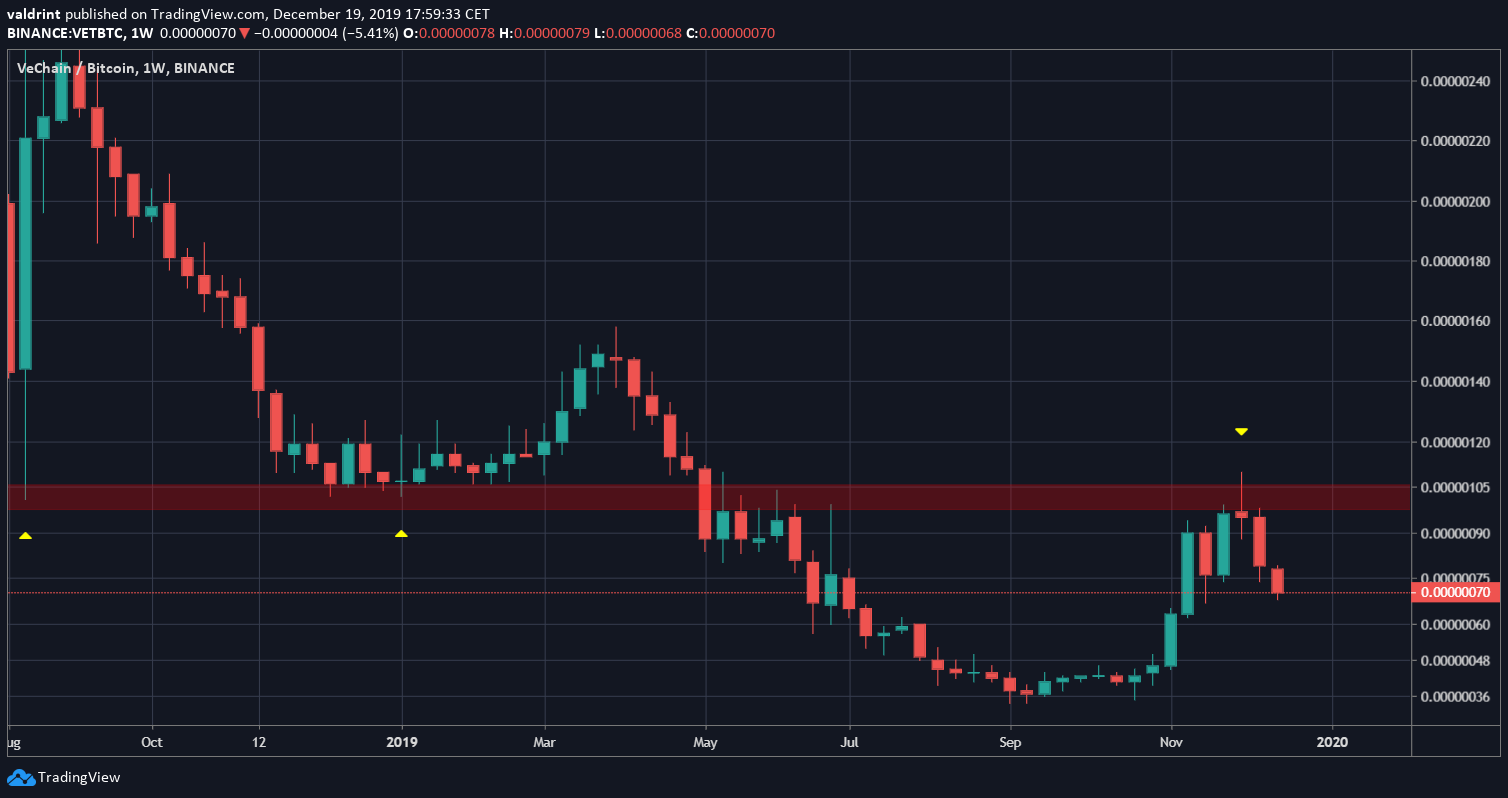
The biggest sign that the VET price will continue to decrease is given from the weekly time-frame.
The 100 satoshi area acted as support throughout 2018 and the first half of 2019. After the price broke down in May 2019, it continued its decrease and made new all-time lows until it eventually made a bottom near 36 satoshis.
The current rally only served to validate the resistance area. The price was rejected afterward and has been decreasing since. Therefore, until the price flips the resistance area and validates it as support, the long-term outlook should be considered bearish.
B Wave
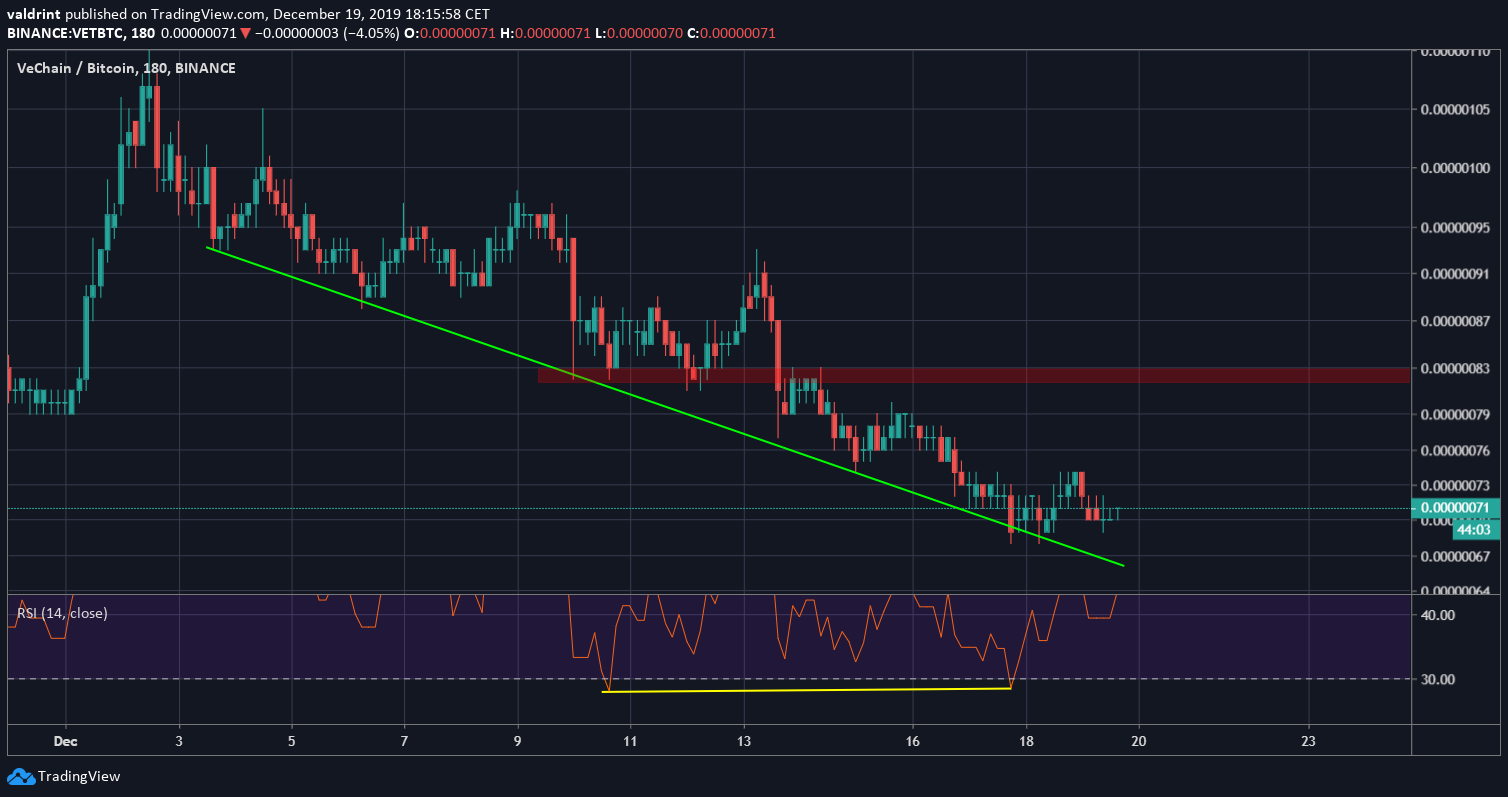
The short-term movement supports the formation of the B wave. The VET price has been following a descending support line since reaching the 110 satoshi high.
In addition, the RSI has been generating bullish divergence. If such a move were to occur, which seems likely, it would possibly end near 83 satoshis — and then the price would resume its downtrend.
To conclude, we believe the VET price has reached a local high. After a possible rally towards 83 satoshis, we expect the price to eventually decrease to 60 and possibly 50 satoshis.
