
Reserve Rights (RSR) has been decreasing alongside a descending resistance line since reaching an all-time high on April 16.
Technical indicators are providing bullish signals and the price has bounced at an important horizontal level.
Reclaiming horizontal support
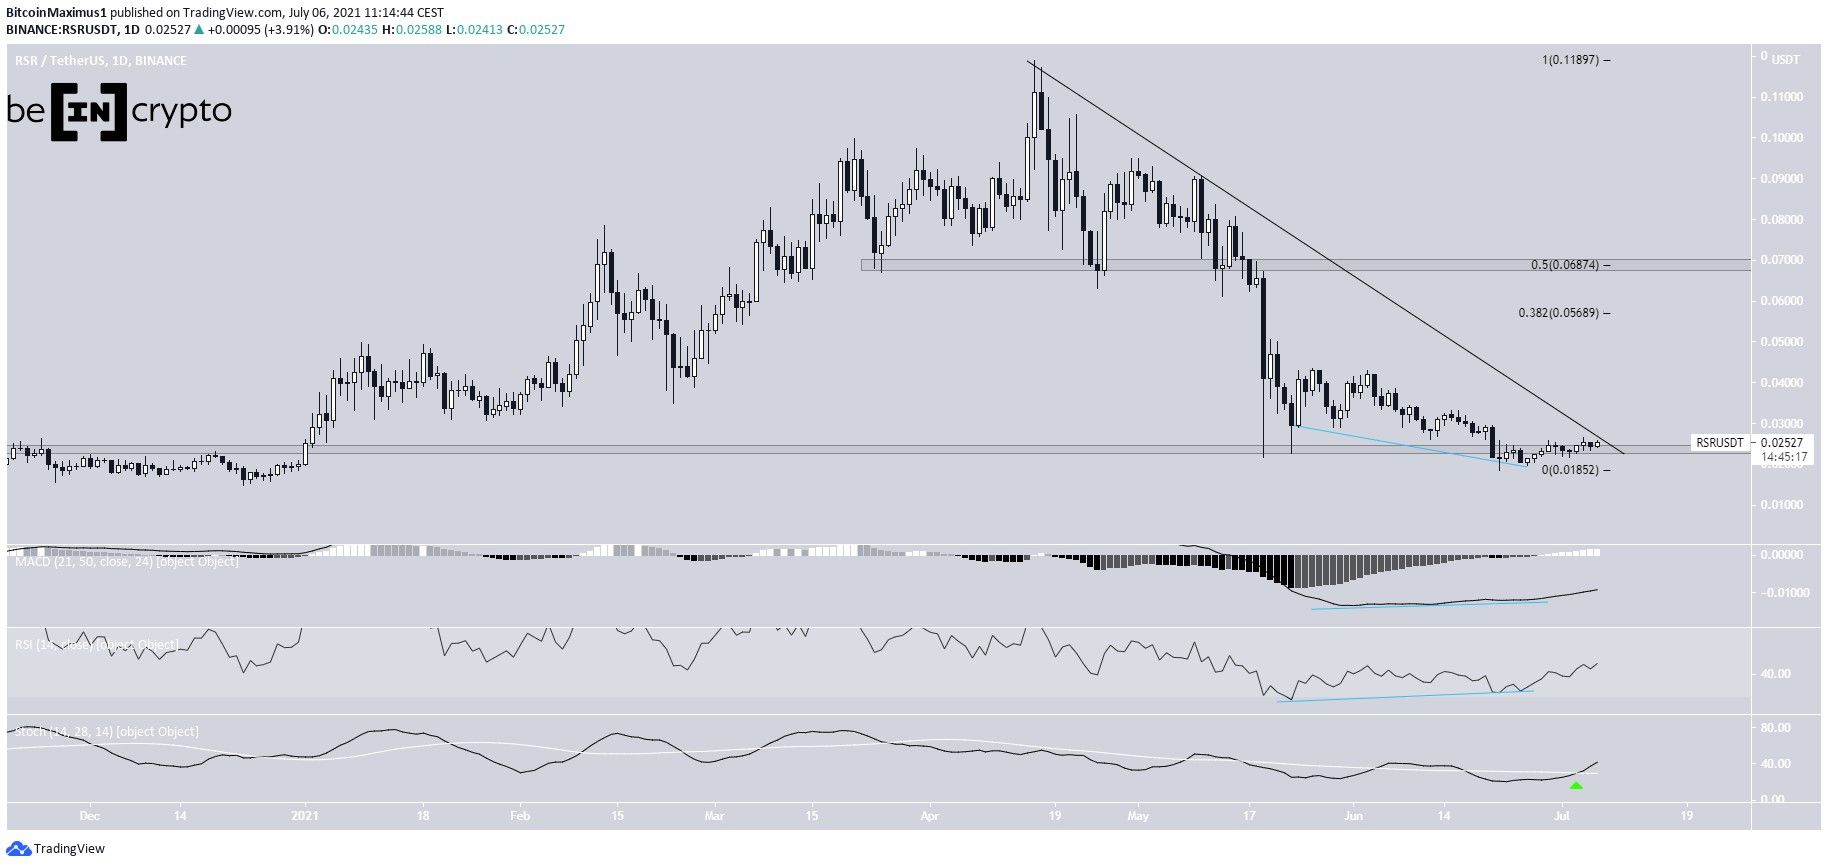
RSR has been falling since April 16, after reaching an all-time high of $0.119. The decrease culminated with a local low of $0.0185 on June 22.
This initially seemed to cause a breakdown below the $0.025 horizontal area. However, RSR has reclaimed the line since, making the previous drop just a deviation.
In addition, the low was combined with bullish divergences in both the MACD signal line and the RSI. This is normally a strong sign of a bullish trend reversal. In addition to this, the Stochastic oscillator made a bullish cross.
However, RSR has yet to break out from a descending resistance line that has been in place since the all-time high.
If it’s able to break out above the line, the closest resistances would be at $0.056 and $0.068. These targets are the respective 0.382 and 0.5 Fib retracement resistance levels.
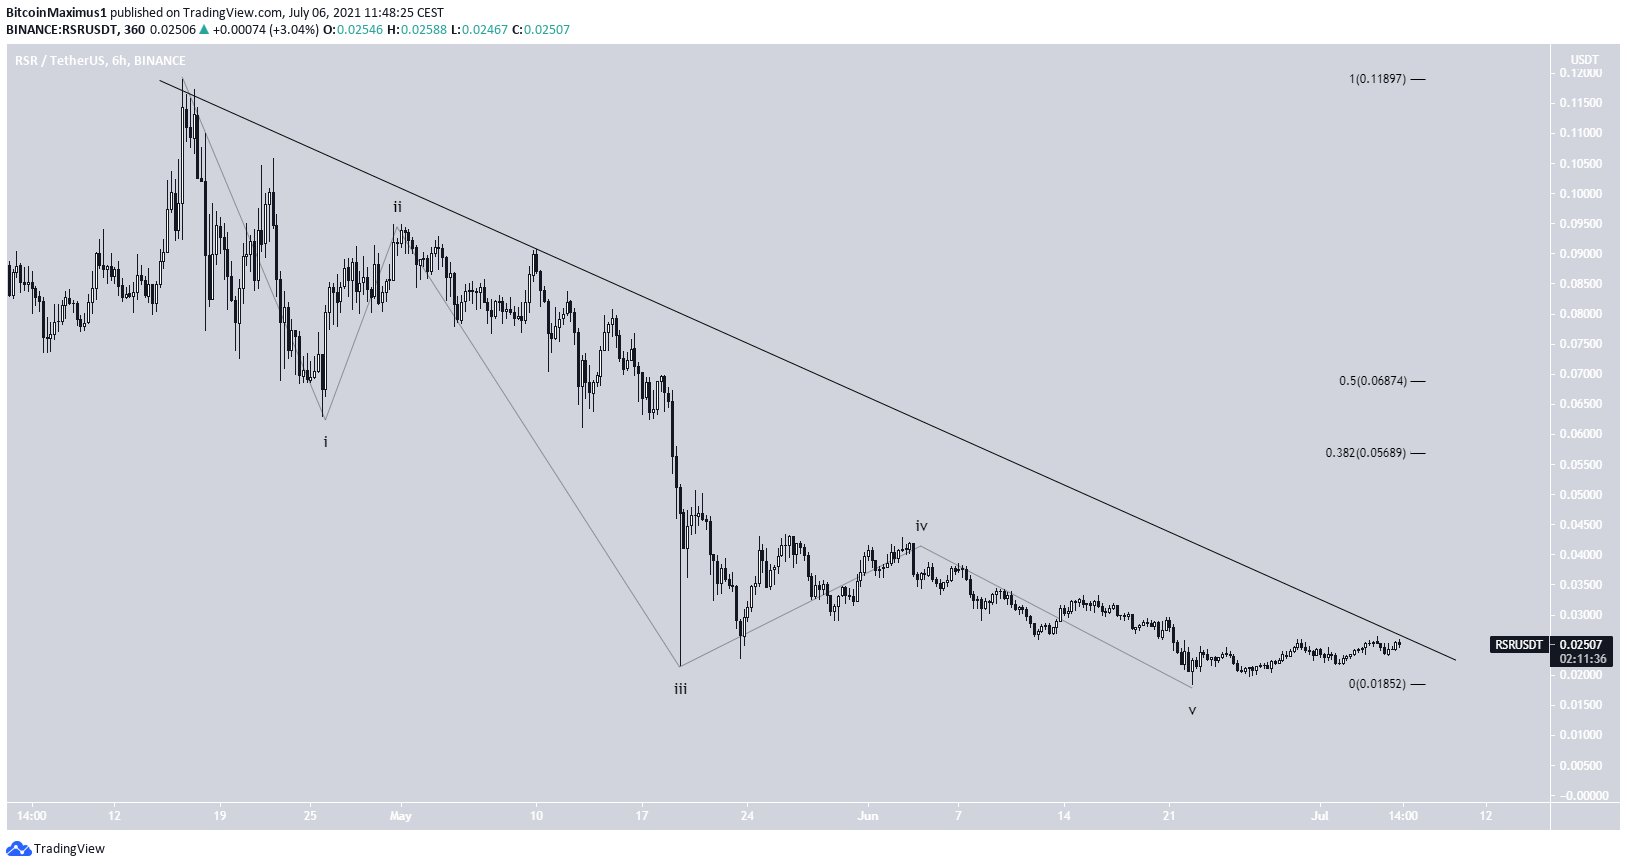
Wave count
Cryptocurrency trader @Mesawine1 outlined an RSR chart, stating that it has a clean long setup if it manages to break out from the daily range at $0.025.
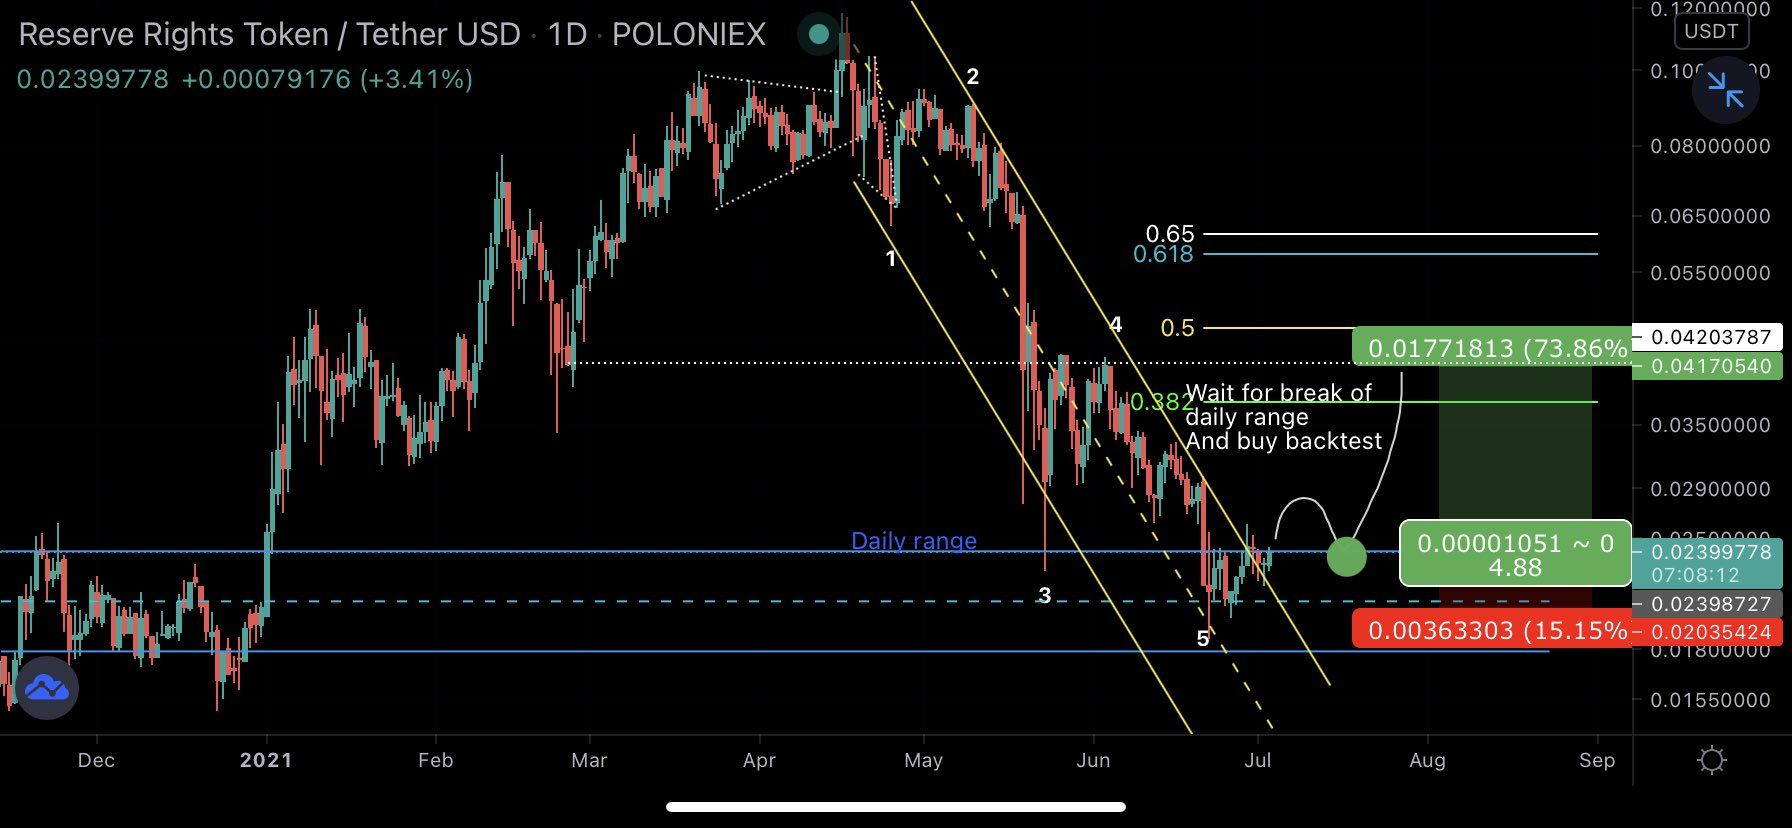
While it does seem that RSR has completed a bearish impulse, there are no bullish signs yet to indicate that the bottom is in.
As stated in the tweet, a breakout from the resistance line and a successful retest would likely confirm that the impulse is complete.
This could lead to an upward movement towards the resistance levels outlined at $0.056 and $0.068.
RSR/BTC
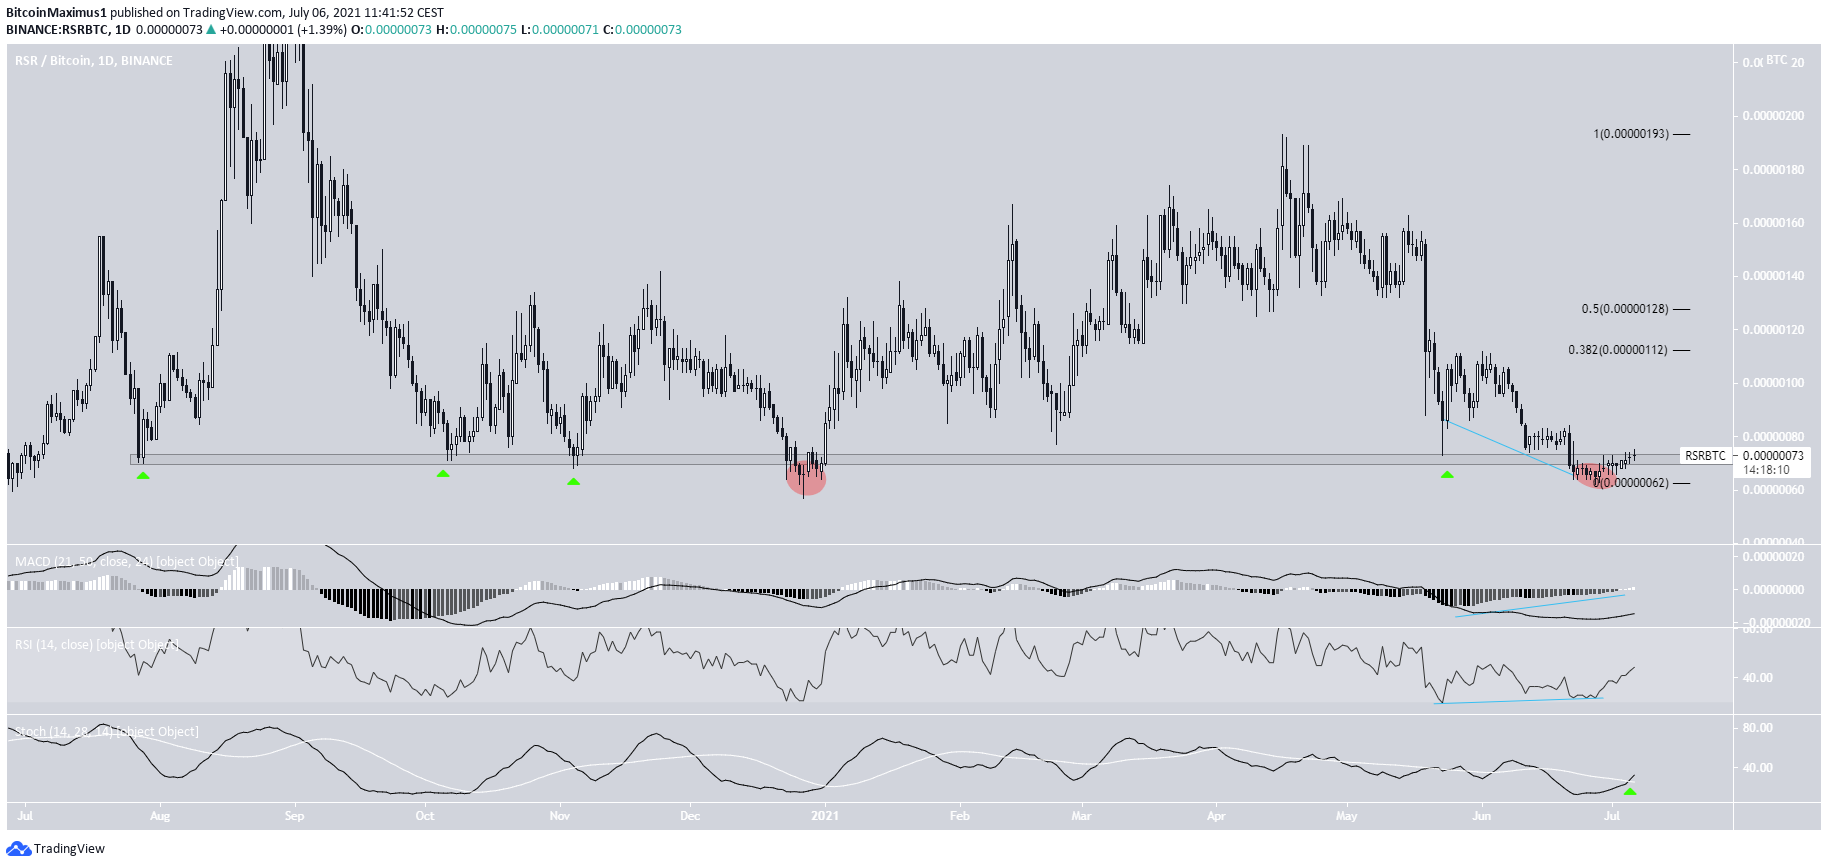
RSR is trading close to the 71 satoshi support area. It has been doing so since August 2020, validating the level four times (green icons).
While it dropped below the area in December 2020, it reclaimed it shortly afterwards.
It fell below the area once again on July 1 but is in the process of moving back above. The MACD and RSI have generated considerable bullish divergences, while the Stochastic oscillator has made a bullish cross.
The closest resistance levels are found at 112 and 128 satoshis (0.382-0.5 Fib retracement resistance levels).
For BeInCrypto’s latest bitcoin (BTC) analysis, click here.
