


The Ethereum price has broken down from a rising support line. After briefly validating this line as resistance, the price has resumed its downward momentum.
The ETH/BTC pair attempted a breakout above a crucial resistance area, but could not sustain the higher prices and has fallen back below this level.
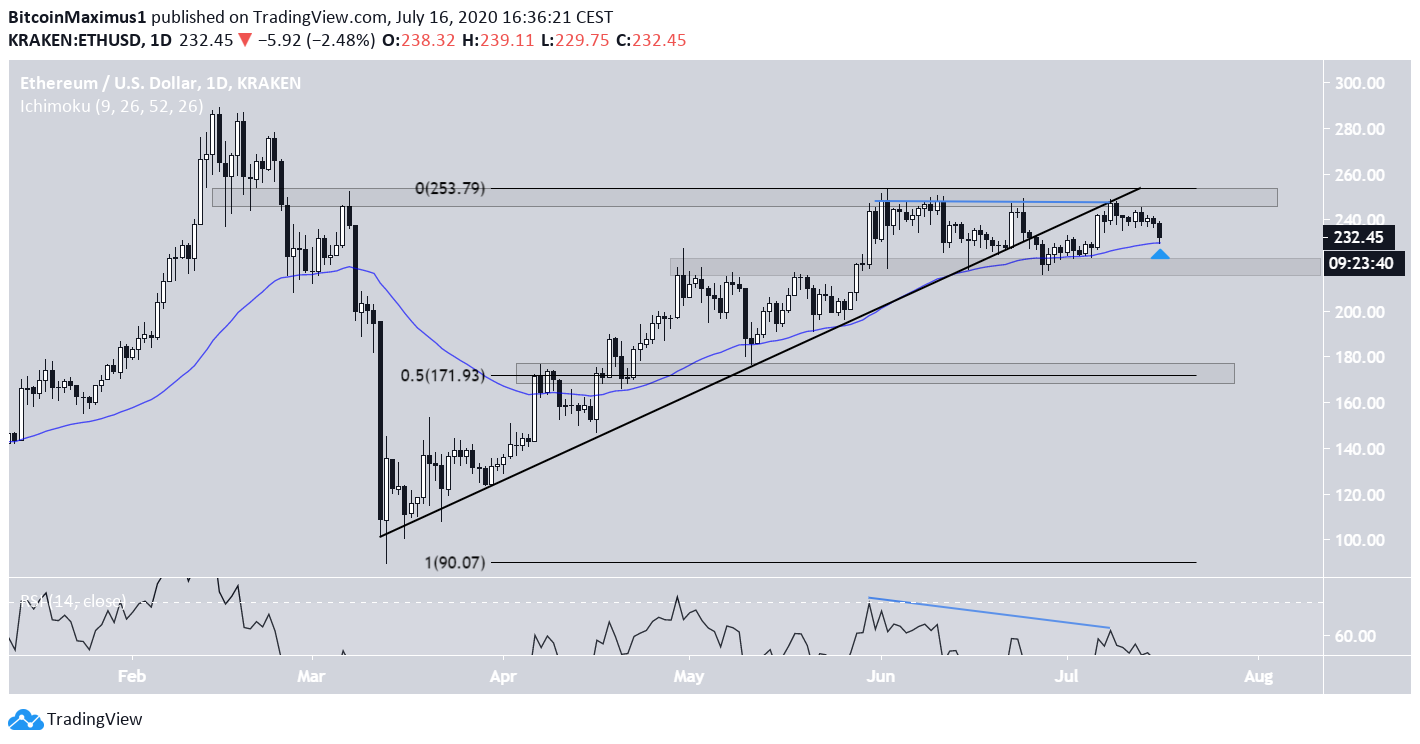
ETH/USD
The Ethereum price had been following an ascending support line since it reached a bottom on March 13. The price broke down from this line on June 25 and then proceeded to rally and validate it as resistance on July 8, before beginning the current slump.
The last touch of the line also coincided with the $245 resistance area. In addition, the RSI has formed considerable bearish divergence, a sign that the price is likely to begin a downward trend.
At the time of writing, ETH was holding on to the support of the 50-day moving average (MA), above which it has been trading throughout the entire upward move.
A loss of this MA would cause a fall to the minor $220 support area, and possibly the $172 area, which is the 0.5 Fib level of the entire upward move.
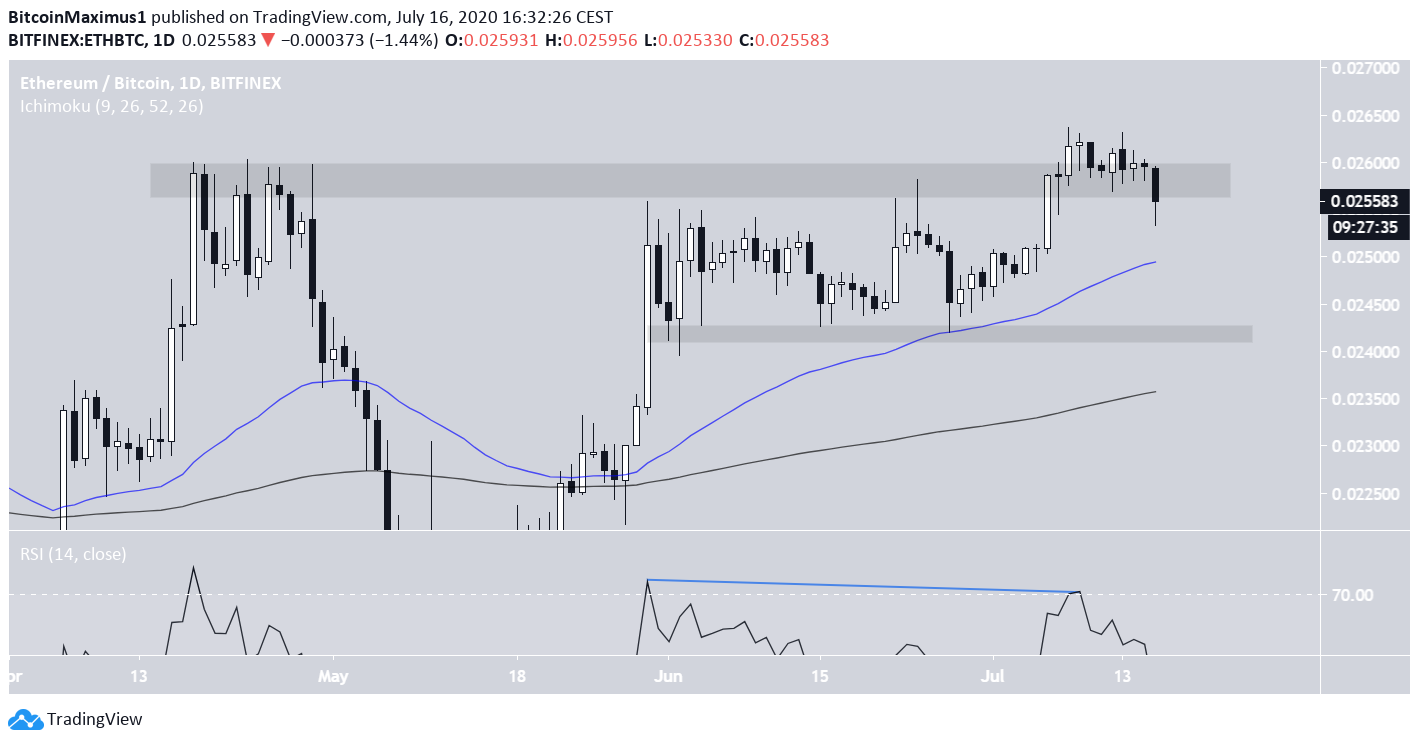
ETH/BTC
Cryptocurrency trader @Damskotrades stated that the Ethereum price has fallen below an important support level, and has outlined a continued decline that should take the price to ฿0.024.
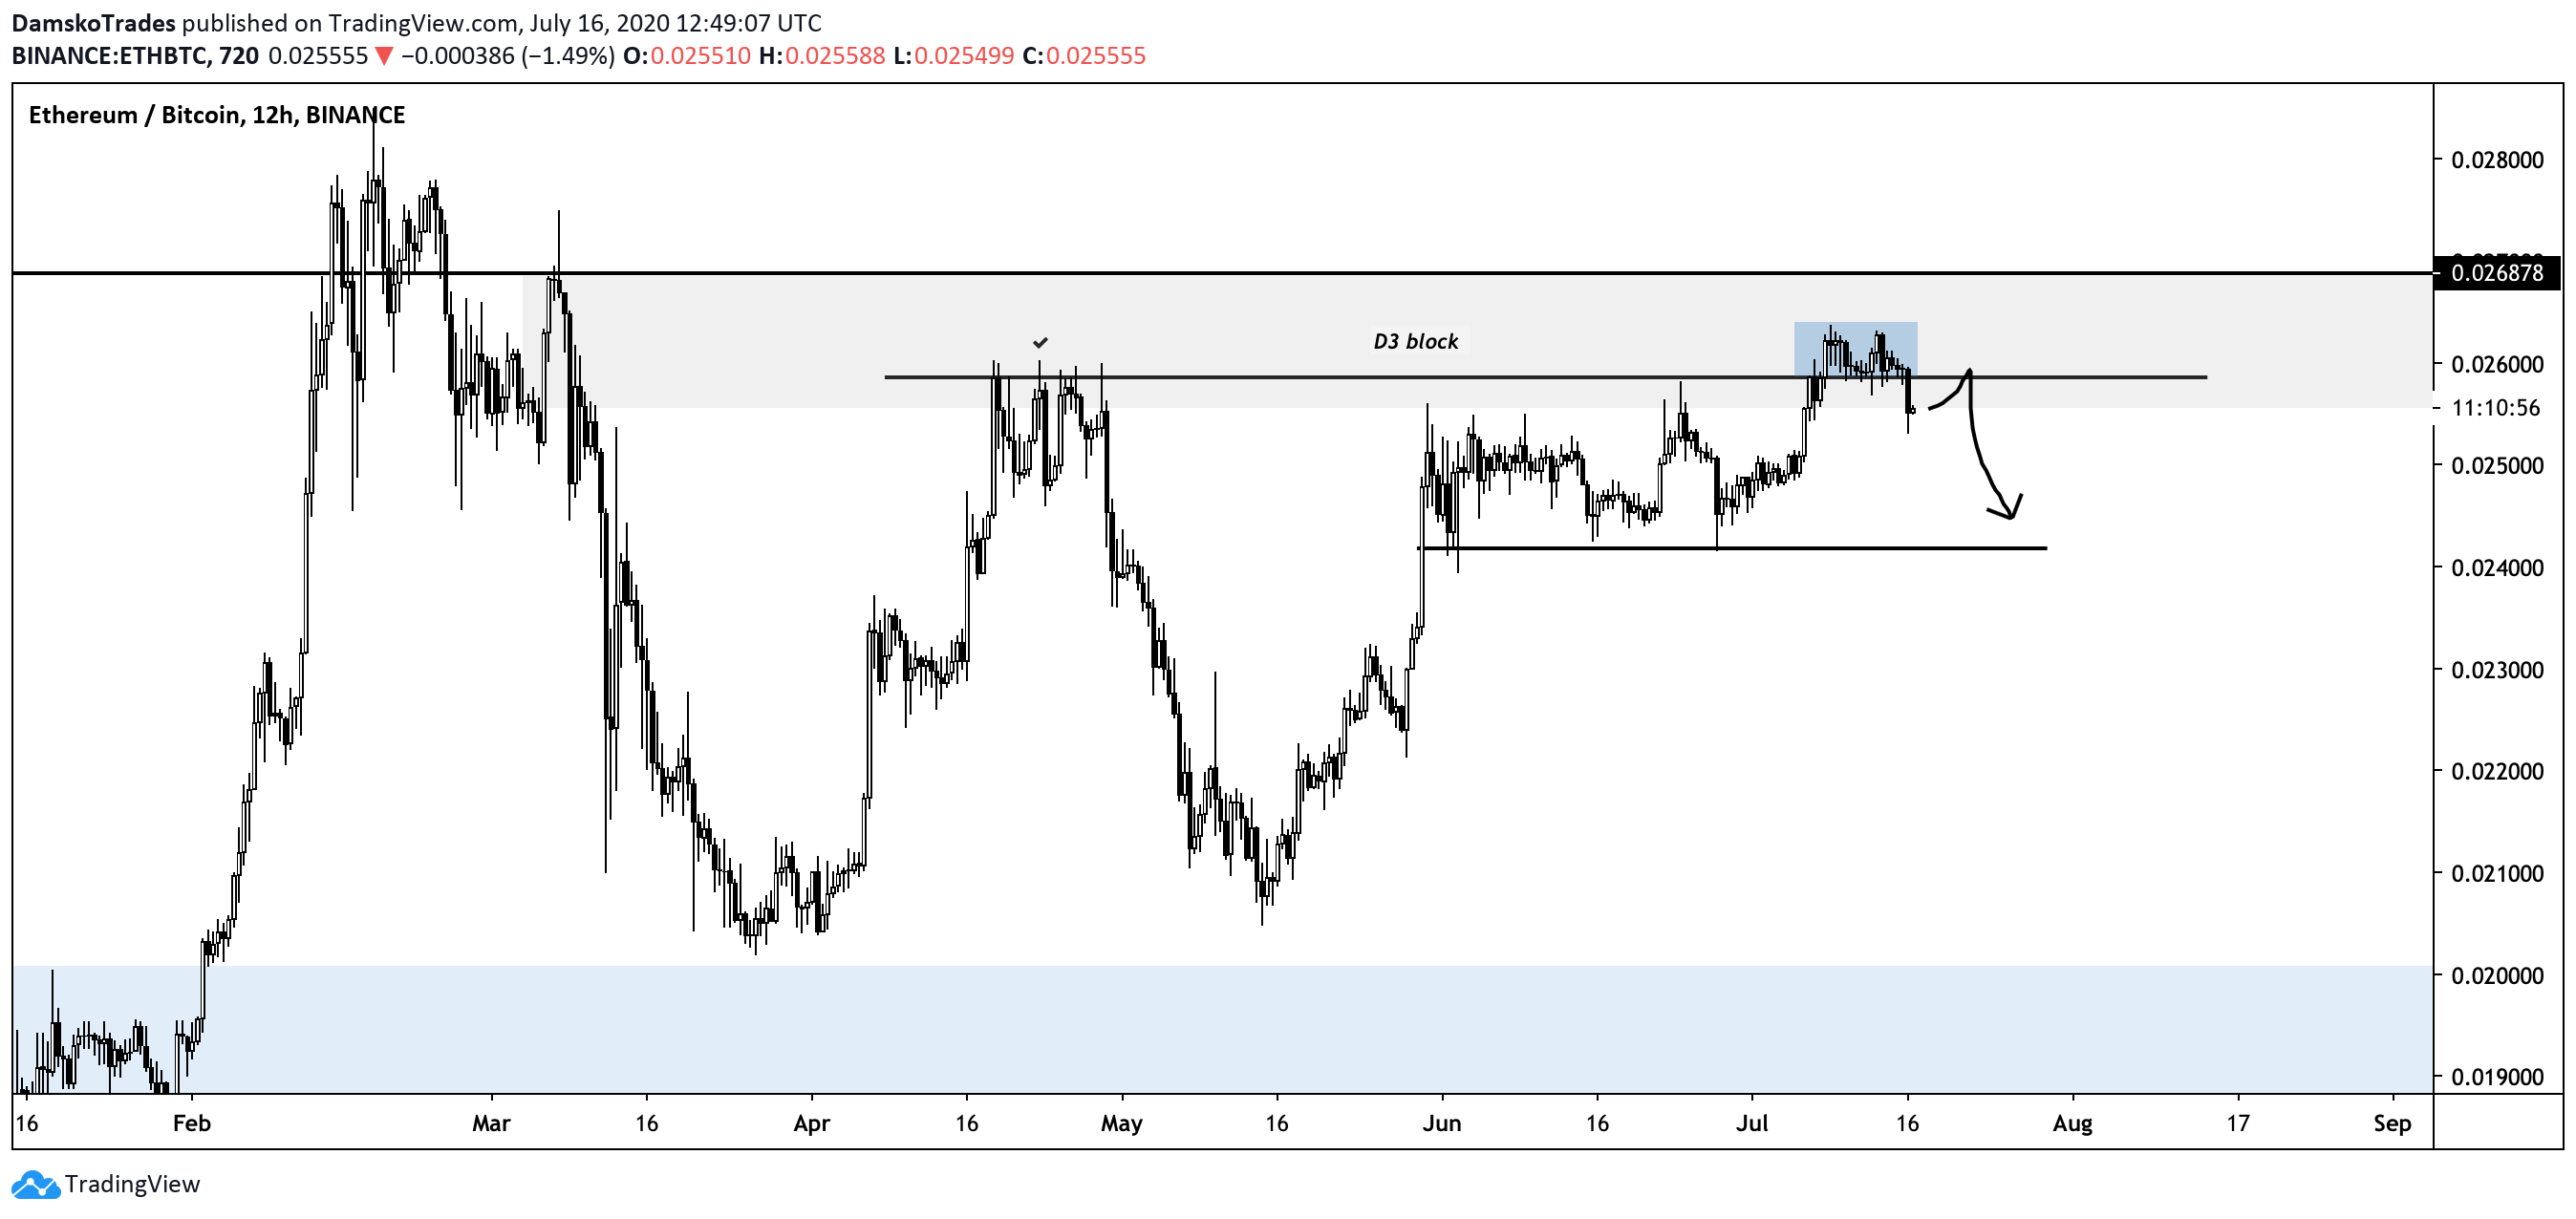
The previous support level is found at ฿0.0257. While the price rallied above here on July 7, it has since fallen below. This makes it likely that the previous rise was a failed breakout and the price will now resume its downward move.
Furthermore, this breakout was combined with significant bearish divergence on the RSI, a sign that the price will probably head south.
The first minor support level is likely to be provided by the 50-day MA at ฿0.025, but the more important support level is found at ฿0.0242, which is also strengthened by the presence of the 200-day MA.
To conclude, both the ETH/USD and ETH/BTC pairs have broken down from important support levels, and are primed for a continued decline towards the support areas outlined above.


