
The Bitcoin price might have broken out above a long-term resistance line, initiating a new bullish trend. The price movement for the next 2-3 days will be crucial in determining if the breakout is legitimate.
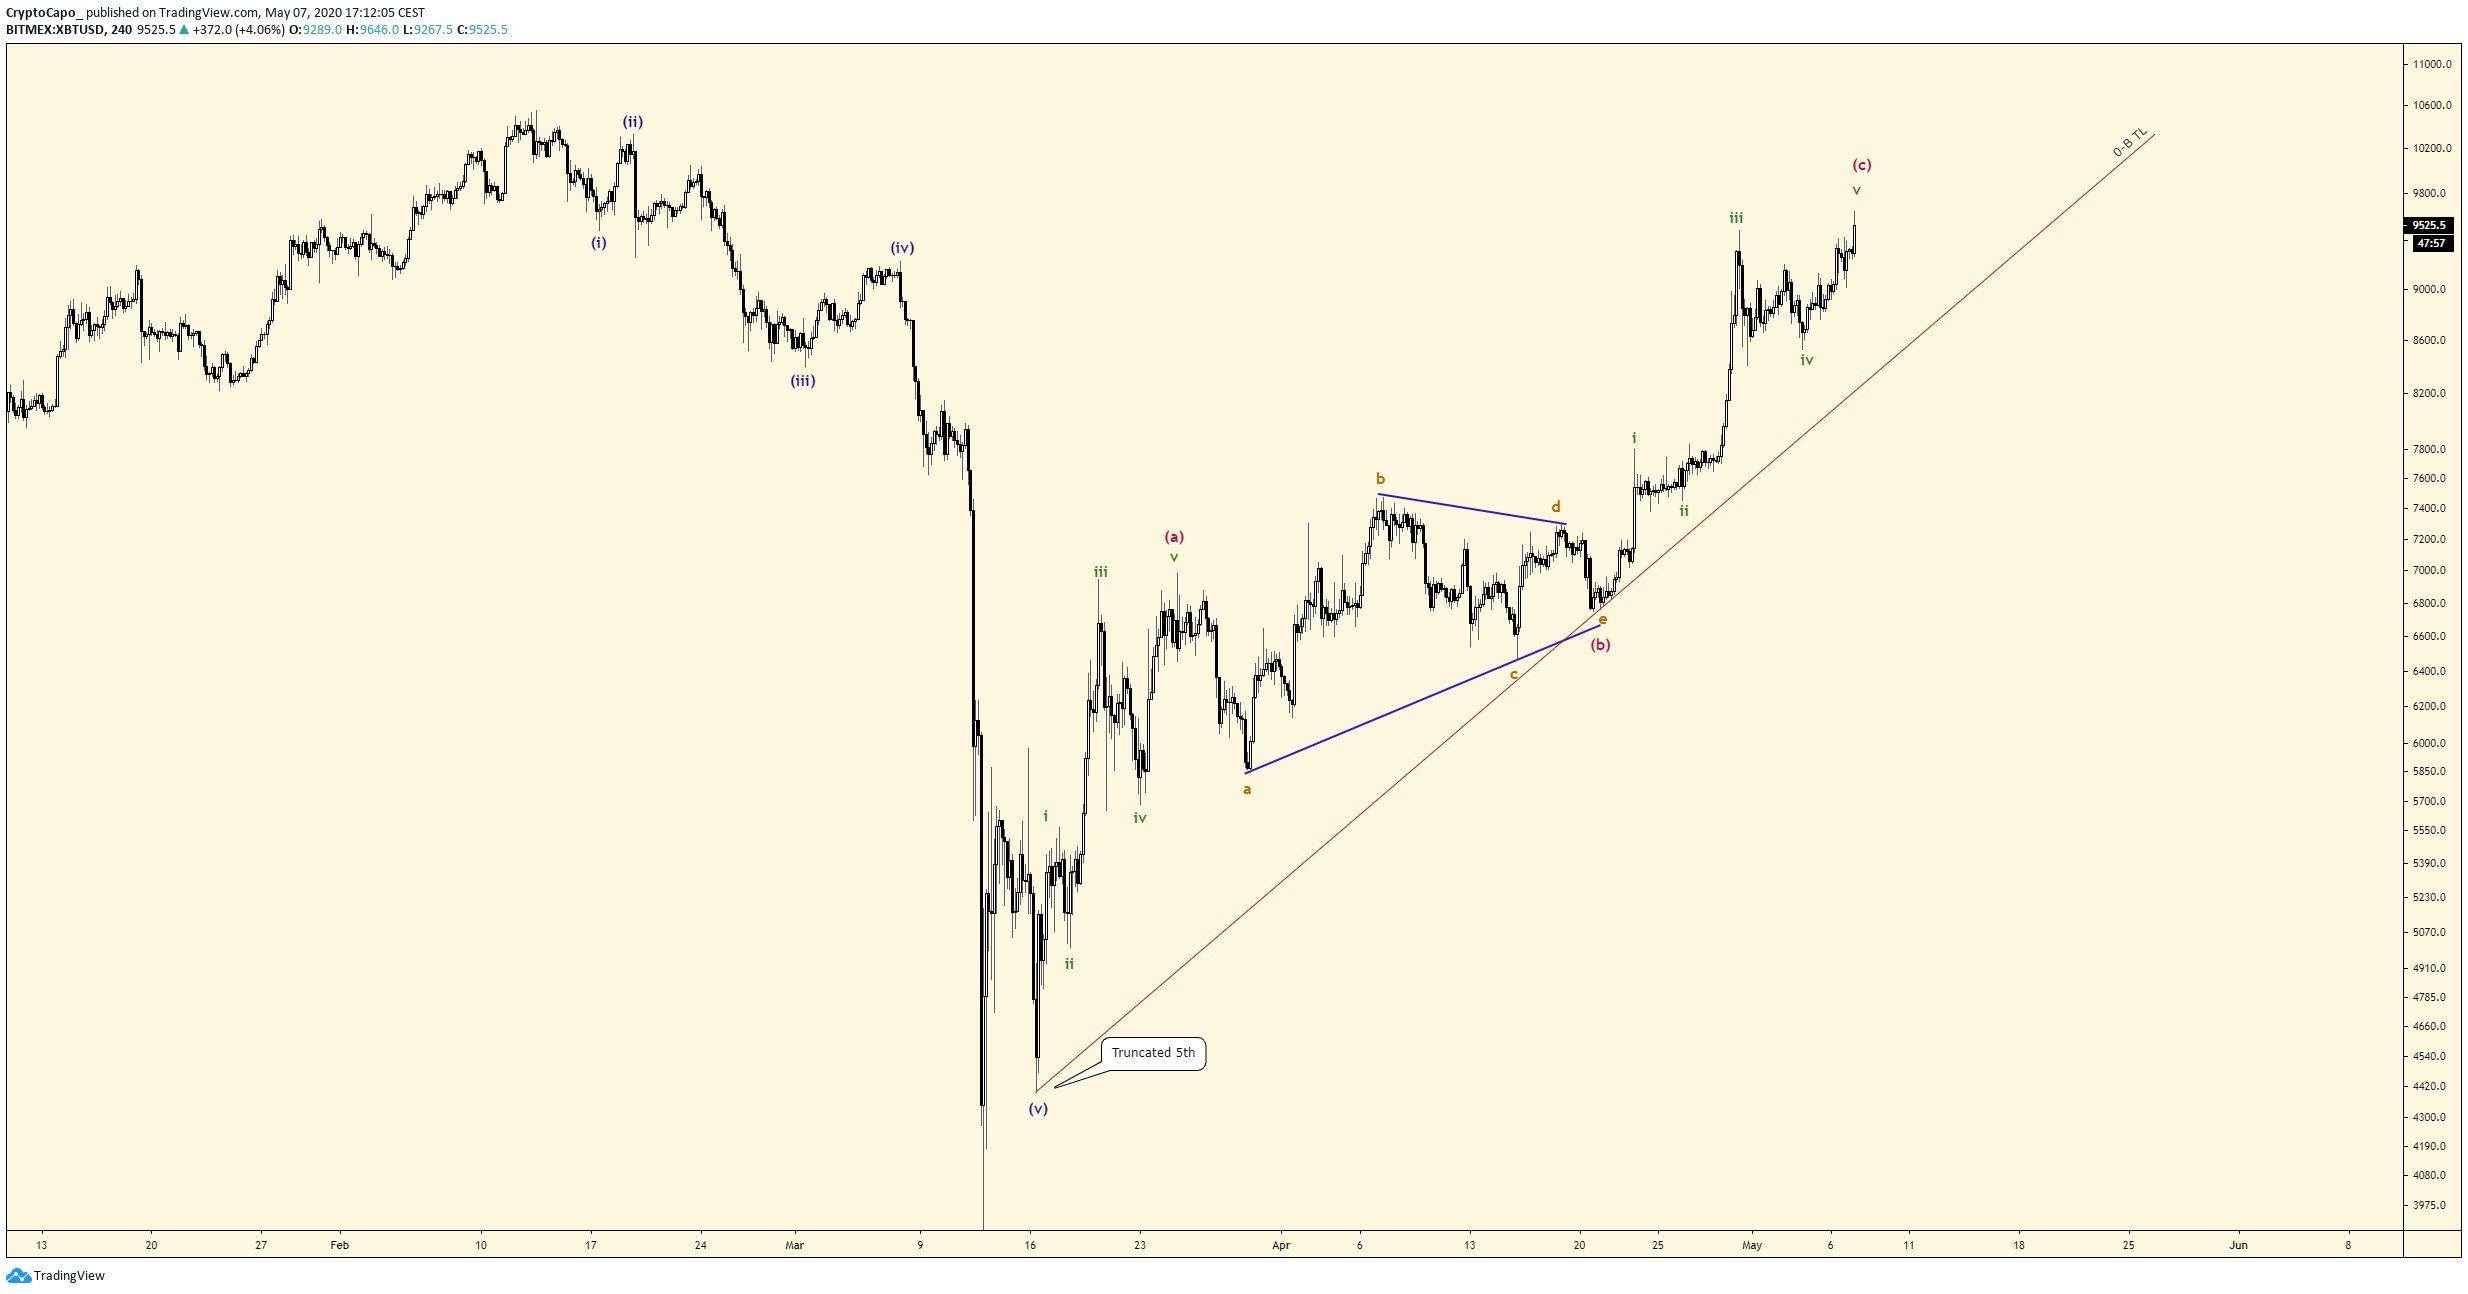
Well-known crypto trader @CryptoCapo_ tweeted a Bitcoin price chart with an Elliott wave count outlined since the March 13 crash.
In this article, we will attempt to draw the correct Elliott wave count for BTC since the March 13 crash.
Wave Count
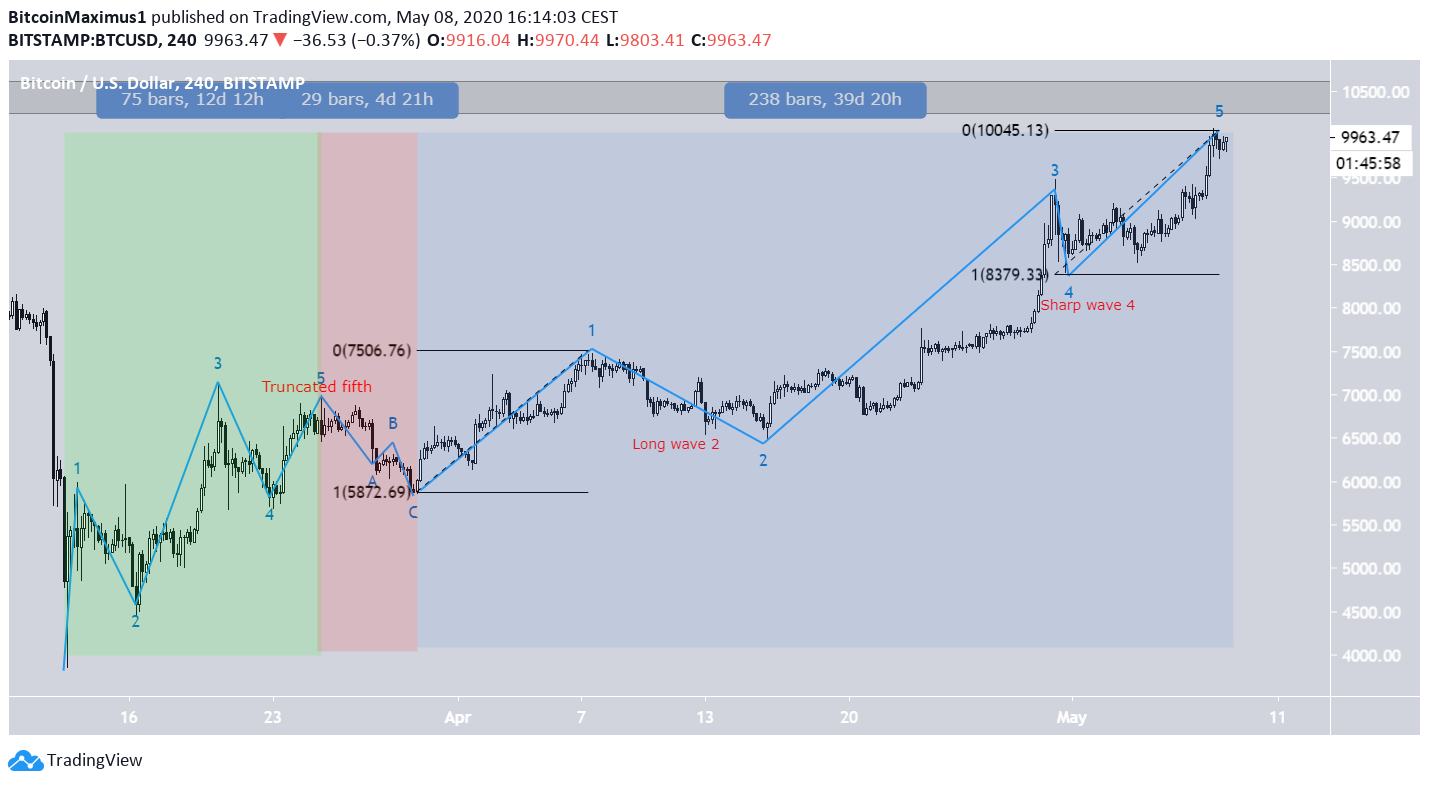
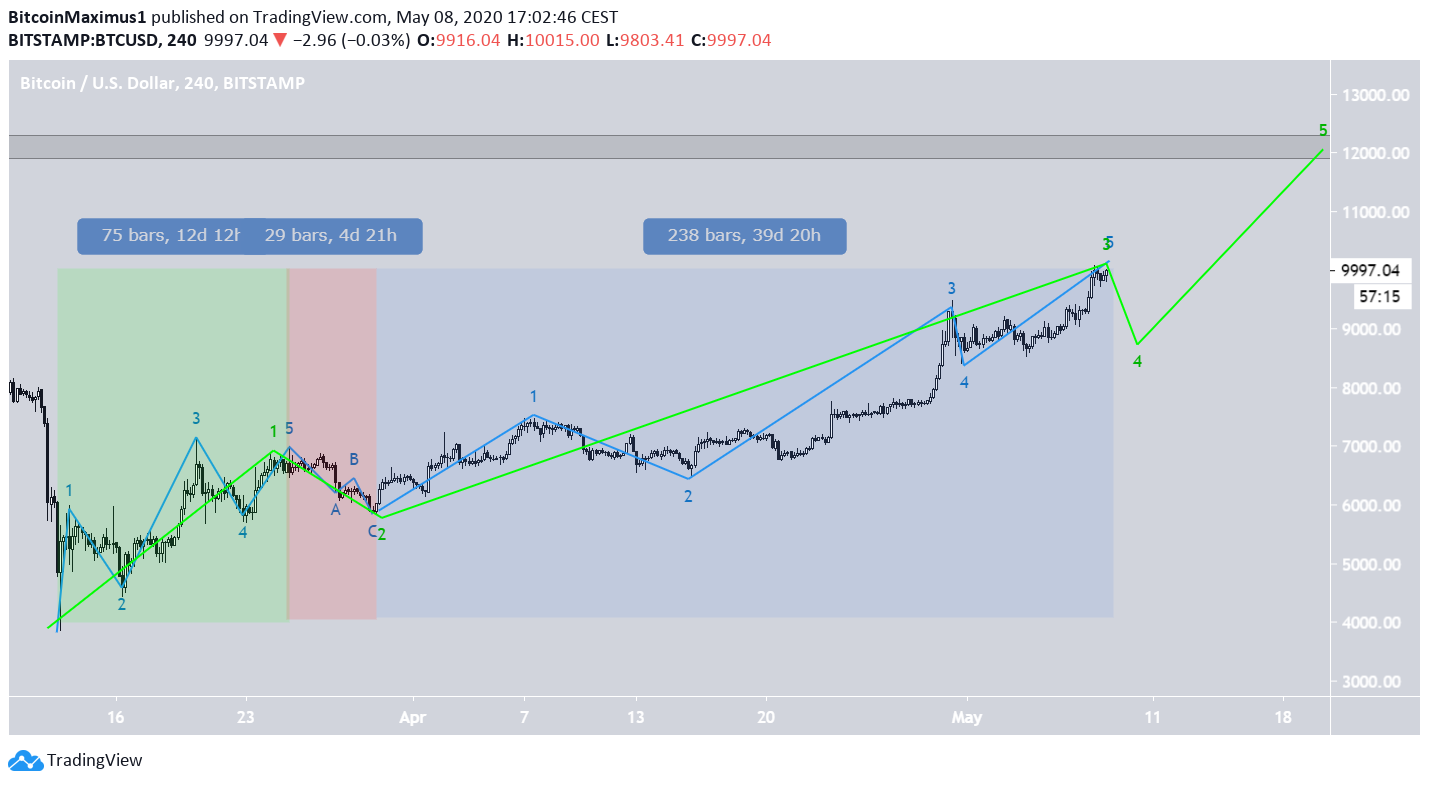
The first five wave Elliott formation is outlined with the green background and has a truncated fifth wave. Afterwards, the price seemingly completed an A-B-C correction (red), ending on March 30.
Since that bottom, where we have outlined the beginning of the final five wave formation (blue), the length of the waves along with the rate of decrease differ significantly from the period preceding it, making it likely that this is a new wave in higher time-frames. This is an almost textbook formation, in which one correction is gradual (wave 2) and the other is sharp (wave 4). In addition, the third wave is extended and waves 1 and 3 have identical lengths, if the fifth wave were at the current level.
So, it seems the current rally is very close to reaching a top. However, what is interesting is the position of this formation in the larger scheme of the movement. Is this an A-B-C upward correction, as outlined in the tweet, or is it the beginning of a new bullish formation?
We outlined the beginning of a new bullish wave here, while previously we have outlined an A-B-C correction.
A-B-C Correction
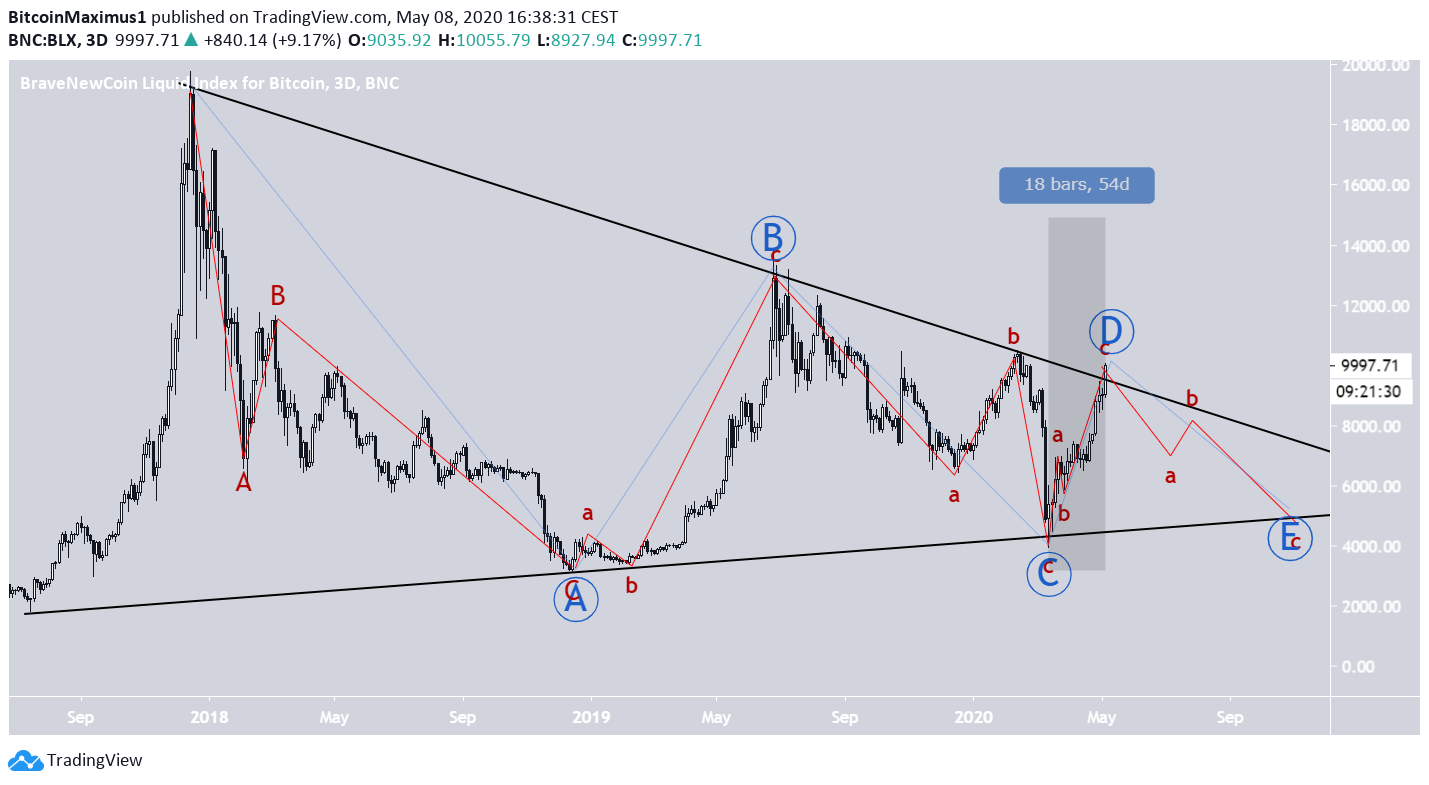
The first possibility is that since the December 2017 high, the price has been trading inside a symmetrical triangle, completing an A-B-C-D-E formation. In these corrections, each wave is divided into three sub-waves, labelled A-B-C.
Therefore, the current movement, which is highlighted in the chart below, is just an A-B-C upward move, which will be followed by the final A-B-C downward correction.
While the price has already broken out above the long-term descending resistance line, if it were to decrease before the weekly close, it would leave a long upper wick in its wake and fall back below the line. In addition, if we use wicks instead of closing prices, the price has yet to break out from this line, even though that gives us one less touch of the resistance line.
However, if this formation were to be correct, the short-term wave count outlined in the previous section has to be the top, which is followed by a price decrease very soon. On the other hand, a price increase above $10,500, the high of the preceding B wave, would invalidate this formation.
New Formation
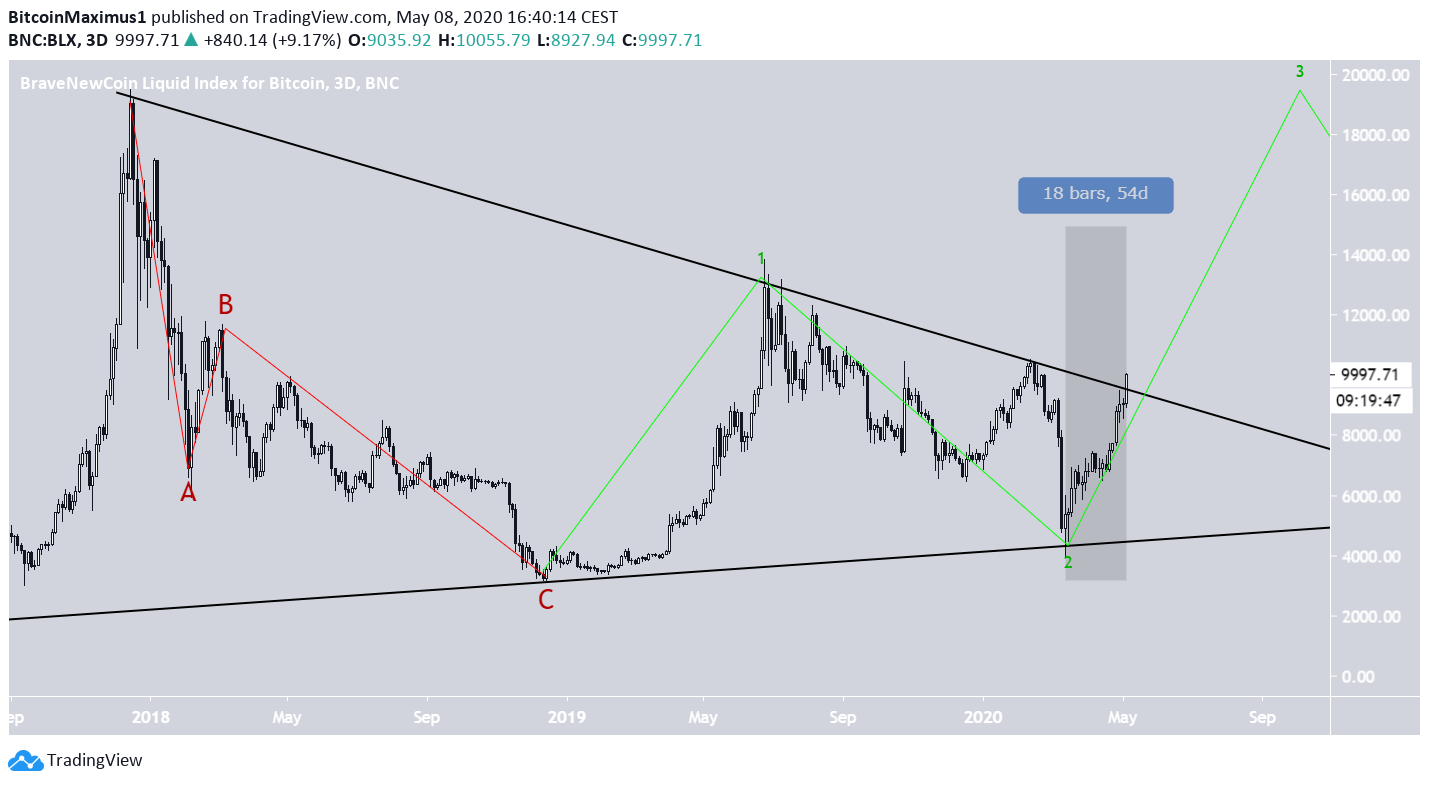
The more bullish possibility suggests that the A-B-C correction was completed in December 2018, with the $3,300 low. Since then, the price has begun a new five-wave Elliott formation, in which Wave 2 ended with the March 13, 2020 lows. Therefore, the current movement is part of the larger third wave, which when judging by the length of the first one is likely to continue for quite some time.
Even if this long-term formation is correct, the short-term wave count outlined in the first section is still valid. However, the future movement differs.
Since the second wave (green) was gradual, the fourth one would be expected to be sharp. Afterwards, the price would initiate another upward move towards $12,000.
So, while a price decrease is expected in both wave counts, the movement afterward, more specifically whether the price bounces at $9,000 or falls down, will be crucial in determining if the current upward move will continue.
