


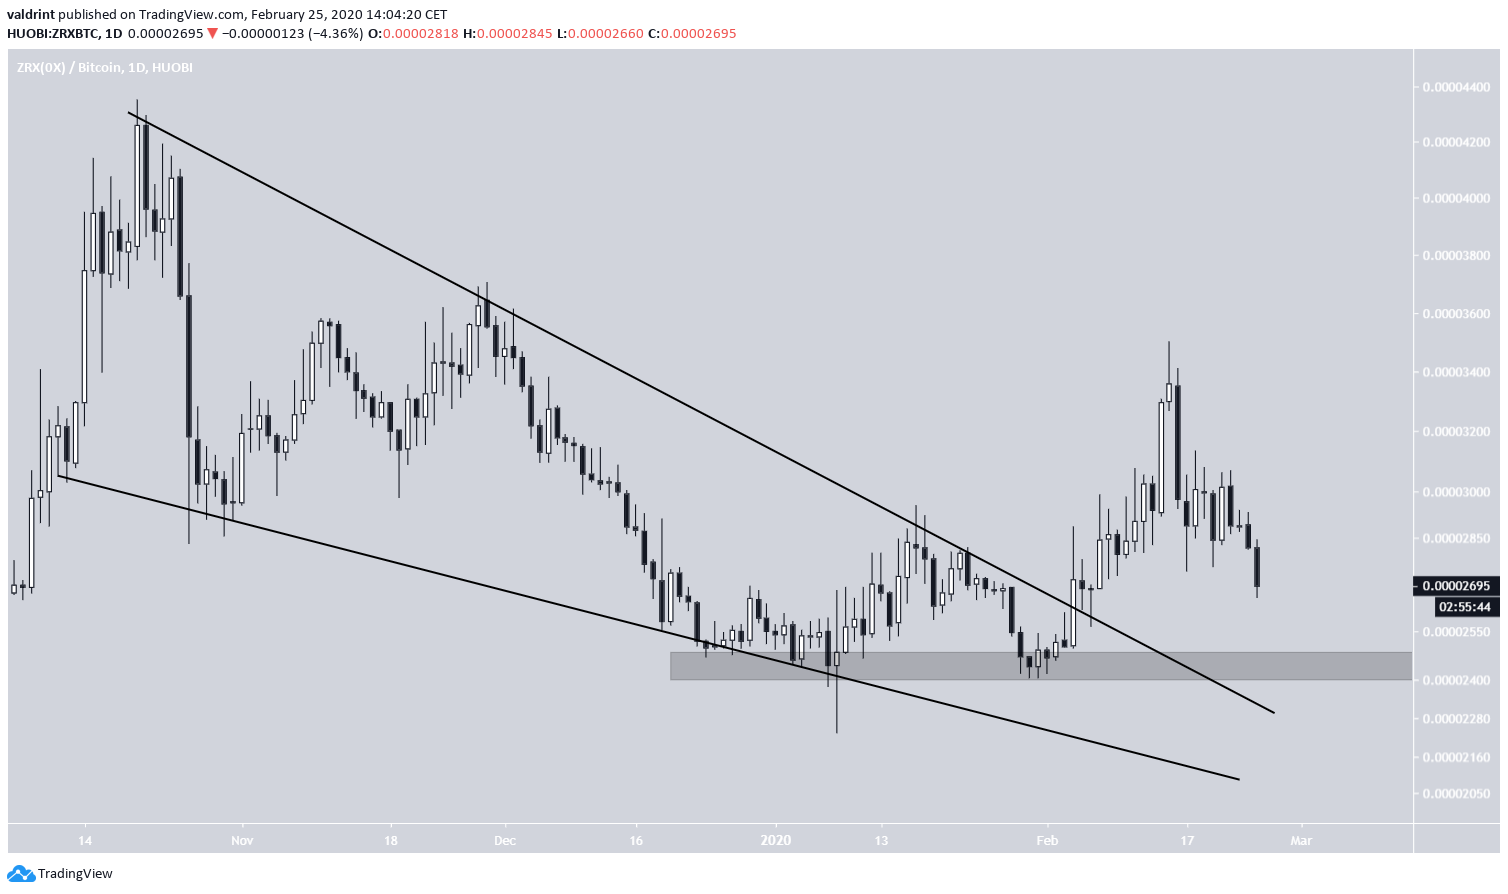
On February 4, the ZRX price broke out from a descending wedge. The rally ended at 3500 satoshis and the 0x price has been decreasing since.
0x (ZRX) Price Highlights
- ZRX broke out from a descending wedge.
- There is support at 2450 satoshis.
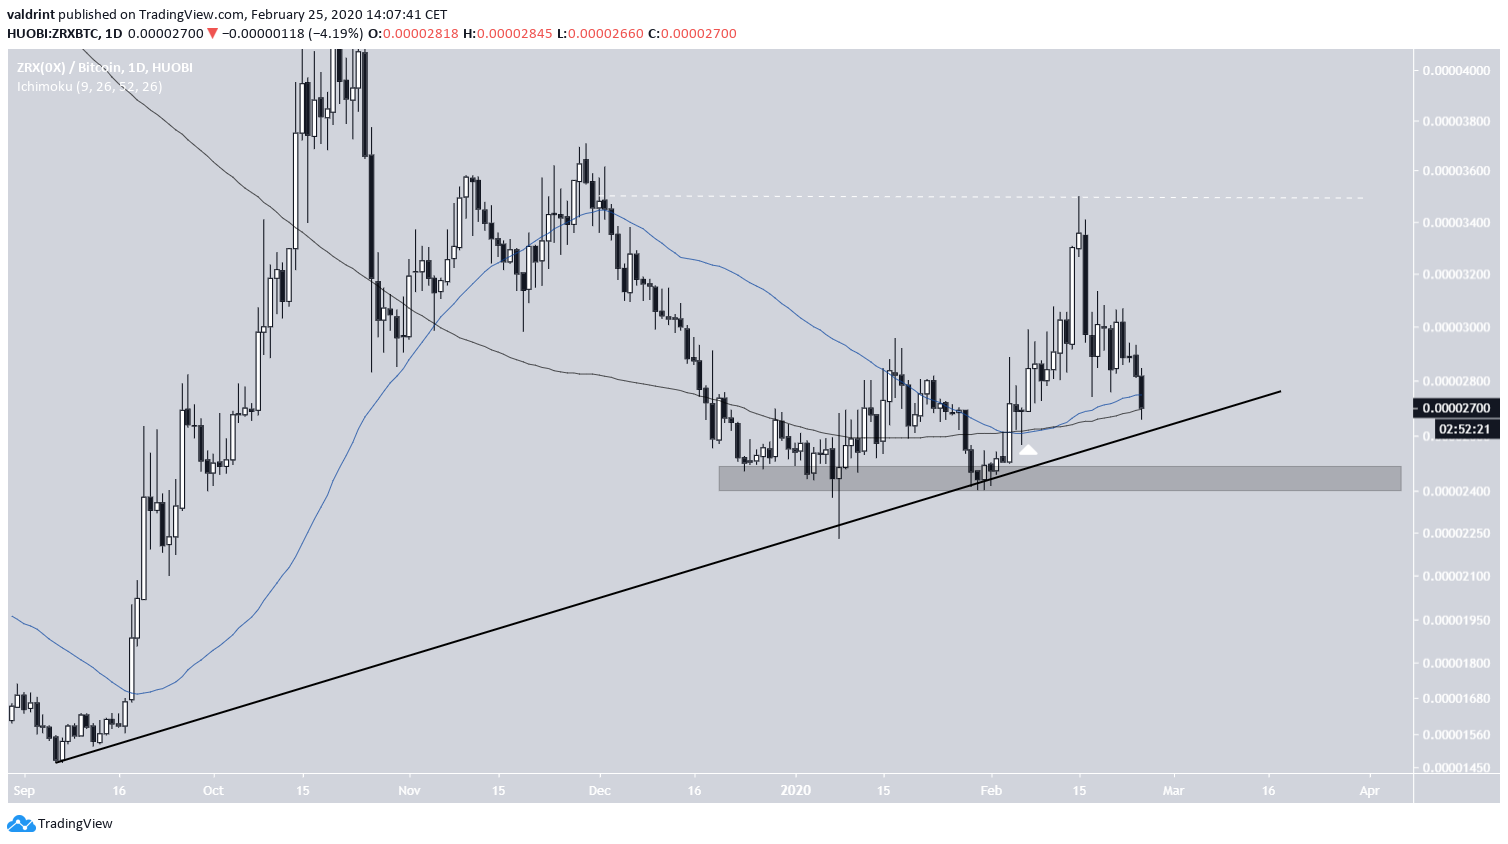
- A golden cross has transpired.
- ZRX is following an ascending support line.
- There is strong resistance at 4300 and 8000 satoshis.
Cryptocurrency trader @PostyXBT outlined a ZRX chart that shows that the price is approaching an important diagonal support area. However, he expresses skepticism about its future potential for growth.
Well the market conditions didn't favour this trade as well as many others right now.
Expecting price to test the diagonal support.
I have no real interested in trading alts right now. pic.twitter.com/wTSr2CFkeA
— Posty (@PostyXBT) February 25, 2020
Let’s take a closer look at the ZRX price and determine where it is heading to next.
Descending Wedge
On February 4, the ZRX price broke out from a descending wedge. The rally continued until the price reached a high of 2500 satoshis on February 15. It has been decreasing since.
The main support area is found at 2500 satoshis, the level which initiated the breakout from the wedge.
The diagonal support outlined in the tweet is an ascending support line traced from the lows of September 2019. The 0x price is currently very close to validating it for the fourth time.
On February 12, there was a rejection of a bearish cross between the 50- and 200-day moving average (MA). The price is currently using the latter as support. This is a bullish sign, that makes it possible that the price will not fall to the support area at all.
The most probable resistance area is found at 3500 satoshis, right where the rally ended.
Trading Range
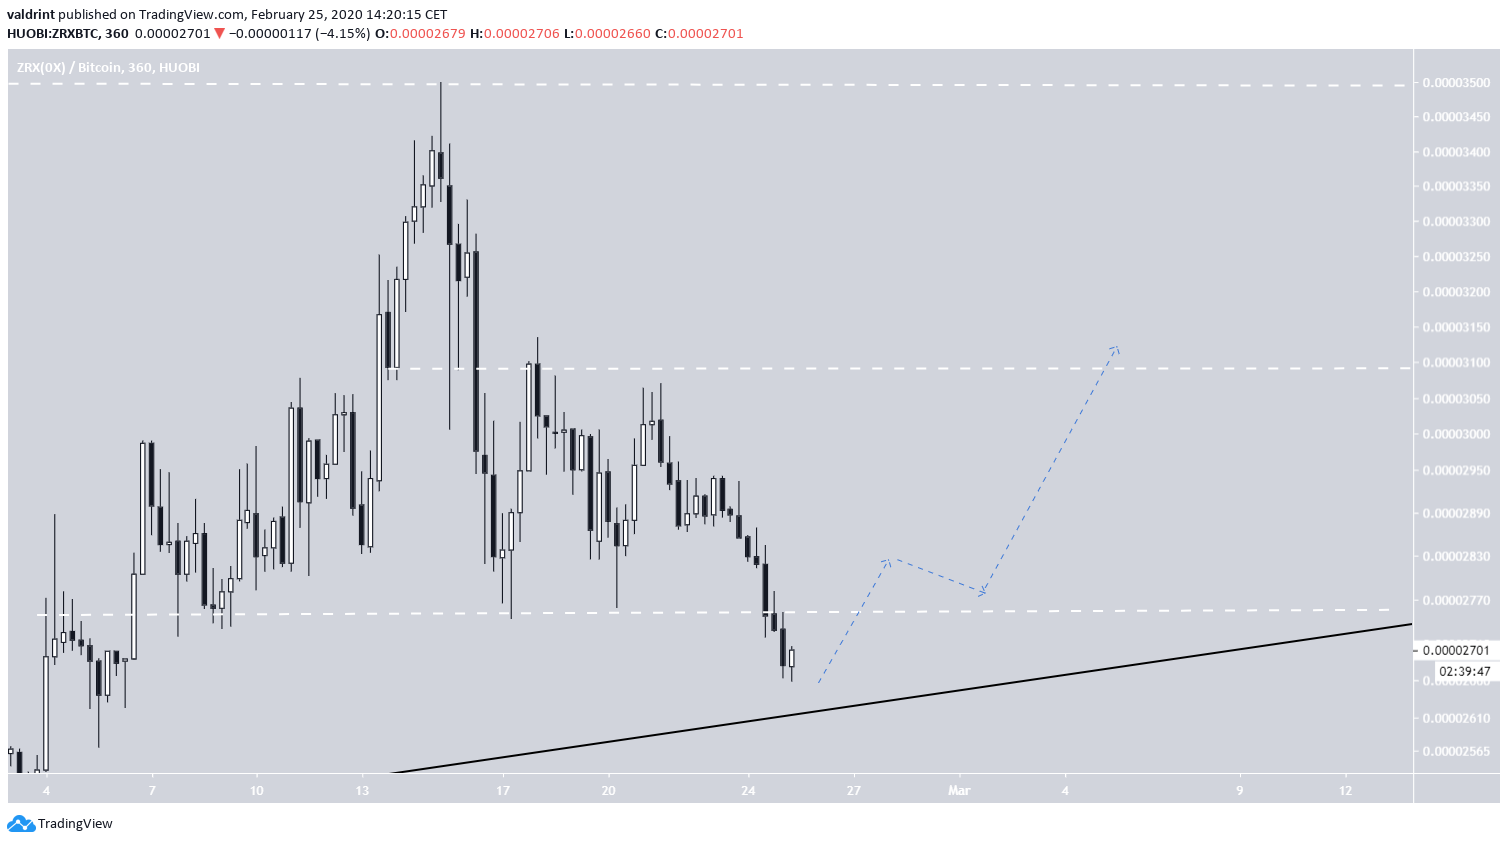
We can outline a trading range for the ZRX price movement since February 4, with support at 2750 satoshis. While the price has broken down below it, the breakout has been weak. Due to the proximity to the ascending support line, a reclaim is expected, followed by a continuation of the upward move.
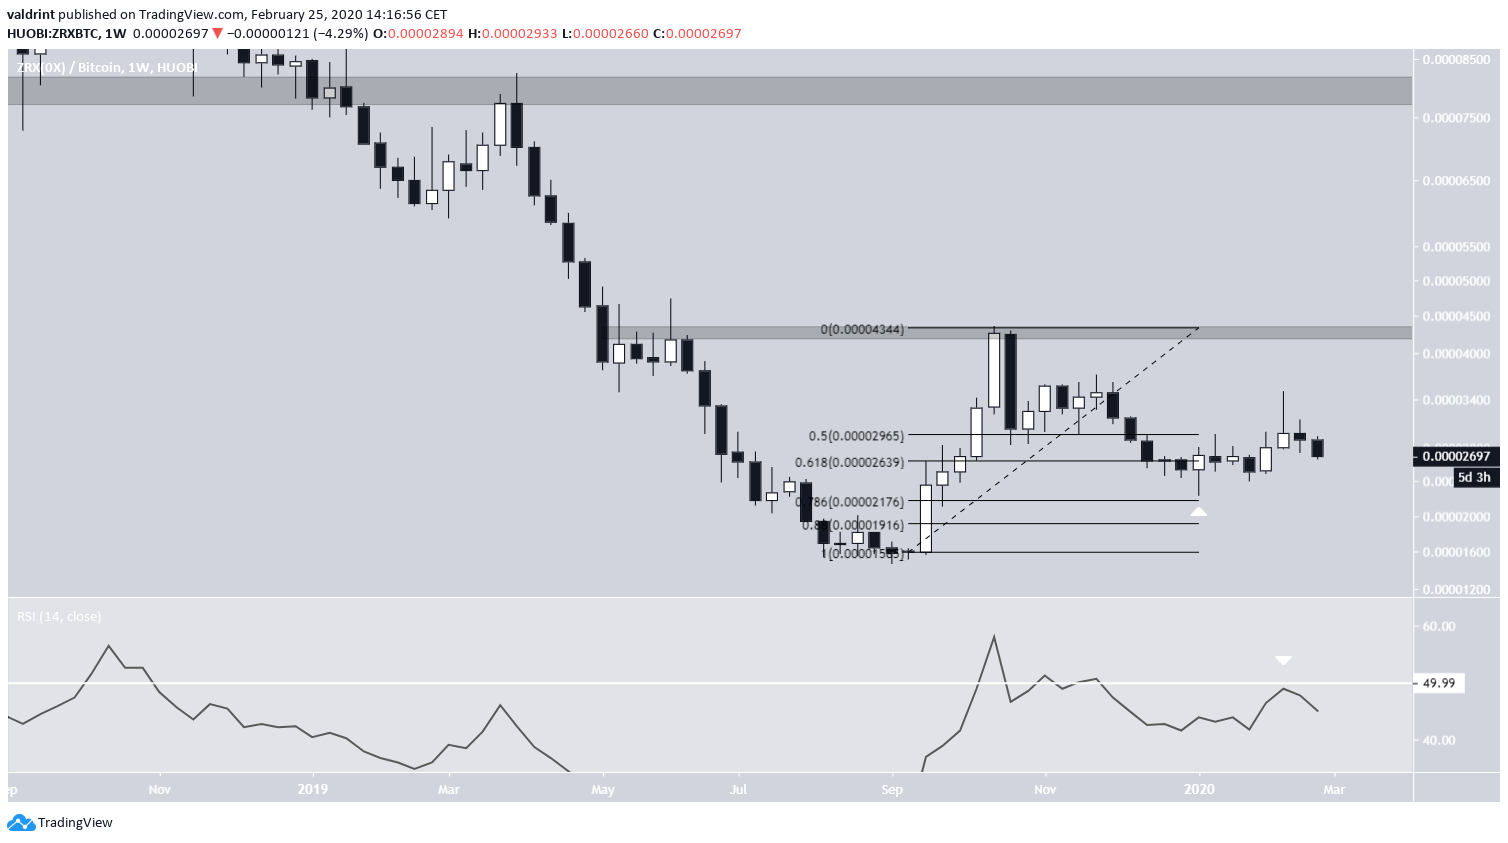
Long-Term 0x Movement
In the long-term, we can see that the ZRX price began an upward move in September 2019, culminating with a high of 4350 satoshis in October.
The ensuing decrease ended at the 0.786 Fib level, a likely spot for a reversal.
However, we cannot yet confirm that the 0x price has begun a bullish trend since the weekly RSI was rejected by the 50-line and is currently below it. A possible upward move towards the 4350 satoshi resistance area would definitely cause the RSI to go above 50, confirming the upward trend.
The next resistance area is found at 8000 satoshis.
To conclude, the ZRX price has broken out from a descending wedge, possibly indicating that it has begun a bullish trend. As long as the price is trading above the current ascending support line and 2500 satoshi area, we believe it will head toward the first resistance area at 3500 satoshis. The long-term resistance area is found at 4300 satoshis.


