Harmony (ONE) has bounced at a horizontal and diagonal support area. However, the direction of the trend remains undetermined.
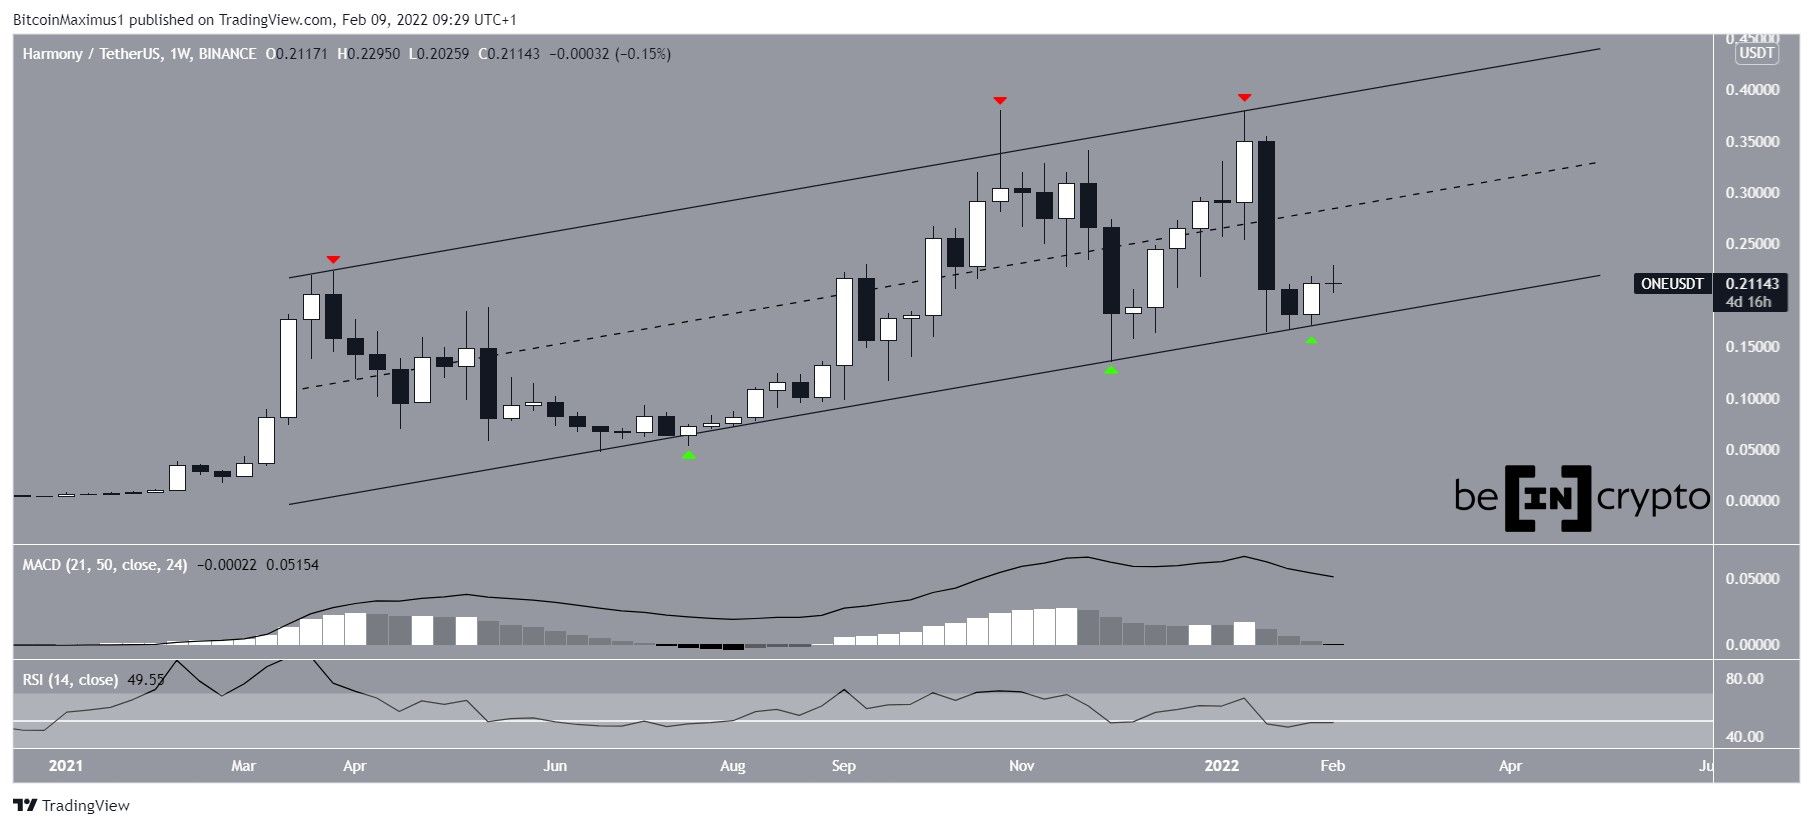
The weekly chart shows that ONE has been falling since Jan 14, after creating a double top pattern relative to the Oct 26 all-time high price. The double top is normally considered a bearish pattern and often leads to bearish trend reversals.
The next week, ONE created a large bearish candlestick and fell to a local low of $0.164. This caused it to validate the support line of a long-term ascending parallel channel.
Both the support (green icons) and resistance (red icons) lines have been validated sufficient times.
Technical indicators are mixed since both the RSI and MACD are falling. The former is at 50 and the latter is at 0. These readings are considered neutral, but the fact that they are falling is bearish.
Therefore, the outlook from the weekly time frame does not provide a clear direction for the overall trend.
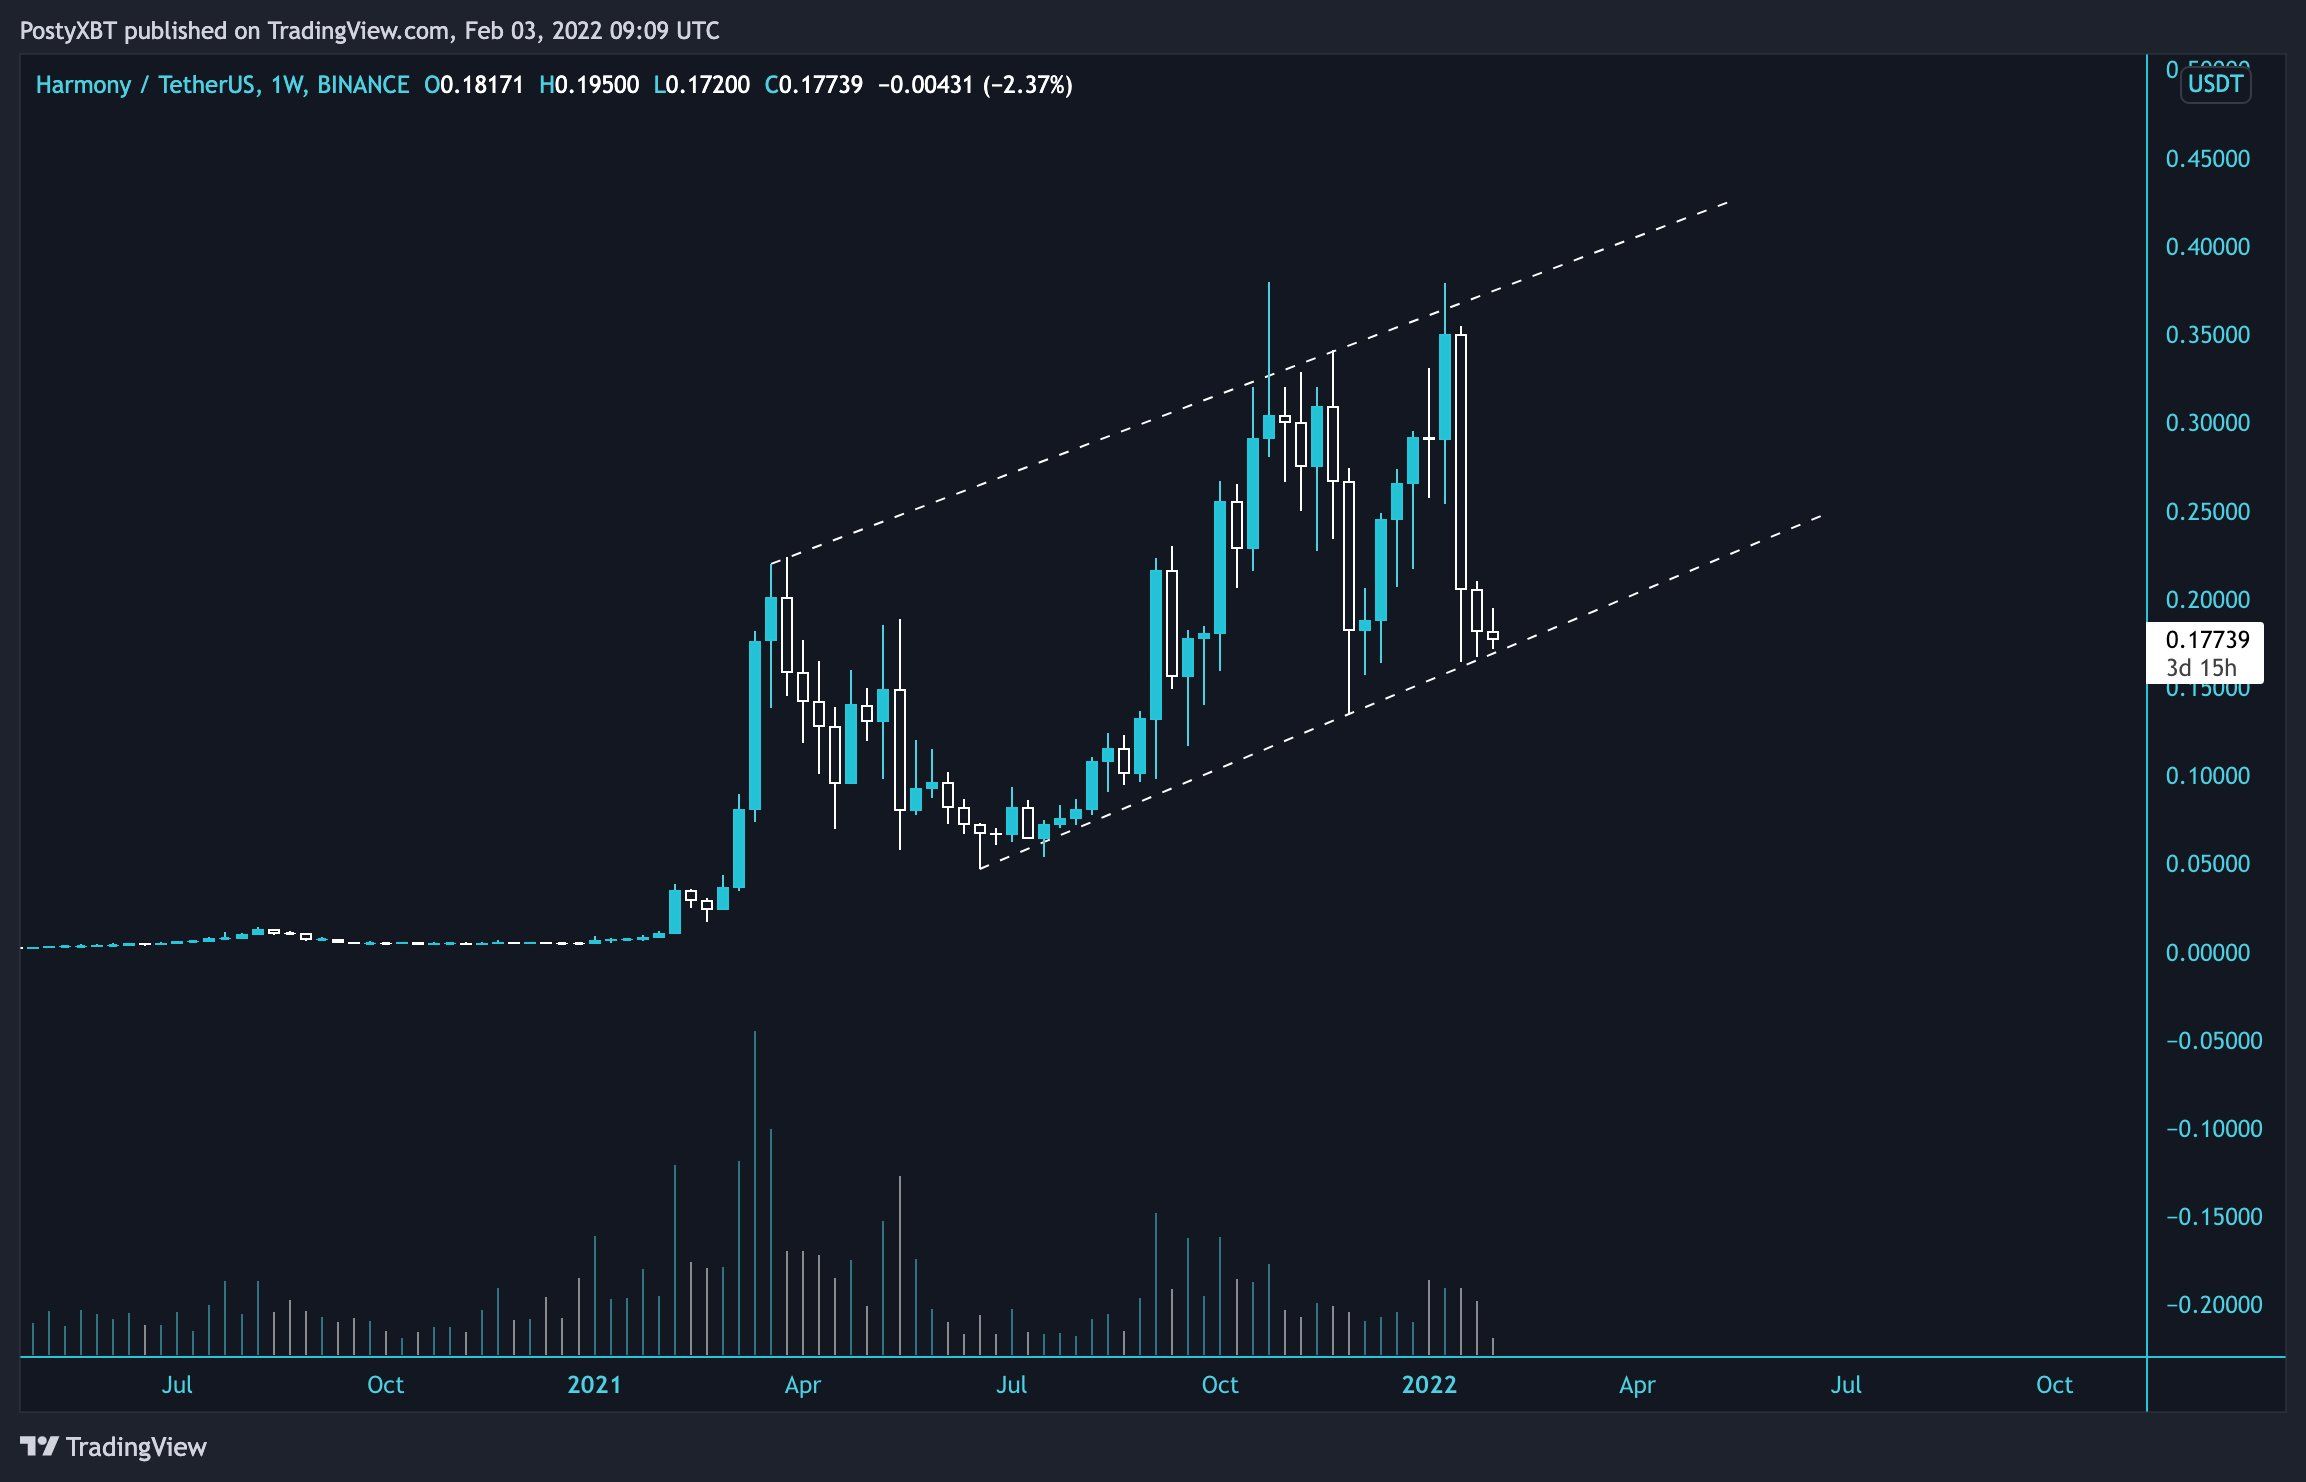
Cryptocurrency trader @PostyXBT tweeted a weekly chart that shows that Harmony is trading inside a long-term ascending parallel channel and has validated its support line
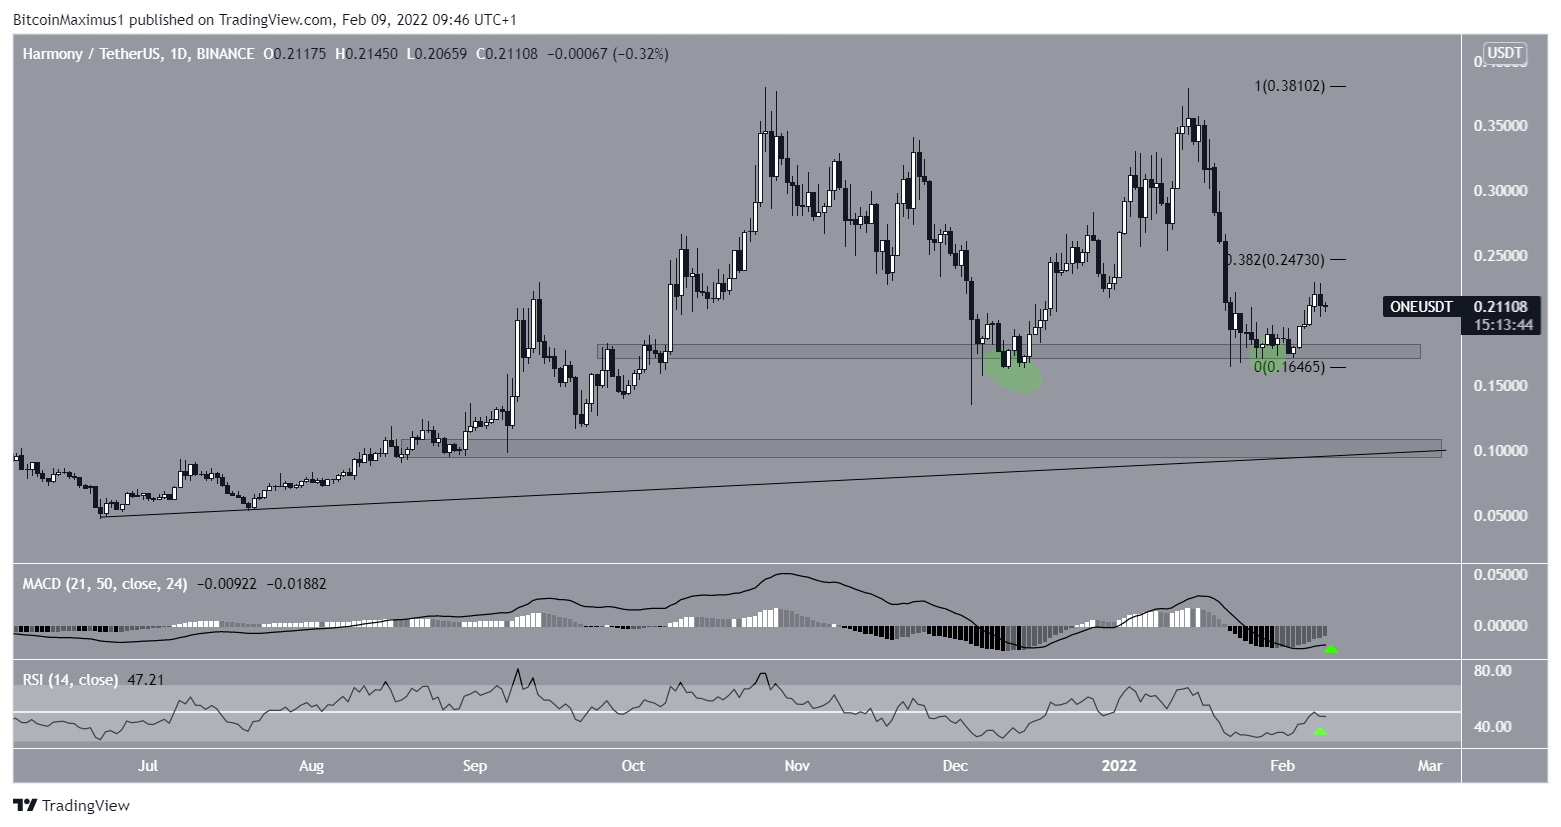
ONE bounces at support
The daily chart shows that ONE has bounced at the $0.175 support area twice (green circles), most recently at the beginning of February.
Similar to the weekly time frame, technical indicators are somewhat neutral. The RSI and MACD are both increasing, but the former is still below 50 while the latter is still negative. Both have to pass these thresholds in order for the trend to be confirmed as bullish.
The closest resistance area is found at $0.247. This target is the 0.382 Fib retracement resistance level.
Conversely, the closest support is at $0.10. This is a horizontal support area and also coincides with a long-term ascending support line.
Therefore, due to the mixed price action and technical indicator readings, the direction of the trend remains undetermined.