


On Jun 1, 2019, the Harmony price (ONE) made a low of $0.012. A rapid upward move ensued. The price reached a high of $0.028 the same day.
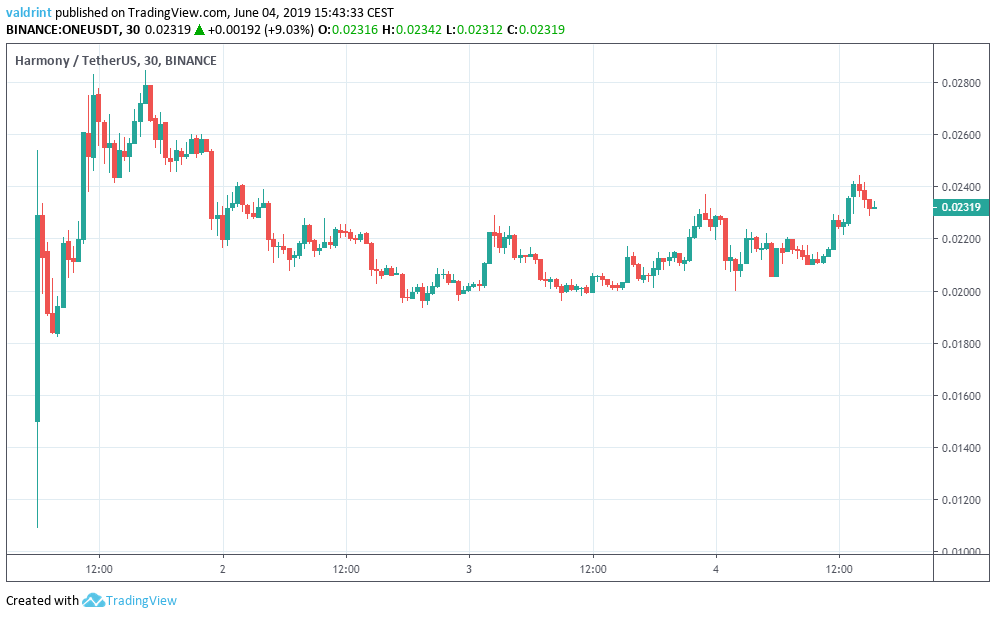
Since then, it has been gradually decreasing.
The ONE/USD pair is not available. Therefore, we will use the ONE/USDT pair instead.
Harmony Price (ONE): Trends and Highlights for June 4
- The price reached a high of $0.028 on June 1.
- It is trading inside an ascending channel.
- A bearish divergence is developing in the RSI.
- There is resistance near $0.026.
- There is support near $0.018.
Harmony (ONE) in an Ascending Channel
On Jun 2, the price made a low of $0.019. A gradual increase ensued and the price made a high of $0.022 the next day.
The Harmony price (ONE) has been gradually increasing since, trading inside the ascending channel outlined below:
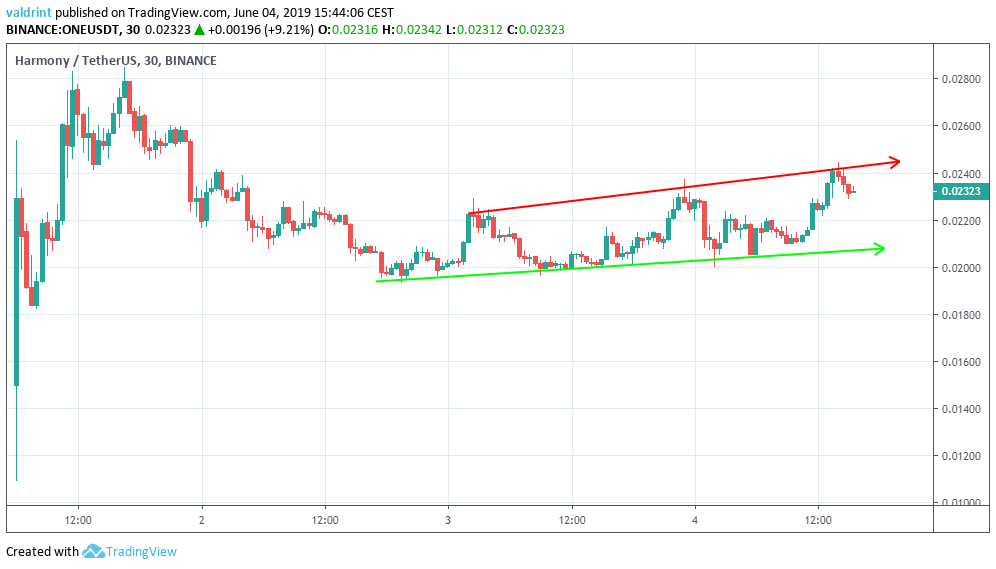
At the time of writing, the Harmony price (ONE) is trading very close to the resistance line of the channel.
Will it break out or are more decreases in store? Let’s take a look at technical indicators in order to answer that.
Bearish Divergence
The price is analyzed alongside the RSI below:
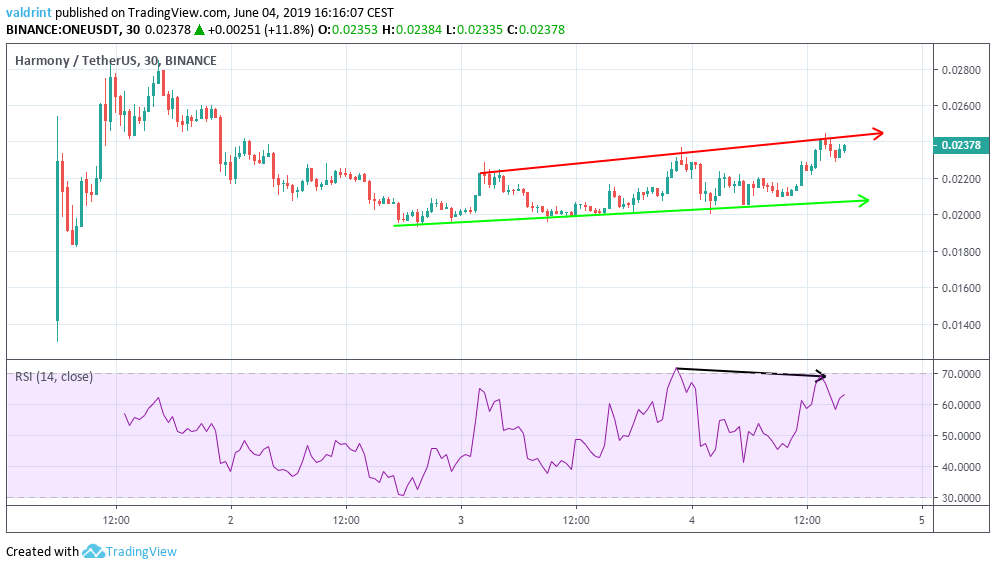
On Jun 3, the Harmony price (ONE) reached a high of $0.23. It reached a higher high of $0.024 the next day.
During this period, the RSI reached lower highs. This is known as bearish divergence and often precedes price decreases. It supports a decrease towards the support line of the channel.
However, this divergence is only present in short-term time-frames. This is because the only available data for the coin starts on Jun 1.
Reversal Areas
In case a decisive move occurs, one resistance and support area is outlined below. They can provide reversal in case the Harmony price (ONE) breaks out/down from the channel.
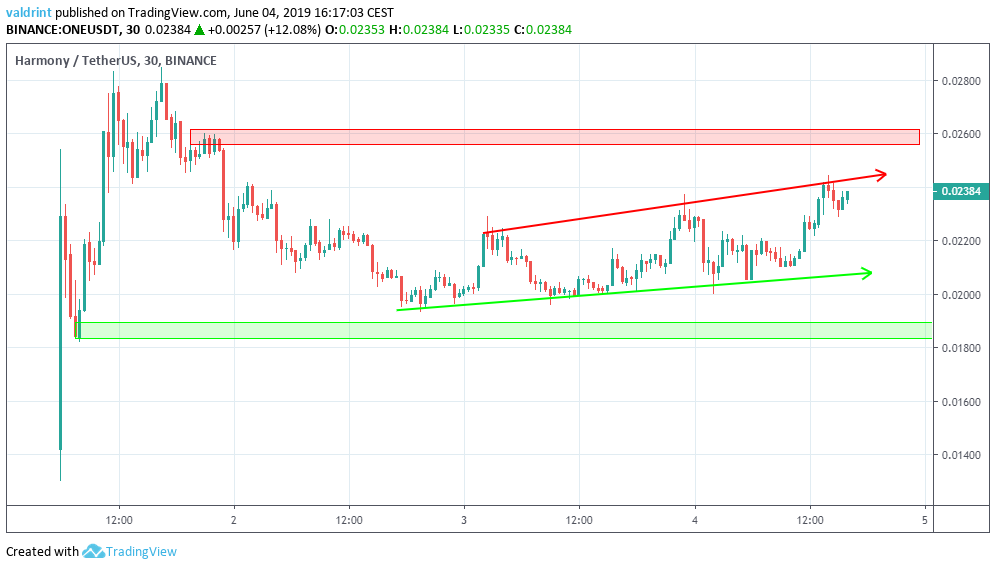
The closest resistance area is found near $0.026, while the closest support area is found near $0.018.
If the Harmony price (ONE) keeps increasing at the rate predicted by the channel, it will eventually reach the resistance area. A breakdown would be needed for the price to reach the support area.
Summary
The price of ONE is trading inside an ascending channel. It has developed short-term bearish divergence in the RSI. It is likely that the price will drop to touch the support line of the channel.
Disclaimer: This article is not trading advice and should not be construed as such. Always consult a trained financial professional before investing in cryptocurrencies, as the market is particularly volatile.


