


Traditional markets are giving the first signals of a bullish trend reversal. The chart of the S&P 500 (SPX) has just generated a golden cross – a bullish signal that is usually a confirmation of upcoming increases. Is the cryptocurrency market and Bitcoin price also initiating a bull market?
The high correlation of Bitcoin price with the S&P 500 chart continued throughout almost all of 2022 and early 2023. What’s more, the BTC chart should also expect a golden cross during the next few days. If the trend and correlation are maintained, Bitcoin – along with traditional markets – could be on the threshold of large surges.
What is a Golden Cross?
A golden cross is a pattern in technical analysis where the relative short-term moving average breaks out above the relative long-term moving average (MA). The opposite event is the death cross (a death cross). The former confirms an uptrend, while the latter indicates a downtrend.
The most common pair of moving averages in this pattern is the 50 MA and 200 MA. They are generated by high intervals, so they should be considered long-term indicators. Moreover, the golden cross and death cross are so-called lagging indicators, so they usually confirm events that have already taken place in the market.
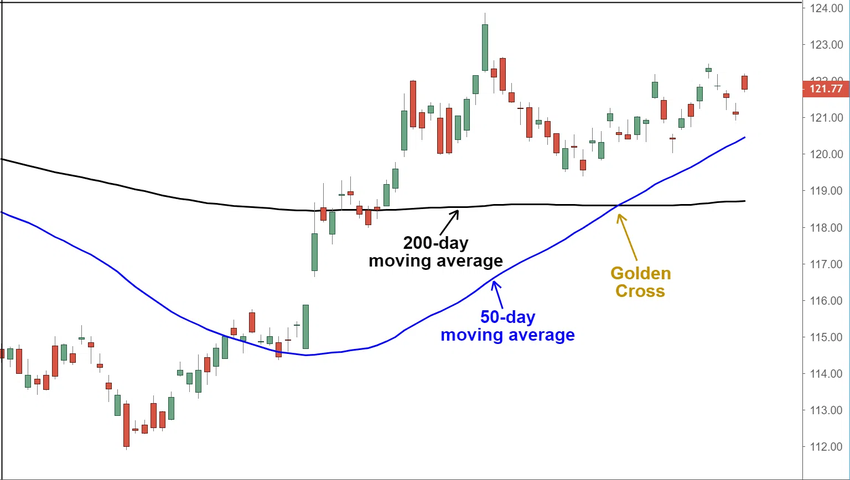
Golden cross is not an isolated event, but part of a 3-step process of changing the market trend:
- The end of the downtrend and the end of selling pressure.
- The crossing of the 50 MA above the 200 MA, or the actual golden cross.
- Continuation of the uptrend.
Golden Cross on S&P 500
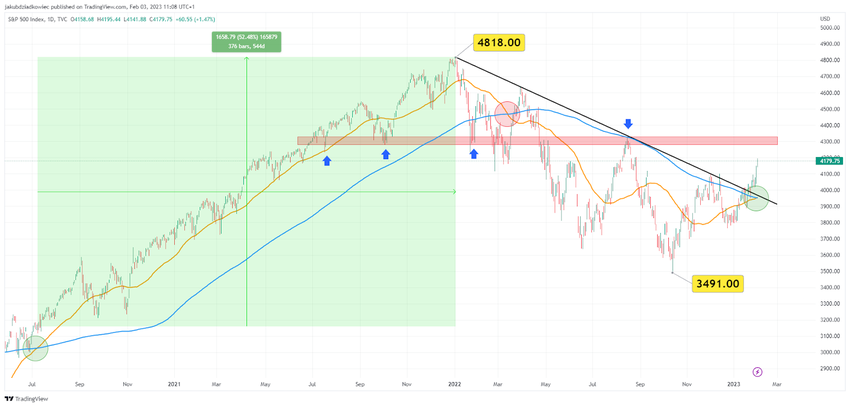
Yesterday a golden cross (green circle) happened on the chart of the SPX – one of the most popular indexes of traditional markets. The last time such an event occurred was on July 9, 2020, when the SPX was trading at $3160.
Back then, the cross was confirmation of the resumption of the bull market after the dramatic COVID-19 crash of March 2020. After that, the SPX rose 52% and recorded an all-time high (ATH) of $4818 on January 4, 2022.
After the ATH was reached, a bear market began, which appears to have ended at the end of 2022 at $3491. Confirmation of the start of the uptrend is the breakout above the descending trendline (black), which was in place since the ATH.
The golden cross that occurred yesterday only amplifies the strength of this breakout and signals the beginning of a long-term bull market. The nearest resistance that the SPX price is now targeting is the $4300 area (red rectangle). During the previous bull market it held as support, and during last year’s declines it rejected the price in August 2022 (arrows).
SPX Correlation With Bitcoin
Similar to the SPX chart, a golden cross will appear on the BTC chart in the next few days (green circle). The last time such an event occurred, Bitcoin surged 45% and reached the ATH of $69,000 on November 10, 2021.
This was followed by an almost year-long bear market, confirmed by the death cross on January 14, 2022 (red circle). Bitcoin fell below the descending resistance line (black). This line, alongside the 200D MA, rejected the BTC price in late March 2022, accelerating the downward movement.
However, the Bitcoin price managed to break out above this descending resistance line in October 2022. It then confirmed it during the November decline triggered by the FTX market crash. If the bullish reversal of the cryptocurrency market has already taken place, the upcoming golden cross will confirm it.
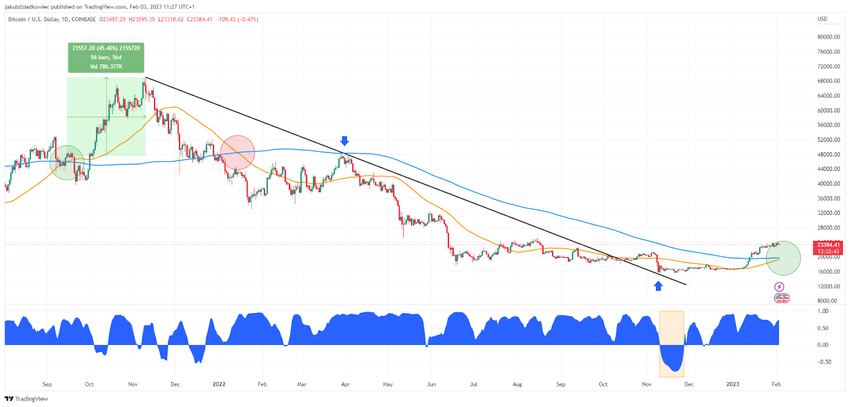
It is worth mentioning that for almost all of 2022, Bitcoin was in a strong positive correlation with the S&P 500 (blue chart). Only a brief period in November 2022 (orange rectangle) was negatively correlated, as the traditional markets did not see a decline analogous to the FTX crash.
Currently, the correlation coefficient is 0.72 and rising. If the trend continues, the golden cross on SPX and the upcoming one on BTC could be confirmation of the start of a long-term bull market in traditional stocks and cryptocurrencies.
For BeInCrypto’s latest crypto market analysis, click here.


