


Bitcoin and Gold have often been compared to each other, with the former sometimes being called ‘digital gold.’ Naturally, this has led to the use of fractals in the price of one to attempt and predict the price of the other.
While this type of relationship has not been confirmed, Bitcoin and gold have indeed created similar patterns in the past. Trader @sawcruhteez outlined several such similarities in the BTC and gold prices.
While the time-frames used in the analysis are not identical, the price movement is very comparable to each other.
The similarities go as follows:
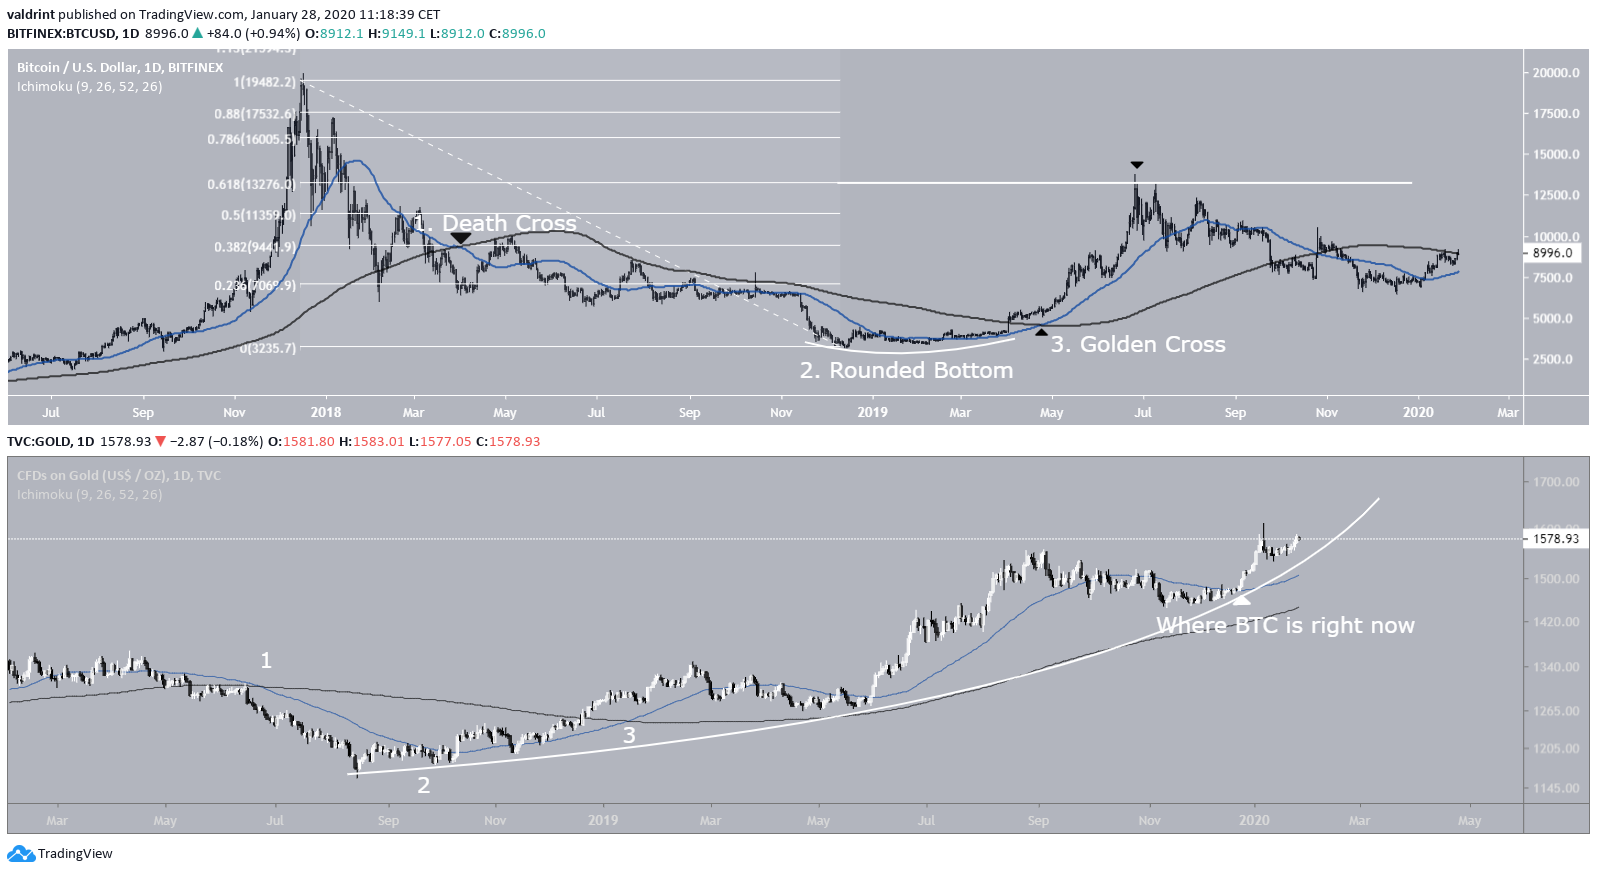
- A death cross
- A rounded bottom
- A bull flag that finds support above the golden cross
- A breakout
Seeing a lot of similarities with $BTC and #Gold. Notice how gold formed a beautiful bull flag as it pulled back and into a weekly golden cross. This was shortly after forming a very nice rounded bottom. #Bitcoin appears to be mirroring this action on the daily. 🚀 pic.twitter.com/wU4hONu39d
— The Weatherman (@Sawcruhteez) January 27, 2020
Let’s take a look at the prices of both assets and attempt to use these similarities to predict the future price movement.
Gold
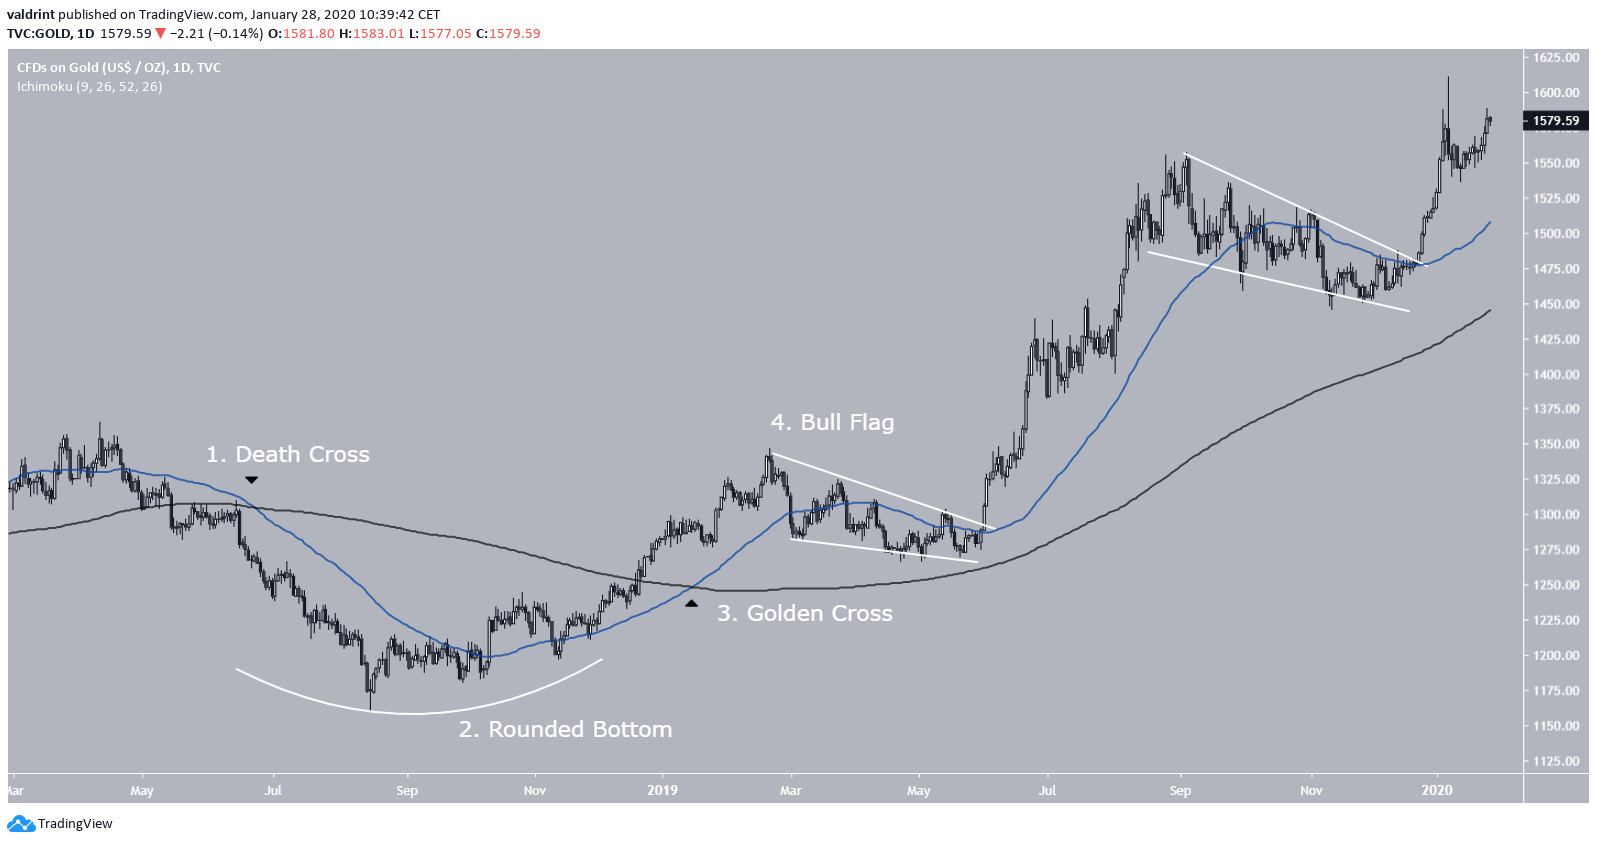
The death cross, which is another name for a bearish cross between the 50- and 200-day moving averages (MAs), transpired on June 25, 2018.
The gold price continued to decrease, creating the rounded bottom in the period from July-December 2018.
A golden cross (bullish cross between the same MAs) transpired shortly after, on January 16, 2019.
Afterward, the gold price created a bullish flag throughout March-June 2019 — finding support above the 200-day MA and breaking out afterwards. It has been increasing since.
Another bullish flag was created near the end of 2019 — out of which the price again broke out.
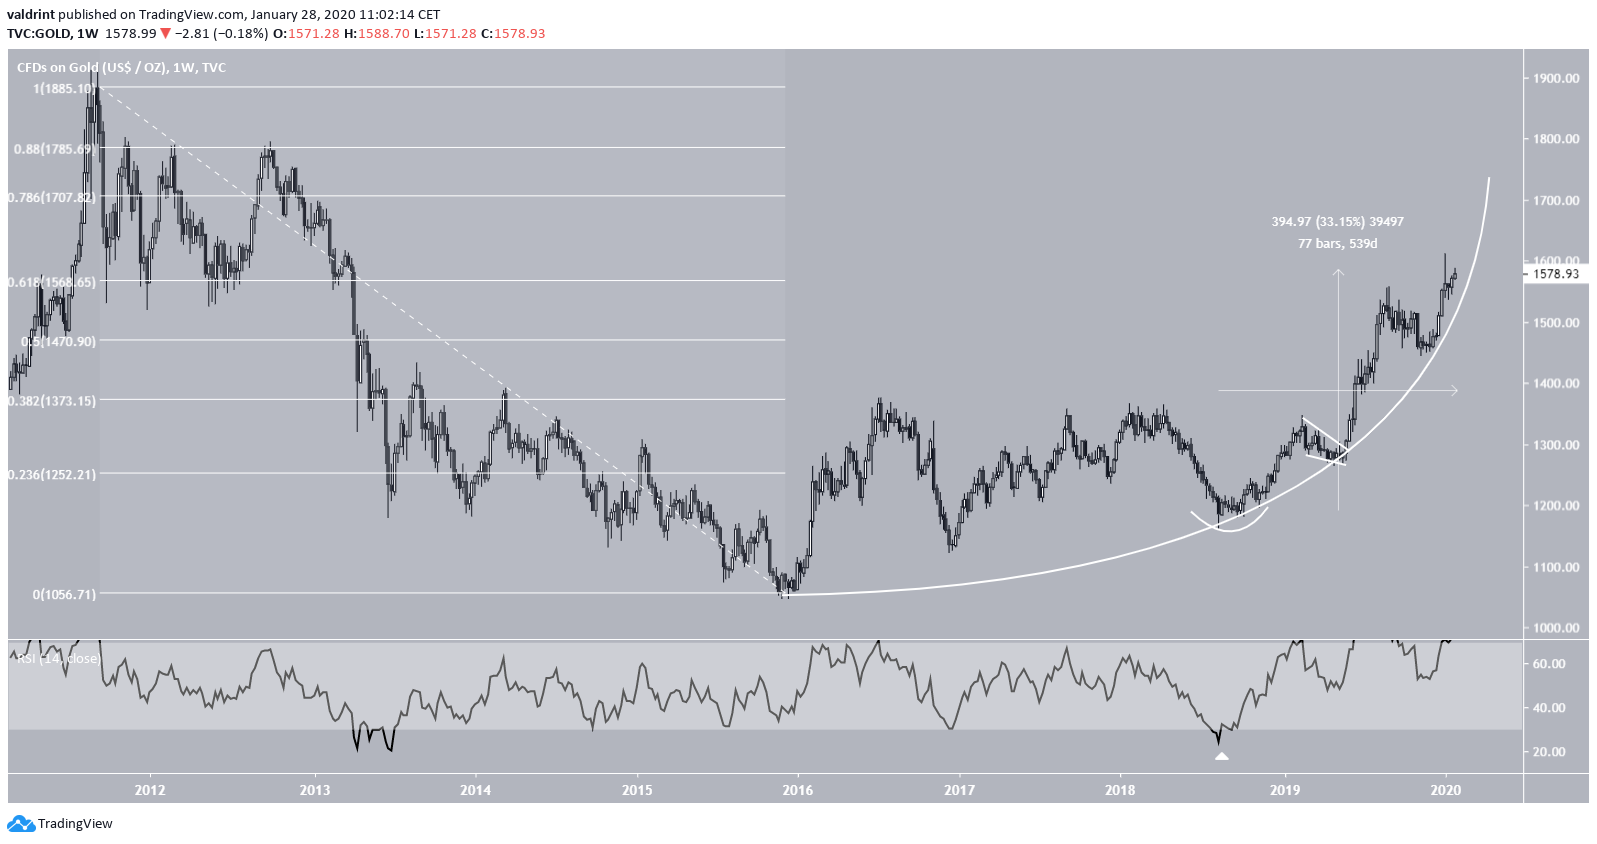
Looking at a longer time-frame, we can see that gold has been following a curved ascending support line since early 2016. The first validation of this support line transpired during the rounded bottom phase, which was also combined with an oversold value in the RSI — the lowest it has been since 2013.
Since then, the gold price has increased by roughly 33 percent in 579 days but has failed to move above the 0.618 Fib level of the entire previous decrease.
Bitcoin
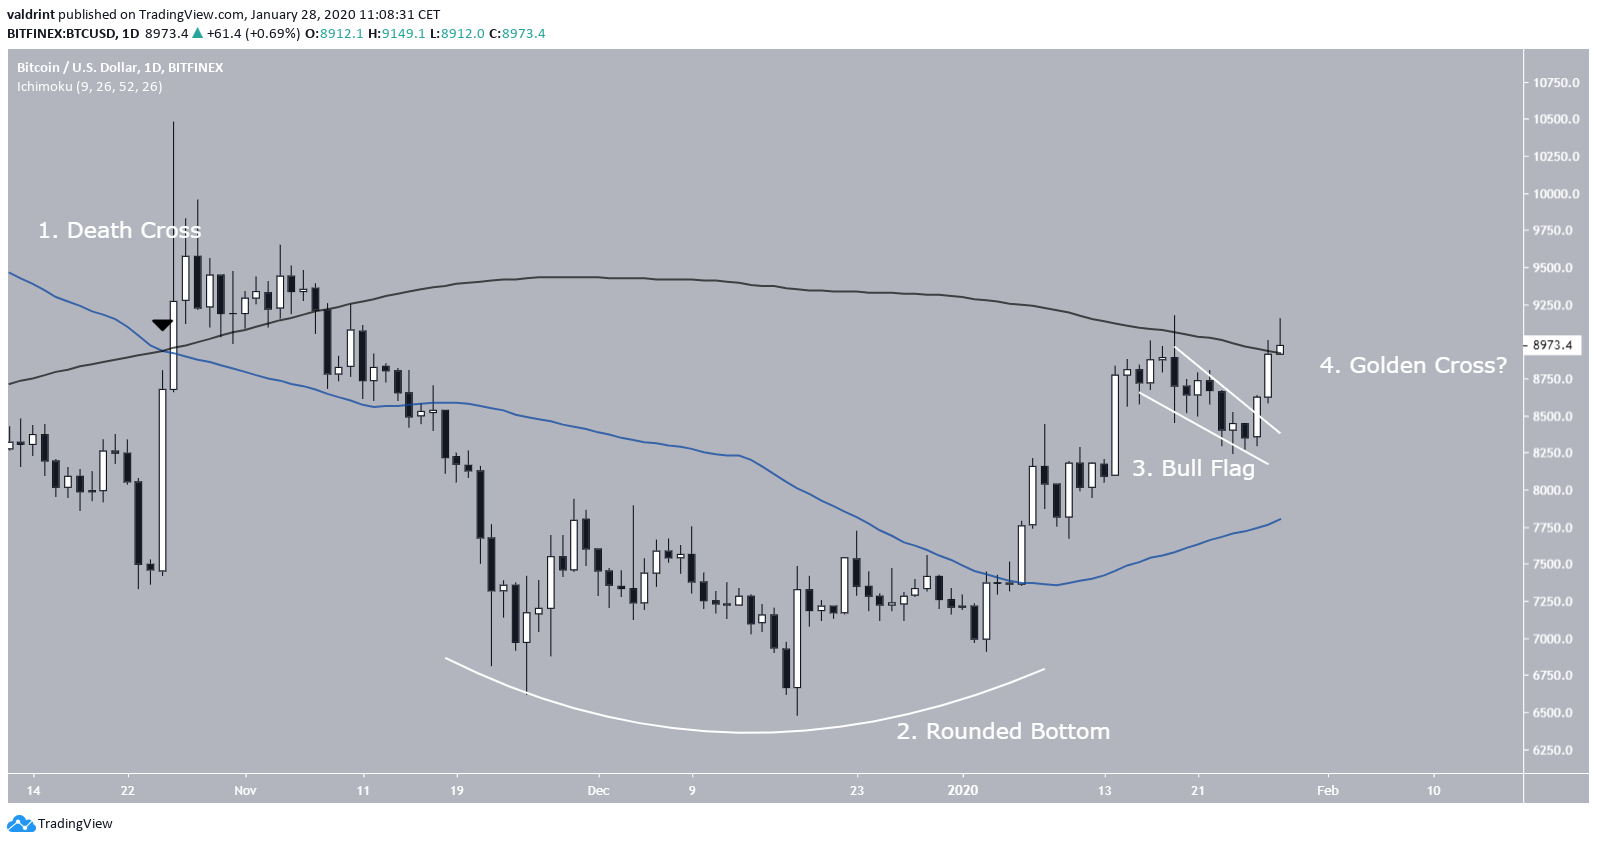
In the case of Bitcoin, the death cross transpired on October 25, 2019. What followed was the rounded bottom, which was created throughout November/December 2019.
Since then, the Bitcoin price has been increasing. It created a bull flag and broke out on January 26, 2020.
However, a golden cross has yet to occur. In the case of gold, the golden cross occurred prior to the breakout and the gold price found support at the 200-day MA. In the case of Bitcoin, a golden cross has yet to occur — and the price found support at the 50-day MA instead.
Similar to gold, Bitcoin is also following a curved ascending support line — which began at the end of the rounded bottom instead of prior to it.
What is immediately noticeable is the scale of the price increase. In 64 days, BTC has already increased by 38 percent — which is more than gold did over 579 days.
Another strong similarity comes from the Fibonacci levels. The Bitcoin price is also at the 0.618 Fib level of the entire previous decrease and has struggled to breakthrough. Once it does, we would expect the rate of increase to accelerate.
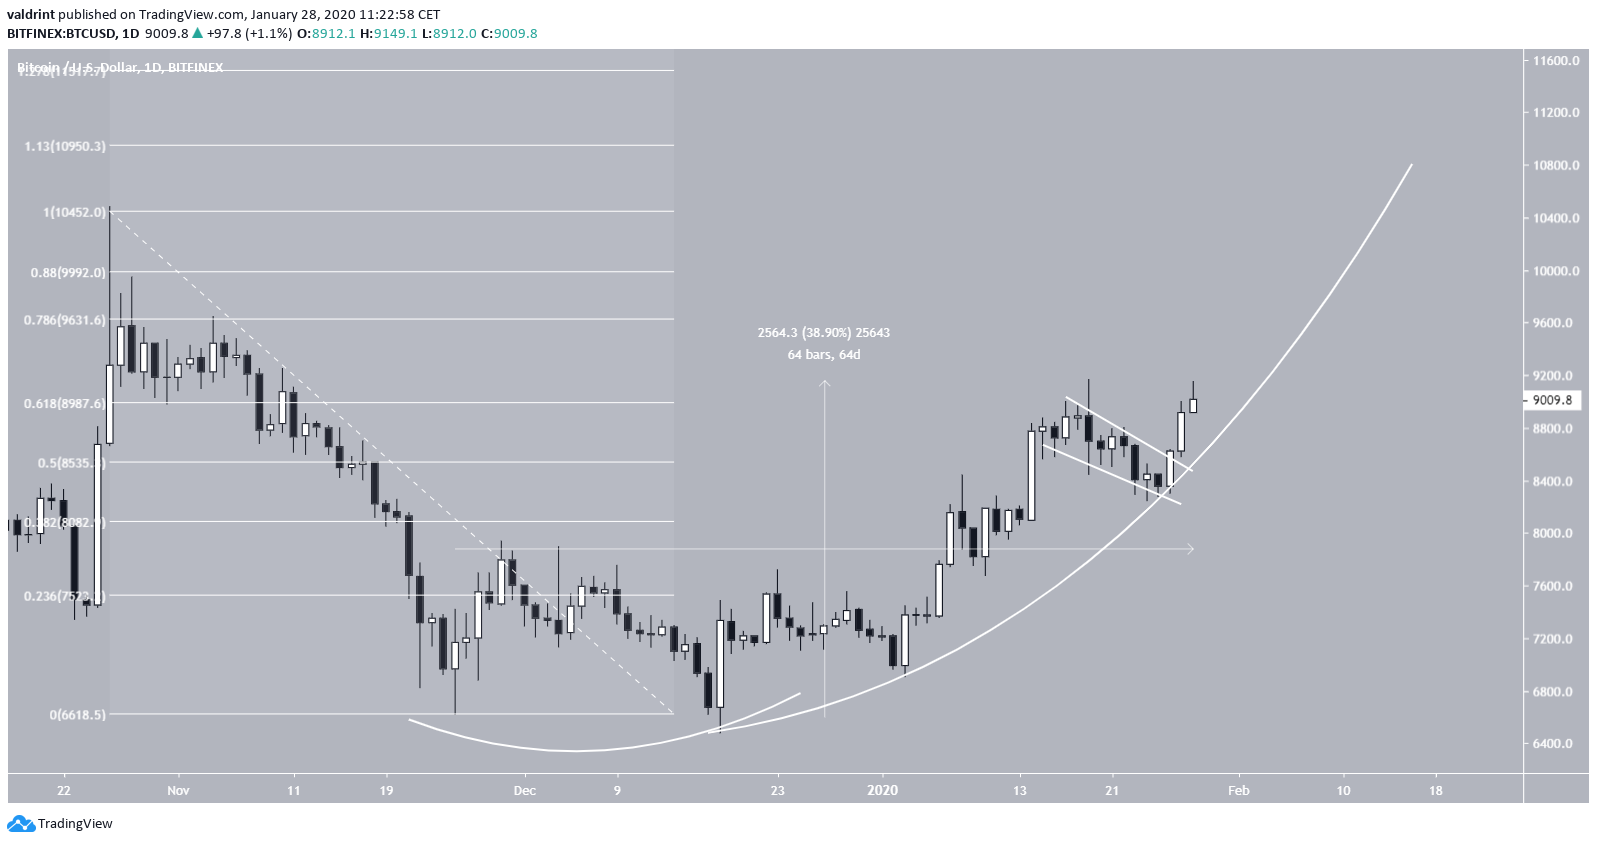
If the price of Bitcoin continues following that of gold using this fractal, we would expect it too soon move above $10,000 and aim for the $13,764 high reached on June 24, 2019
An Alternative Scenario
Looking at a much longer time-frame, we can see another similarity for Bitcoin and gold. In this one, we will use the second to last death cross instead of the most recent one.
The rounded bottom transpired over November 2018-March 2019 and the golden cross followed shortly after.
The aforementioned $13,764 high was at exactly the 0.618 Fib level of the previous decrease, fitting perfectly with the gold fractal. However, a death cross has occurred since — which was not the case in gold.
This scenario also suggests that the Bitcoin price will soon aim for the $13,764 high and also states that BTC is at a more advanced stage of its upward trend rather than in the beginning.
To conclude, the Bitcoin and gold prices share several similarities when we look at the gold price since late 2018. While we can be sure that the Bitcoin price is in an upward trend, using the price of gold as a comparison leaves some ambiguity as to which phase of the upward trend Bitcoin is.


