


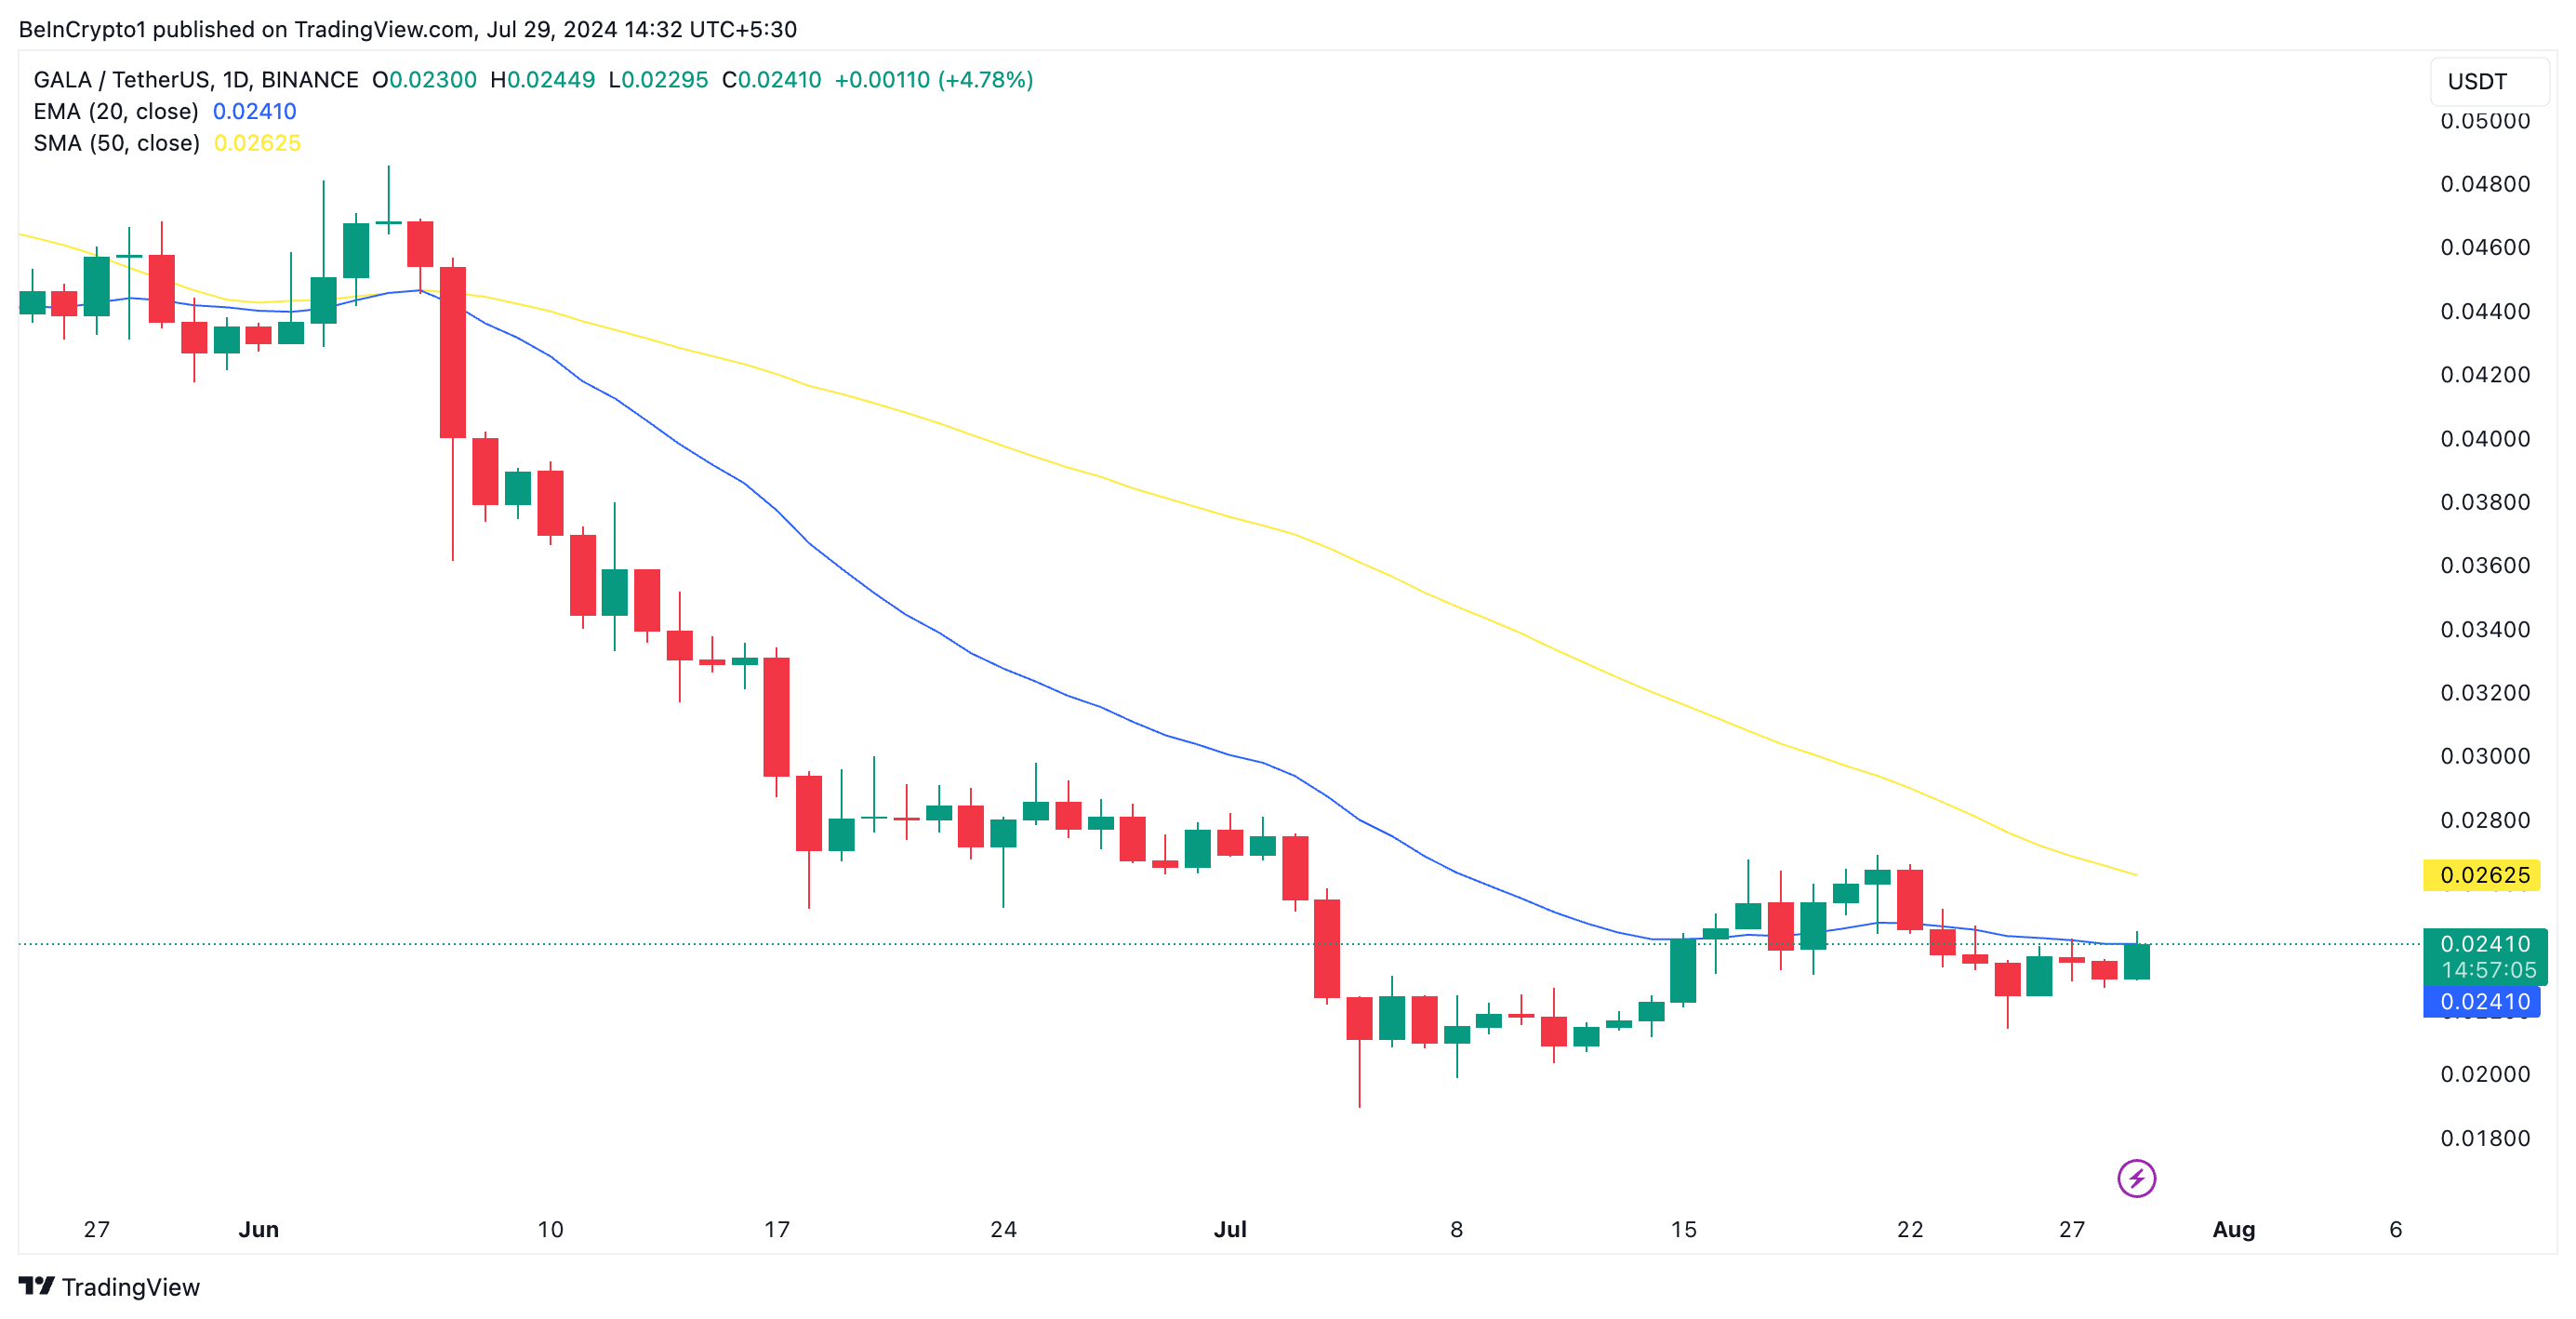
Gala’s (GALA) recent uptick has pushed its price above its 20-day exponential moving average (EMA). The altcoin is now moving toward its 50-day simple moving average (SMA).
As it attempts to cross above this key moving average, market volatility has declined, suggesting that GALA now trends within a narrow range.
Gala Market Cools as Token Approaches Key Moving Average
An asset’s 20-day EMA measures the average price of an asset over the past 20 trading days. Its 50-day SMA, on the other hand, calculates its average closing price over the past 50 days.
When an asset’s price rises above its 20-day EMA, it indicates the beginning of short-term bullish momentum. If the price approaches and surpasses the 50-day SMA, the uptrend may extend beyond the short term.
As GALA approaches its 50-day SMA, market volatility has reduced. This is based on readings from some of the token’s volatility markers. For example, GALA’s Average True Range (ATR), which measures its volatility over a specified period, has trended downward since the beginning of July. At 0.0018 at press time, GALA’s ATR has since fallen by 28%.
When an asset’s ATR declines, it indicates a decrease in market volatility. It means that its daily price movements are decreasing, suggesting that the market is less prone to price swings.
Following a similar trend, the token’s Chaikin Volatility has also declined. At press time, the indicator is below its center line at -9.37.
Read More: How to Buy Gala (GALA) and Everything You Need to Know
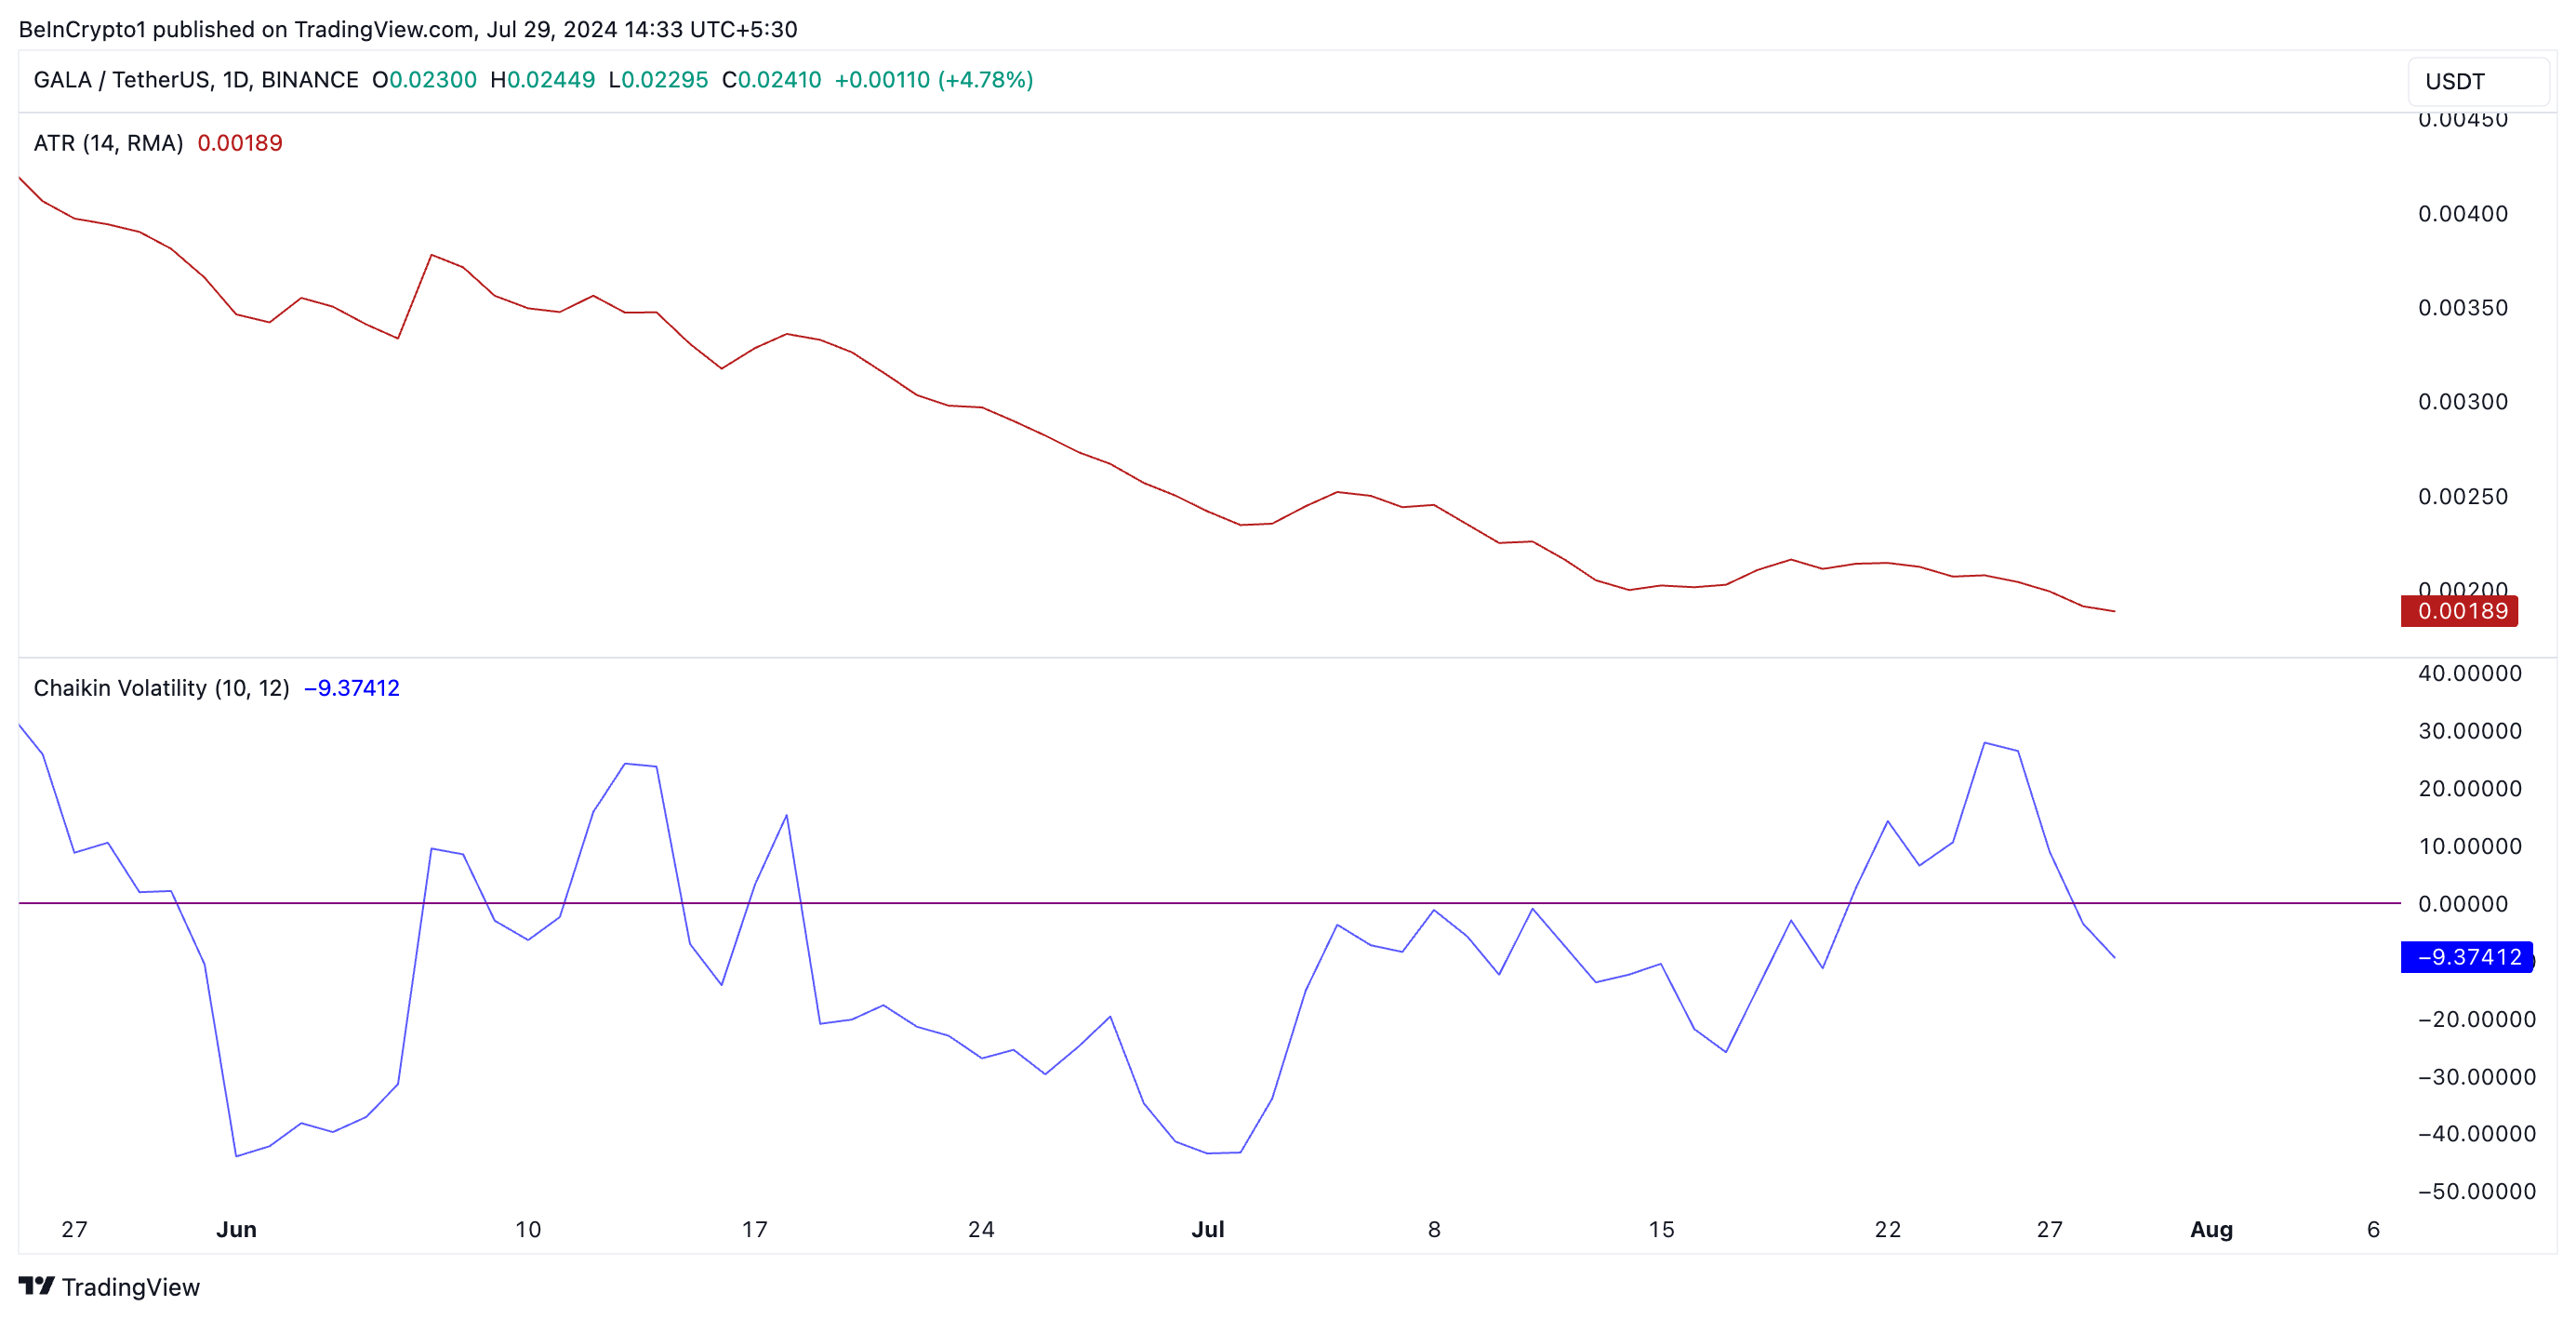
This metric also tracks an asset’s market volatility. When it declines, it suggests that the market is experiencing smaller price swings. This is often a sign of consolidation or a marker of reduced market activity.
GALA Price Prediction: Altcoin Has to Break Above Narrow Range
For a successful rally past the 50-day SMA, GALA has to break above the upper line of its horizontal channel, which forms resistance at $0.026. If this happens, the altcoin will rally to trade at $0.034.
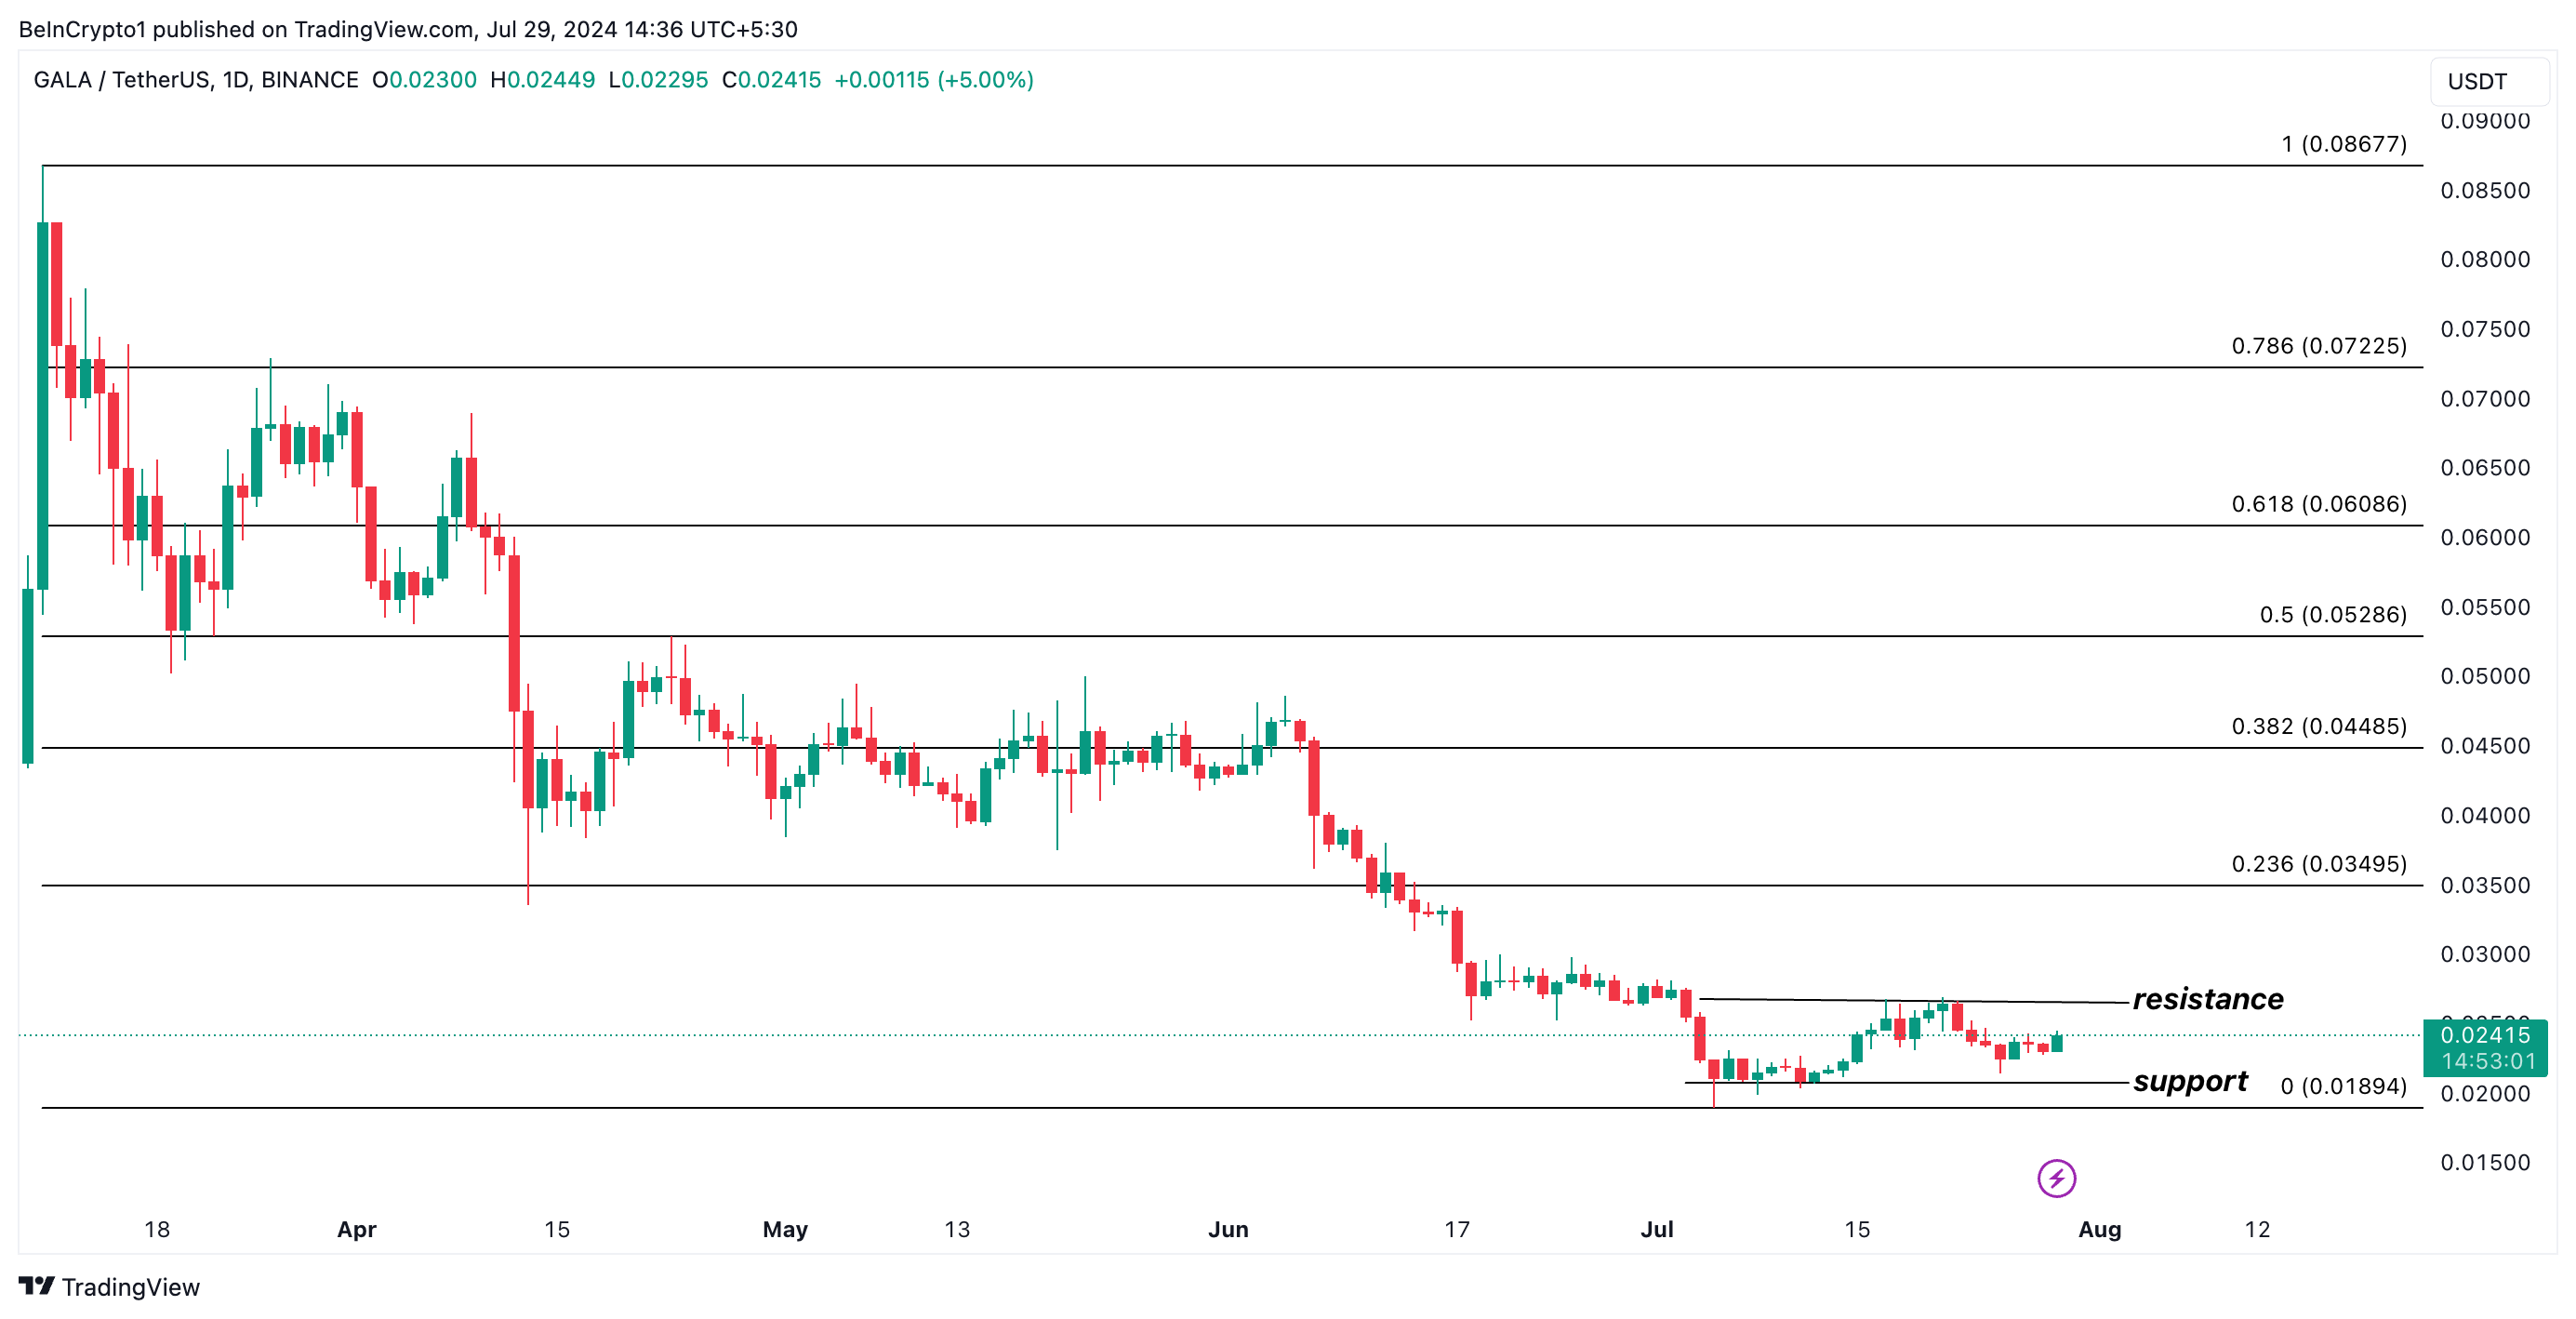
However, if buying pressure remains low, GALA will continue to trend within the channel and may fall to support at $0.018 if bearish sentiment lingers.



