


Ethereum (ETH) bounced at a confluence of support levels on Sept. 22, potentially signaling the end of a month-long correction.
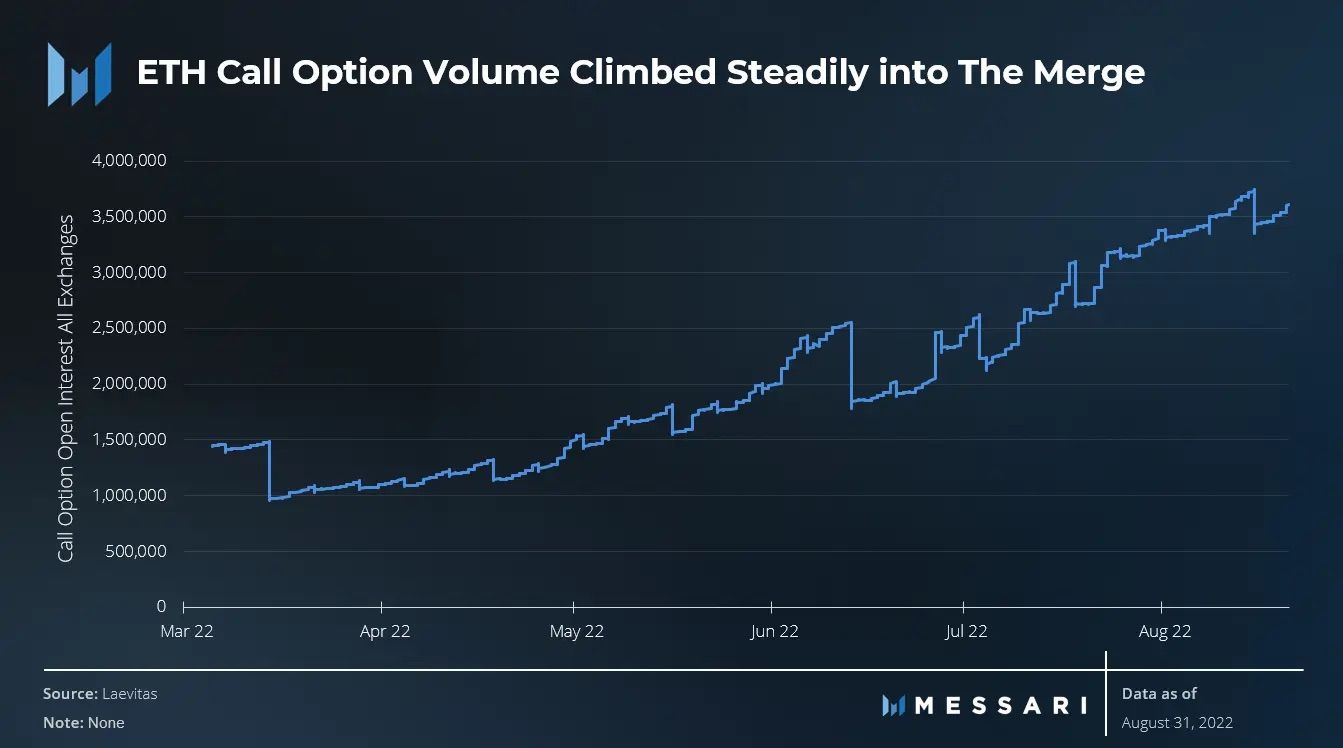
Since the Ethereum Merge went live on Sept. 15, options traders have had a bullish outlook for the future price. This can be clearly seen by the call options volume, which has climbed to more than $3.5 million as of Monday. This is a more than threefold increase since the $1 million lows of March.
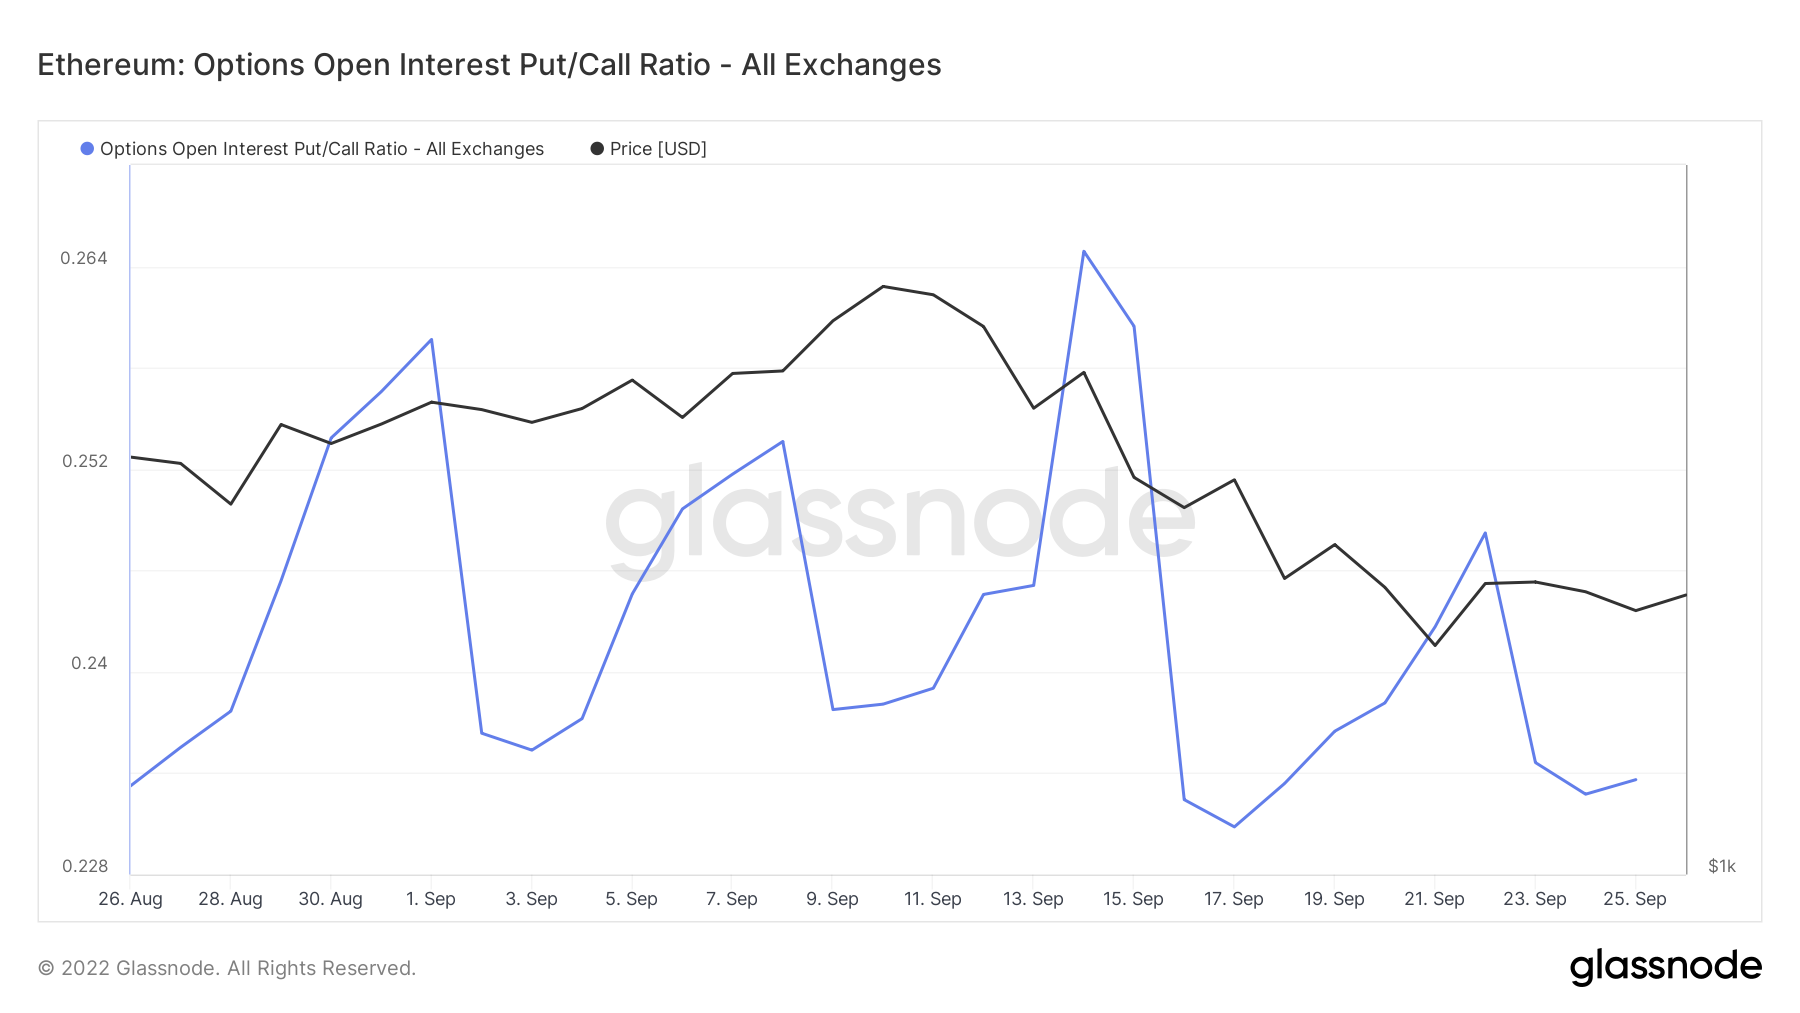
The bullish sentiment is also visible in the put/call ratio, which is currently at 0.23. This means that for each dollar that options traders have placed in an ETH put, there are more than $4 (1/0.23) placed in a call.
ETH breakout on the horizon?
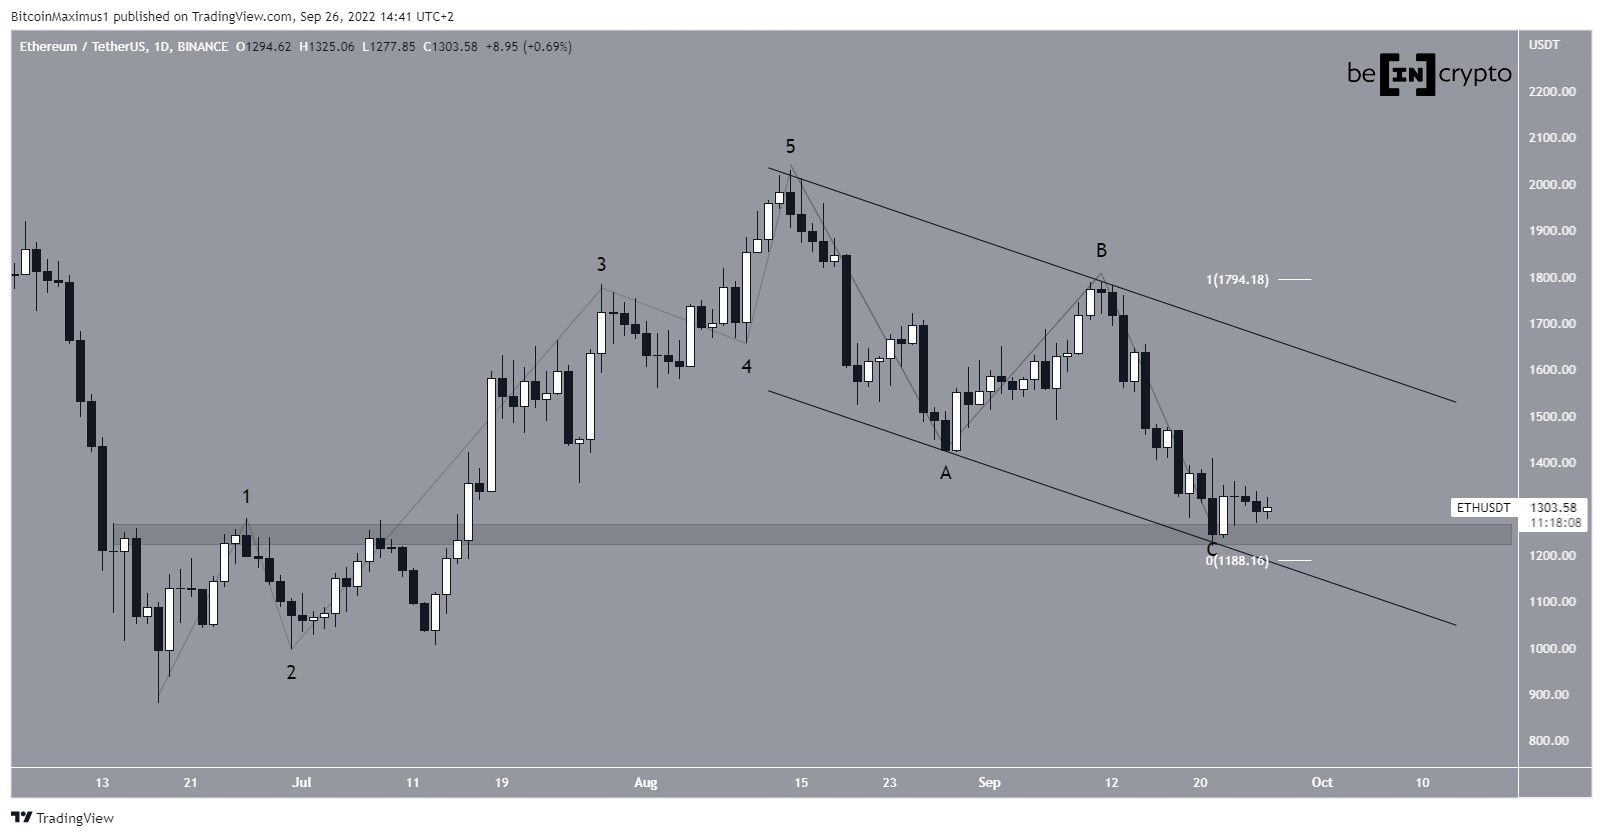
ETH has been decreasing inside a descending parallel channel since reaching a high of $2,030 on Aug. 14. Such channels usually contain corrective movements, meaning that an eventual breakout from it would be expected.
On Sept. 21, ETH reached a low of $1,220 and bounced. This movement served to validate the $1,250 horizontal support area and the support line of the channel. Moreover, it gave waves A:C an exactly 1:1 ratio. As a result, it is very likely that the correction is complete.
A breakout from the channel would confirm this while a decrease below the $1,220 lows would invalidate this scenario.
Rate of increase could gain pace
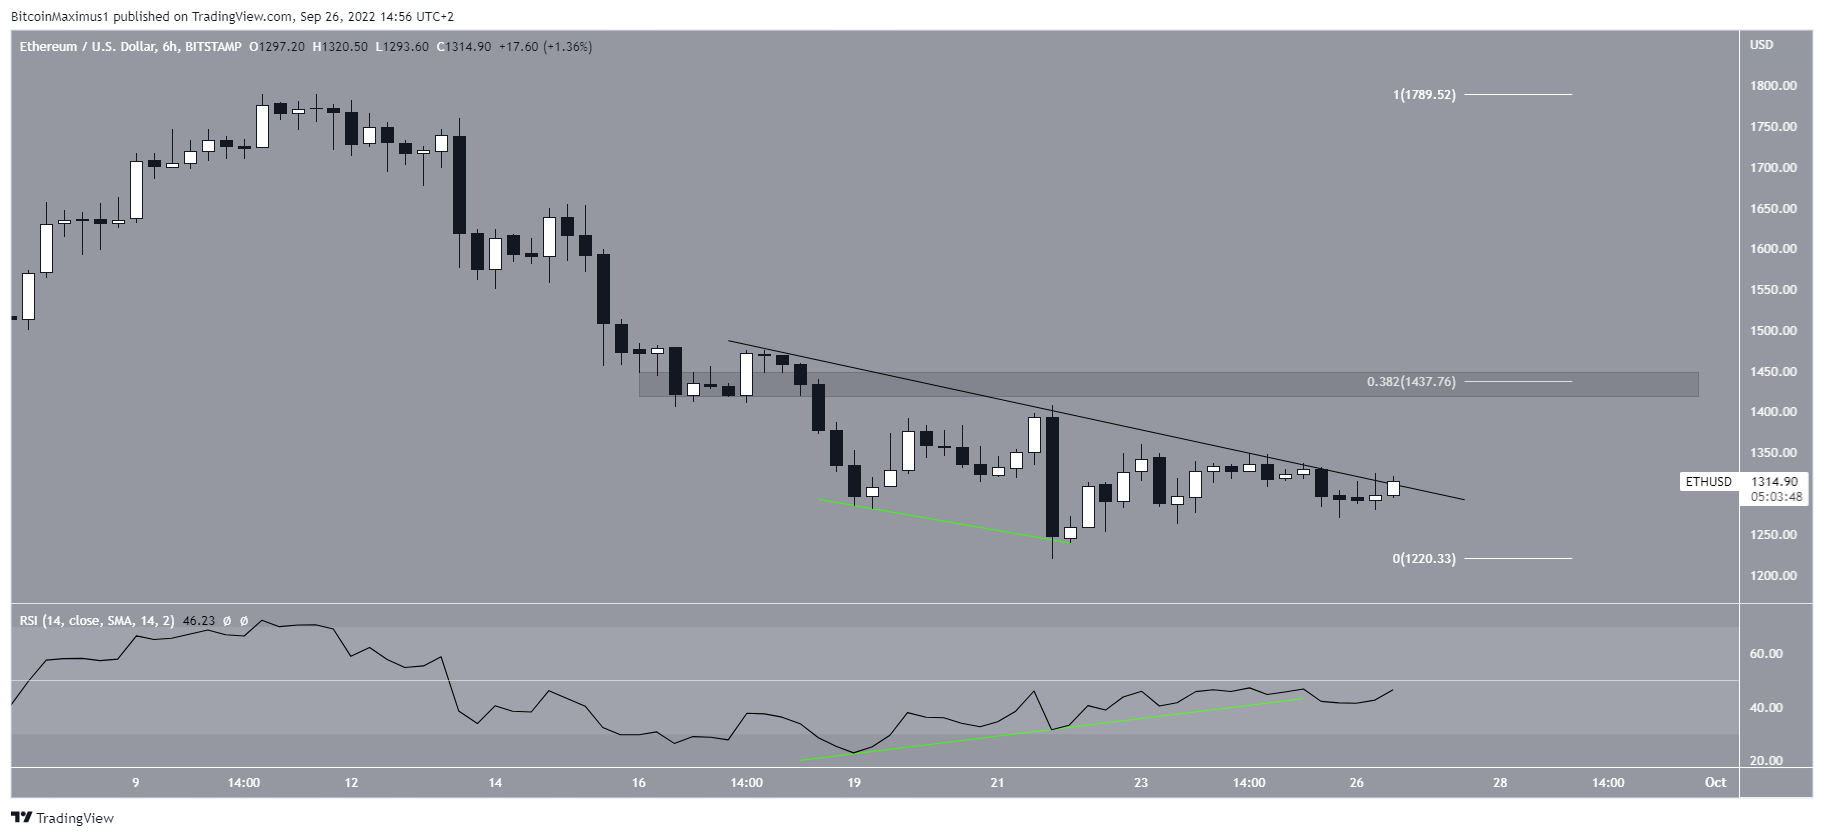
The six-hour chart aligns with this reading. It shows that ETH is in the process of breaking out from a descending resistance line which had been in place since Sept. 17.
The upward movement began after the six-hour RSI generated bullish divergence (green line). Now, the indicator is in the process of moving above 50. If it is successful in doing so and the price reaches a close above the resistance line, it would confirm that a bullish reversal has begun.
In that case, the main resistance area would be at $1,440. If ETH is successful in moving above it, the rate of increase could greatly accelerate.
For Be[In]Crypto’s latest Bitcoin (BTC) analysis, click here


