


FTX Token (FTT) is showing bullish signs after bouncing at a long-term horizontal support area and breaking out from a descending resistance line afterward.
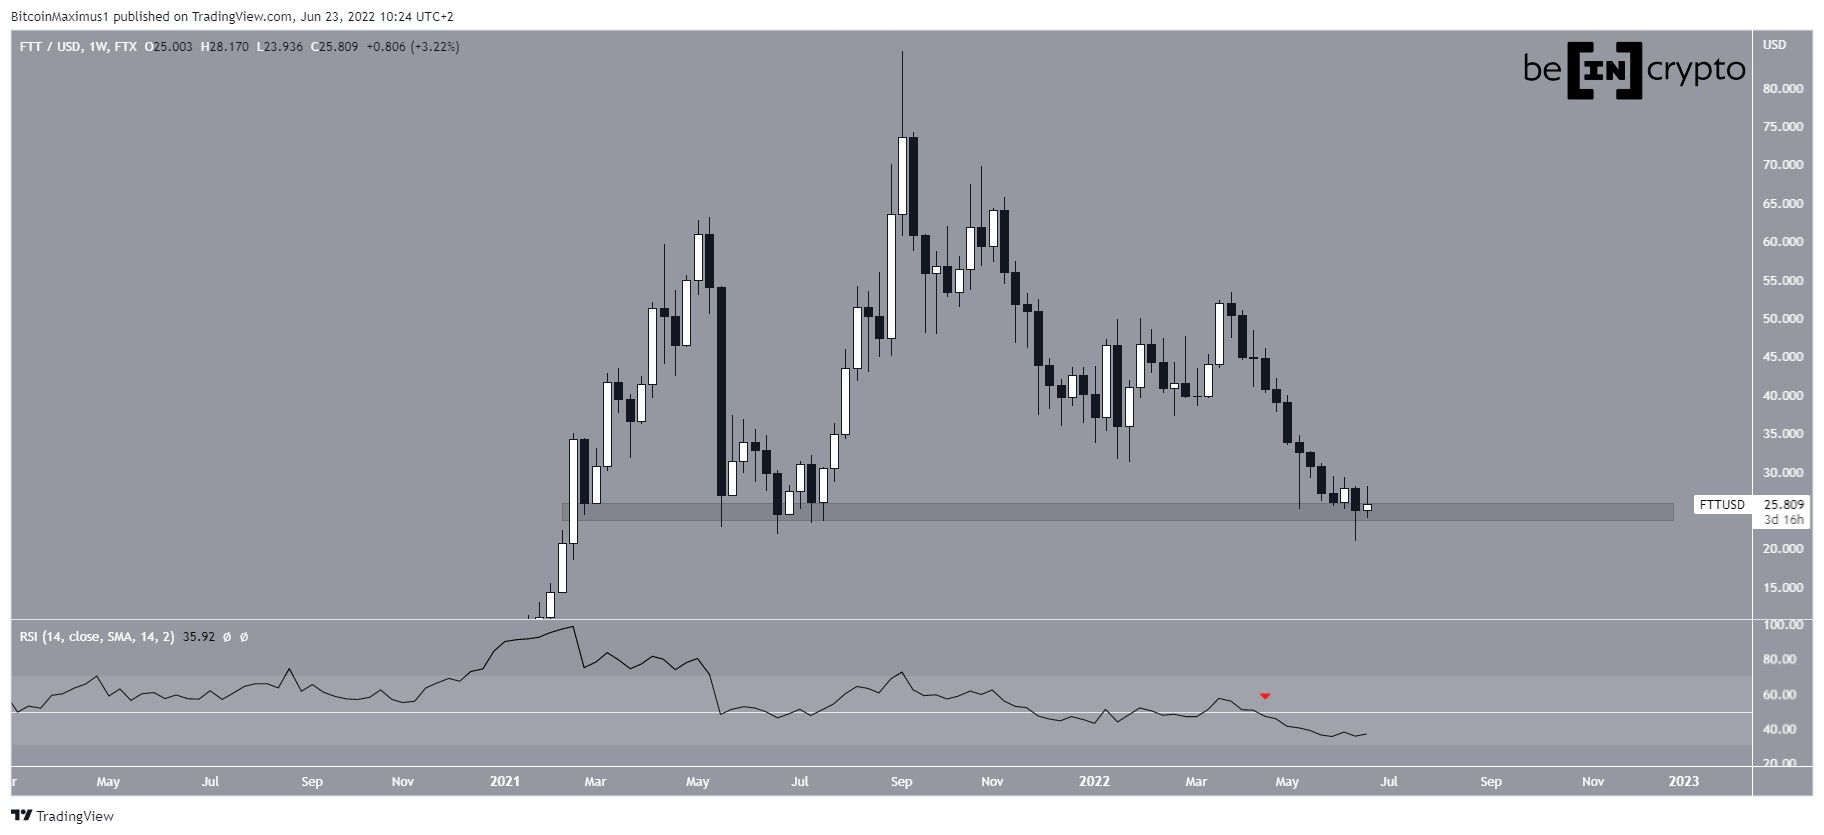
FTT has been falling since reaching an all-time high price of $81 in Sept 2021. The downward movement has so far led to a low of $21 on June 25.
The low was made inside the $24 horizontal support area, which has been in place since Feb 2021. The price swept the June 2021 lows before bouncing and creating a long lower wick, which is considered a sign of buying pressure.
Despite this sweep and reclaim, the weekly RSI is below 50 (red icon), a reading that is associated with bearish trends. Additionally, it has not generated any bullish divergence yet.
Short-term FTT breakout
Cryptocurrency trader @Crypto_Scofield tweeted a chart of FTX which shows a breakout from a short-term wedge.
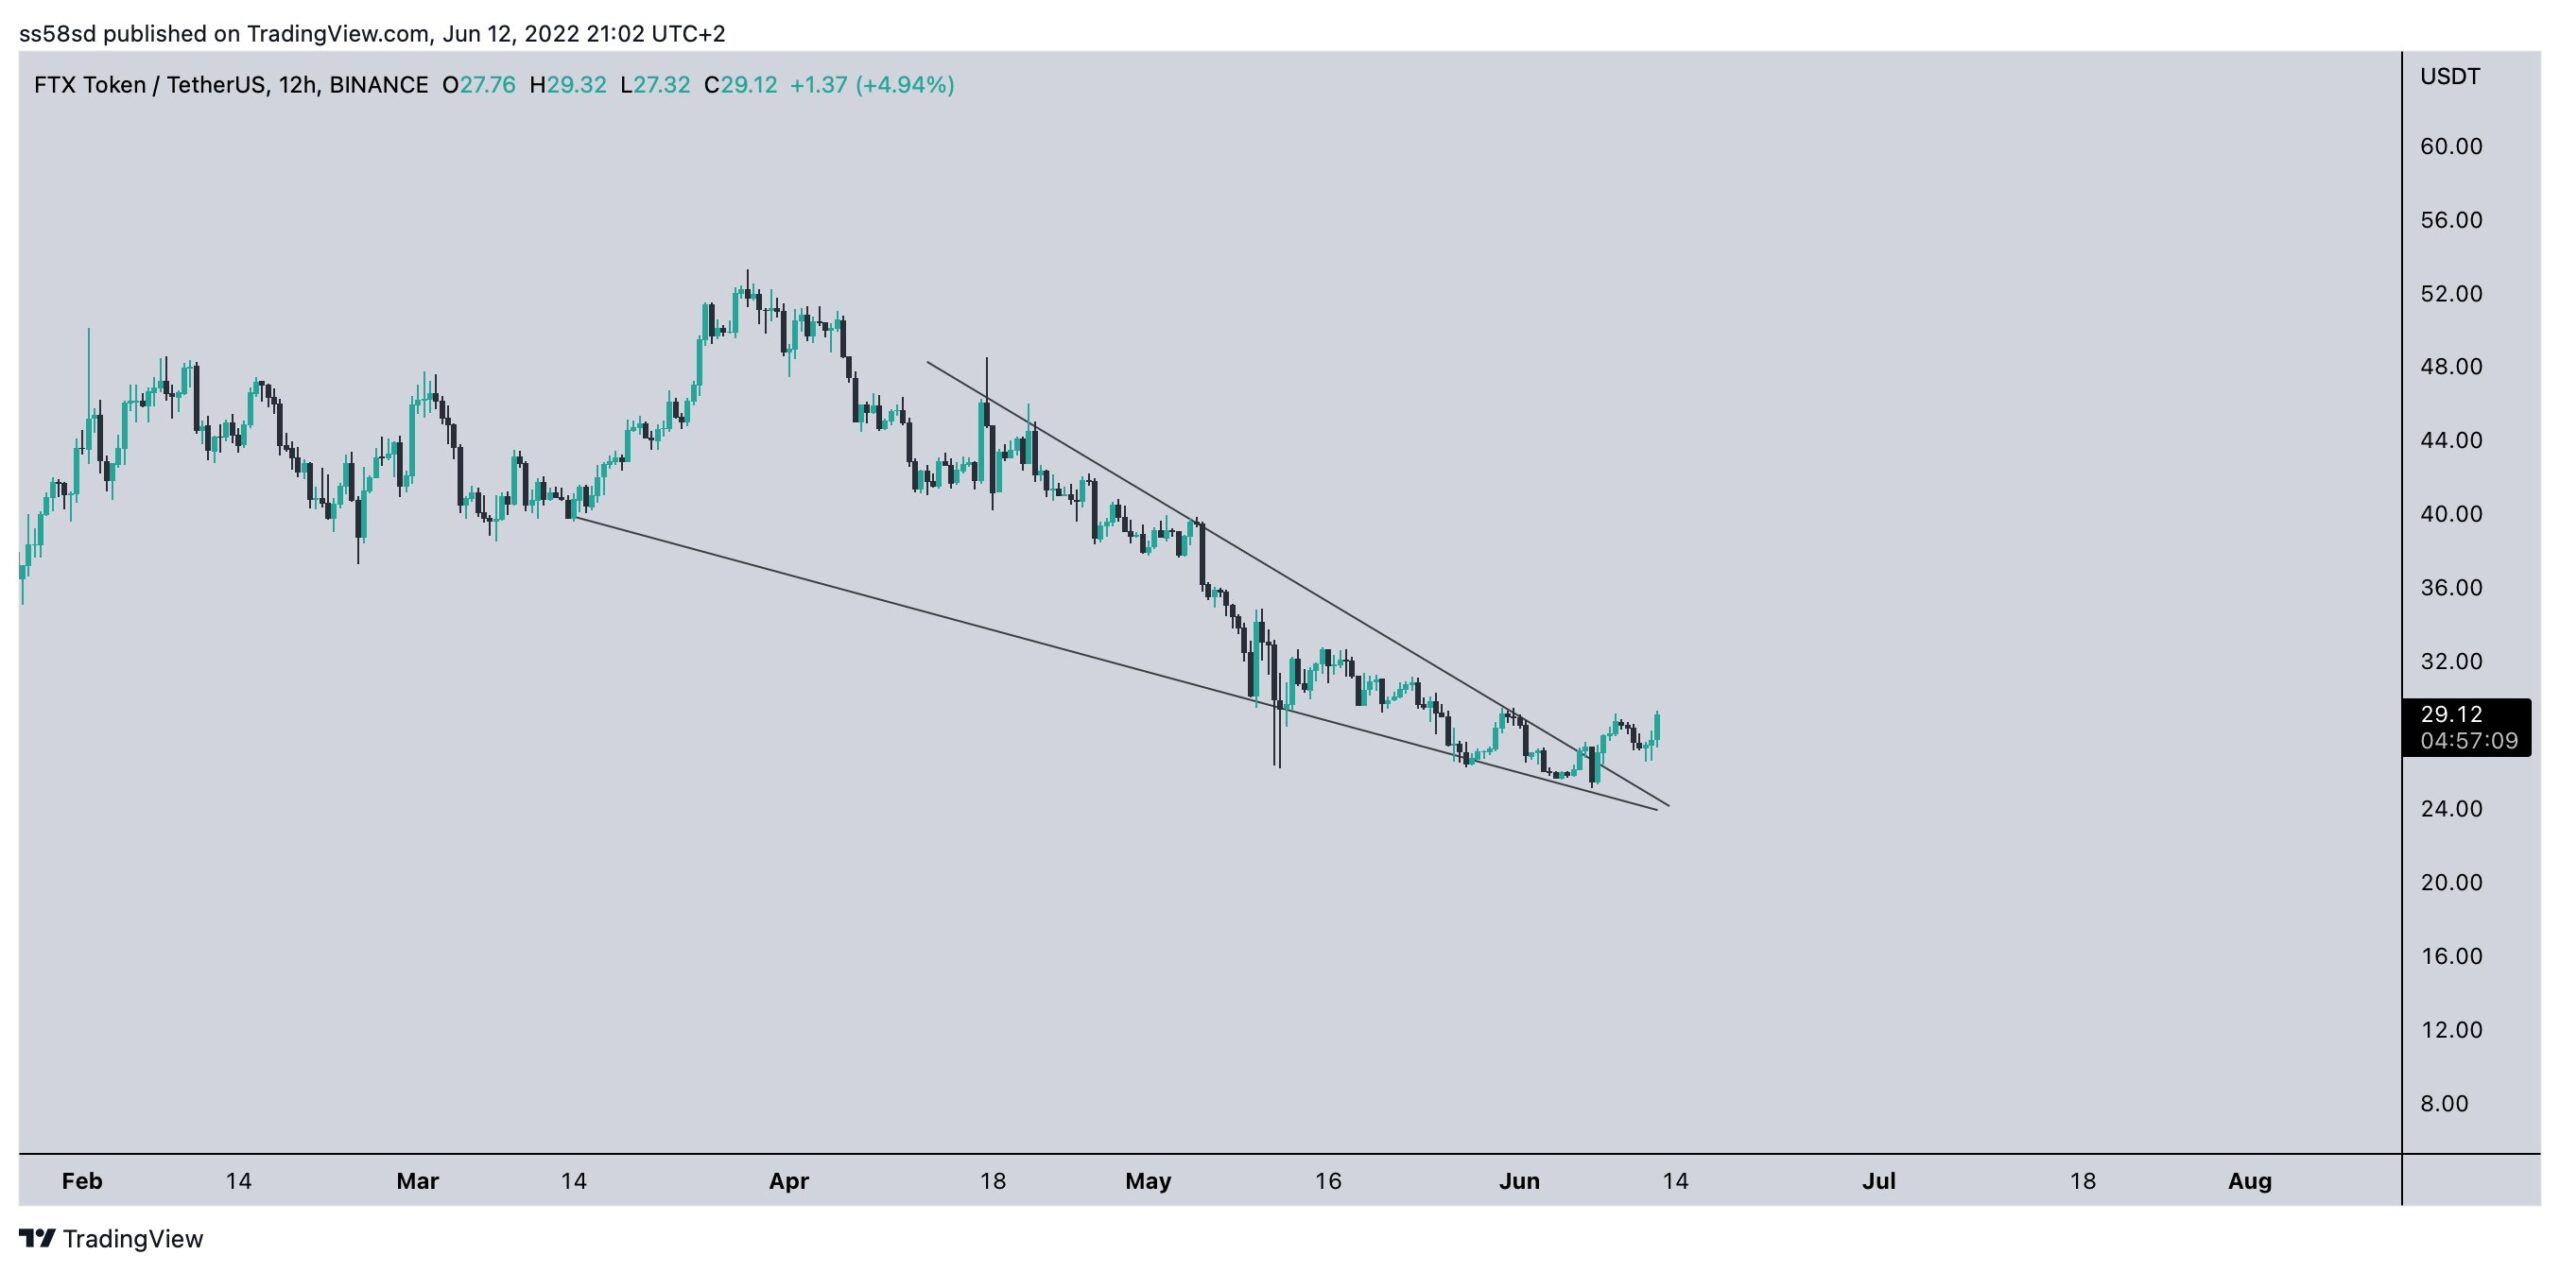
While the wedge is not confirmed due to the lack of sufficient touches in the support line, it seems likely that the price has already broken out from a descending resistance line.
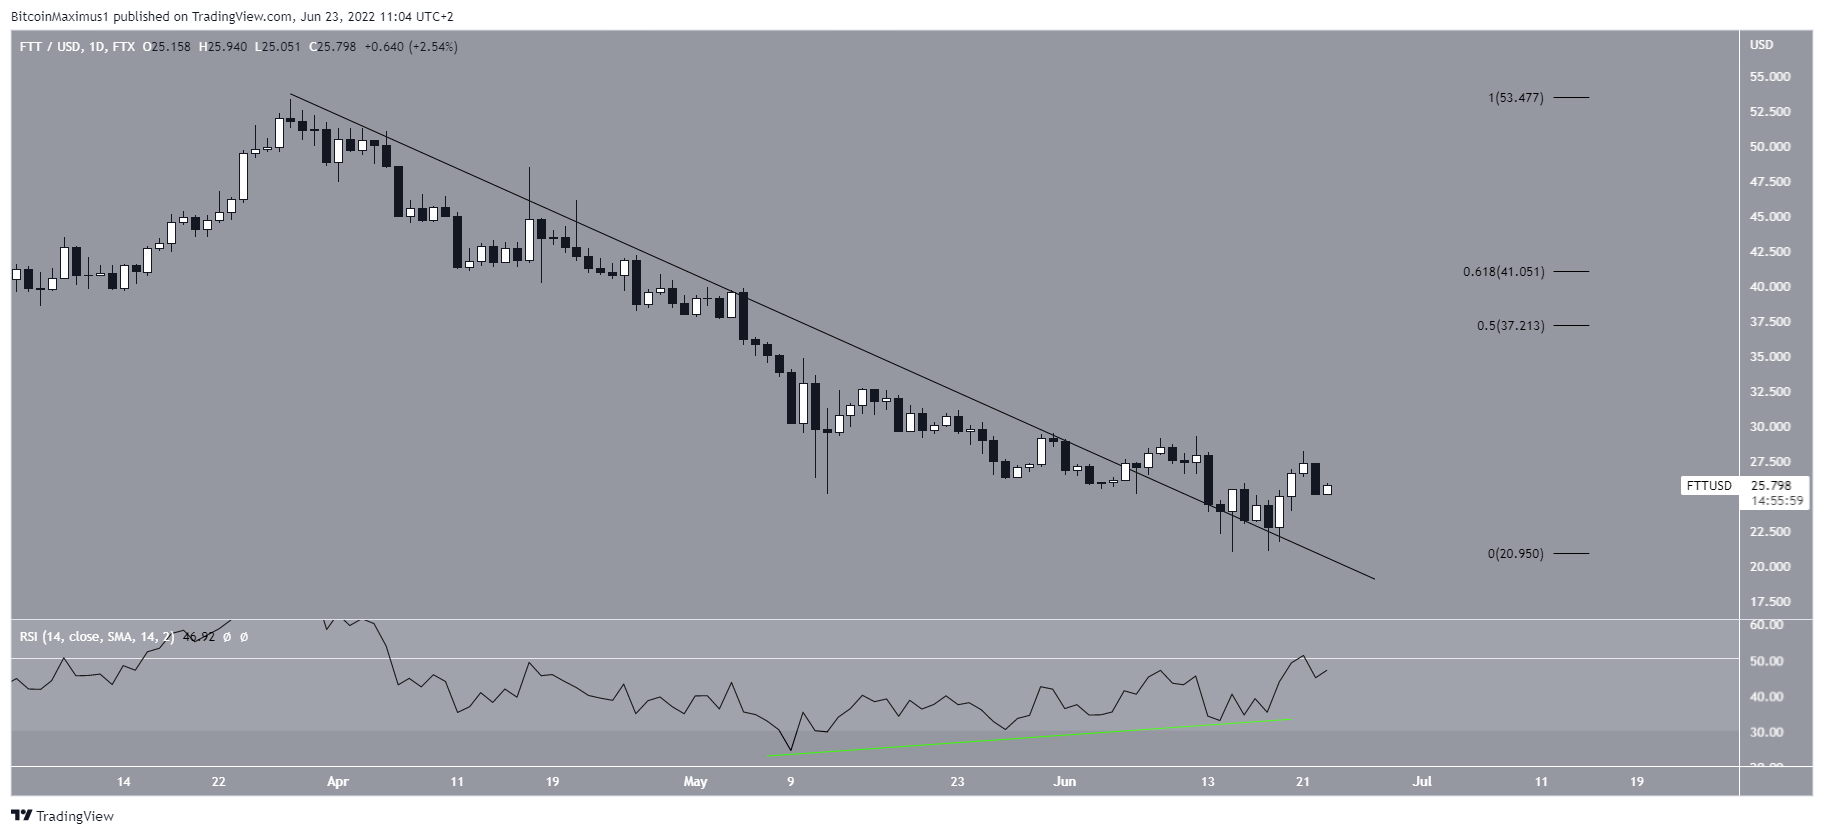
The breakout occurred after the daily RSI generated a very significant amount of bullish divergence (green line).
If the upward movement continues, the closest resistance area would be between $37 and $41. This is the 0.5-0.618 Fib retracement resistance area.
Wave count analysis
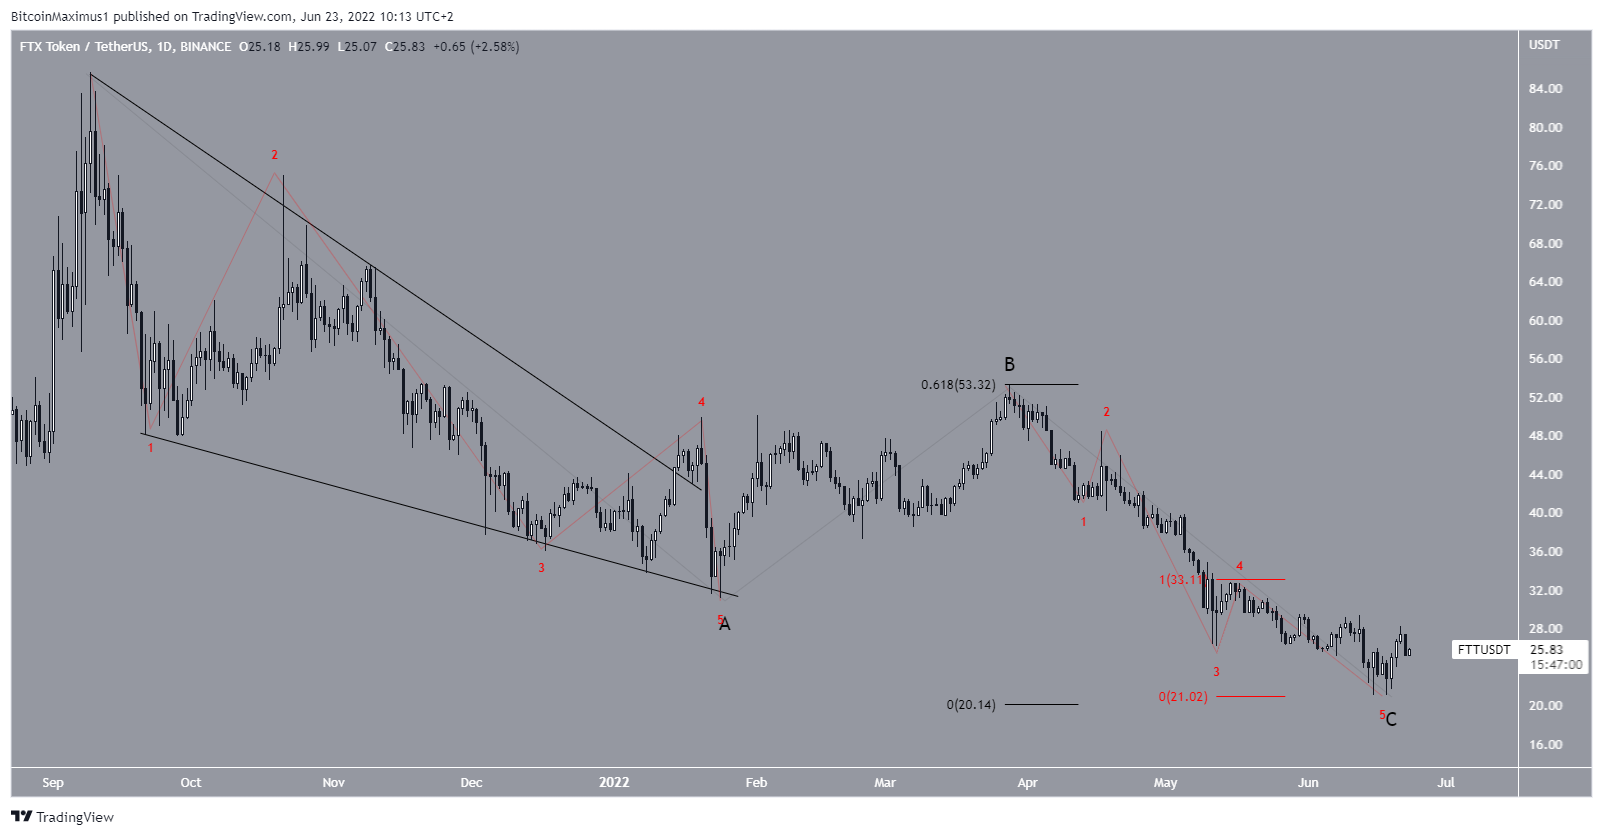
The wave count suggests that FTT has completed an A-B-C corrective structure (black) since the all-time high. The sub-wave count is given in red.
The aforementioned $21 low was created at a confluence of Fib support levels. It gave waves A:C a 1:0.618 ratio (black) and sub-waves one and five (red) an exactly 1:1 ratio.
As a result of this count and the bullish daily readings, it is possible that the price has bottomed.
For Be[in]Crypto’s previous bitcoin (BTC) analysis, click here


