
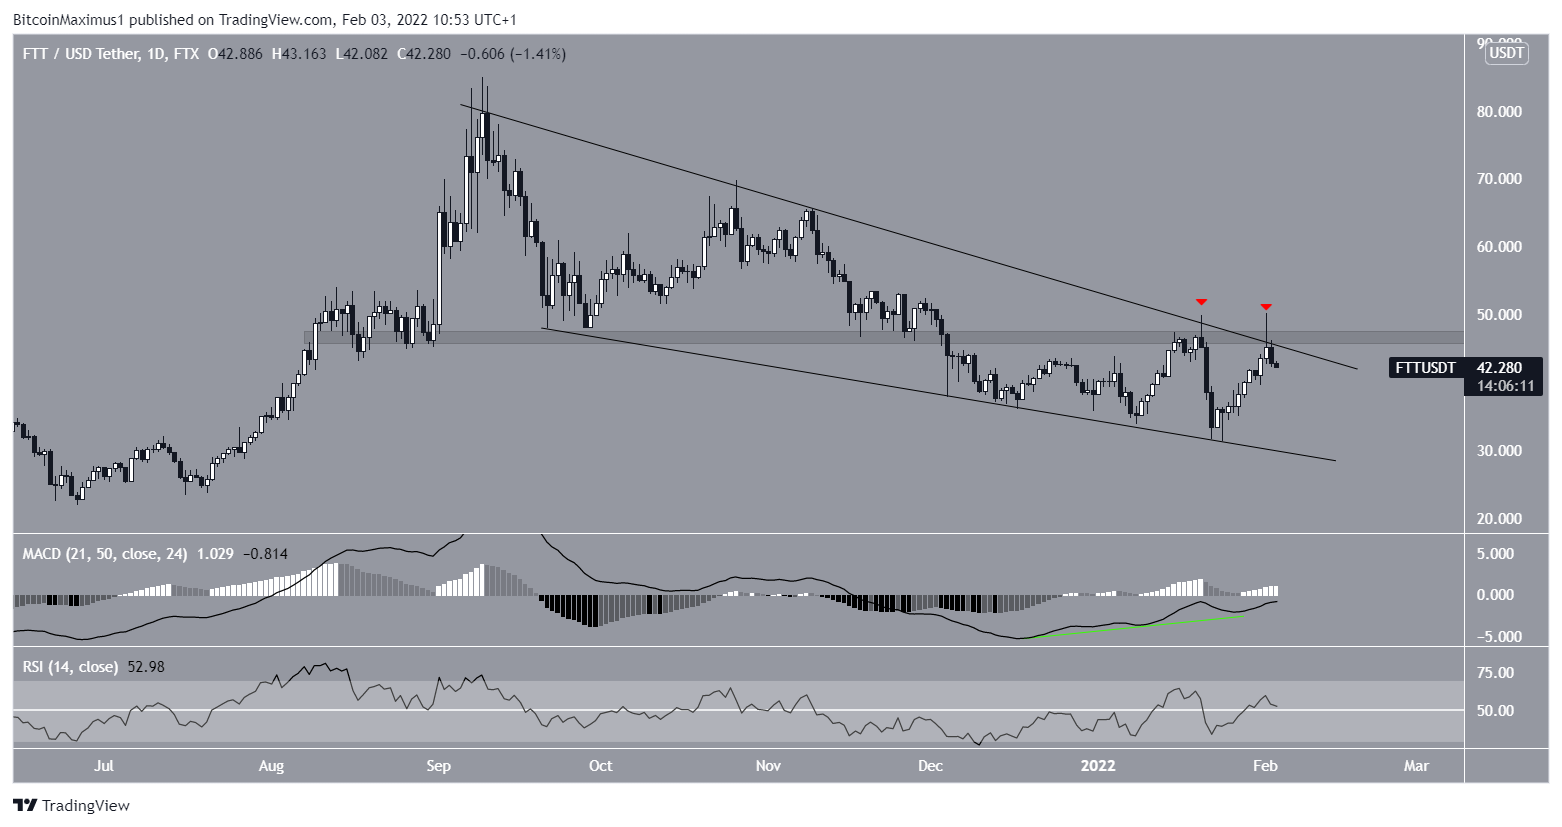
FTX Token (FTT) has made several unsuccessful attempts at breaking out from the current pattern, the most recent of which was done on Feb 1. Despite the rejection, technical indicators suggest that another breakout attempt will eventually occur.
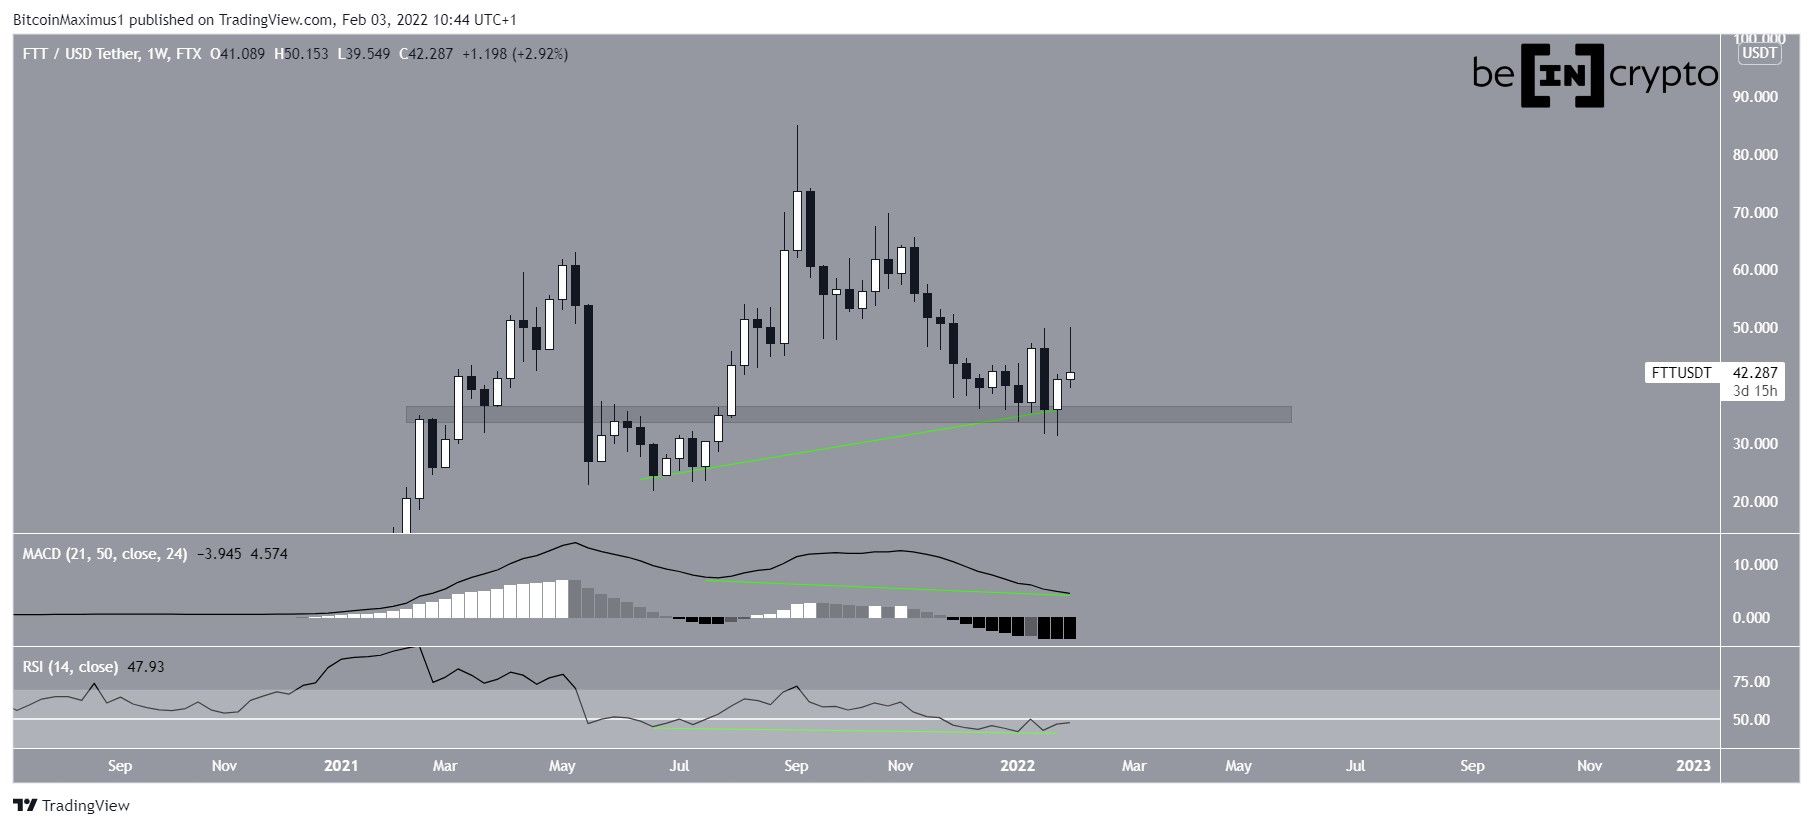
FTT has been falling since reaching an all-time high price of $85 on September 9. So far, the downward movement has led to a low of $31.69 on January 24. The token has been increasing since.
The ongoing bounce caused a validation of the $35.5 horizontal support area.
Technical indicators are providing mixed readings. While both the RSI and MACD are falling, the former is right at the 50 line and the latter is still positive.
Also, it is worth noting that there is a considerable hidden bullish divergence that has developed in both the RSI and MACD (green lines). This is a bullish development that often precedes significant upward movements.
Current pattern
The daily chart shows that FTT has been trading inside a descending wedge since the aforementioned all-time high price. More recently, the pattern rejected the token twice, on Jan. 20 and Feb. 1, respectively (red icons).
The rejections also coincided with the $46.50 hoirzontal resistance area. Until this area is reclaimed, the trend cannot be considered bullish.
However, technical indicators are showing bullish signs that support the possibility of a breakout. This is especially visible in the significant bullish divergence in the MACD and the fact that the RSI has already moved above 50.
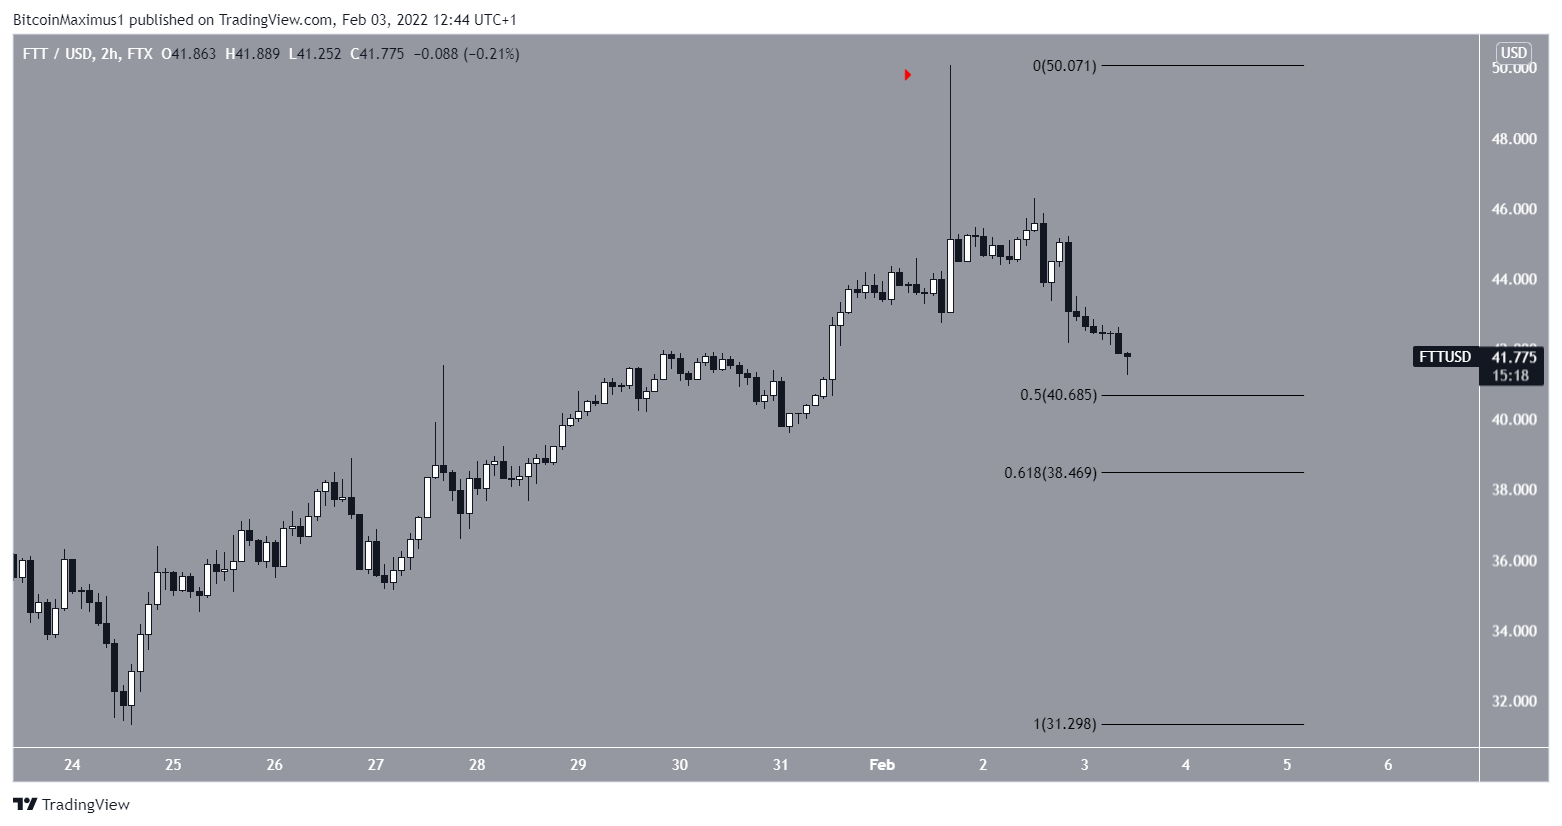
The two-hour chart shows that FTT has been falling since Feb 1, when it reached a high of $50.06.
Currently, it is approaching the main support area created between the 0.5-0.618 Fib retracement support levels at $38.47 and $40.69.
In order for the upward movement to continue, it would be crucial that FTT creates a higher low inside this region before continuing to move upwards.
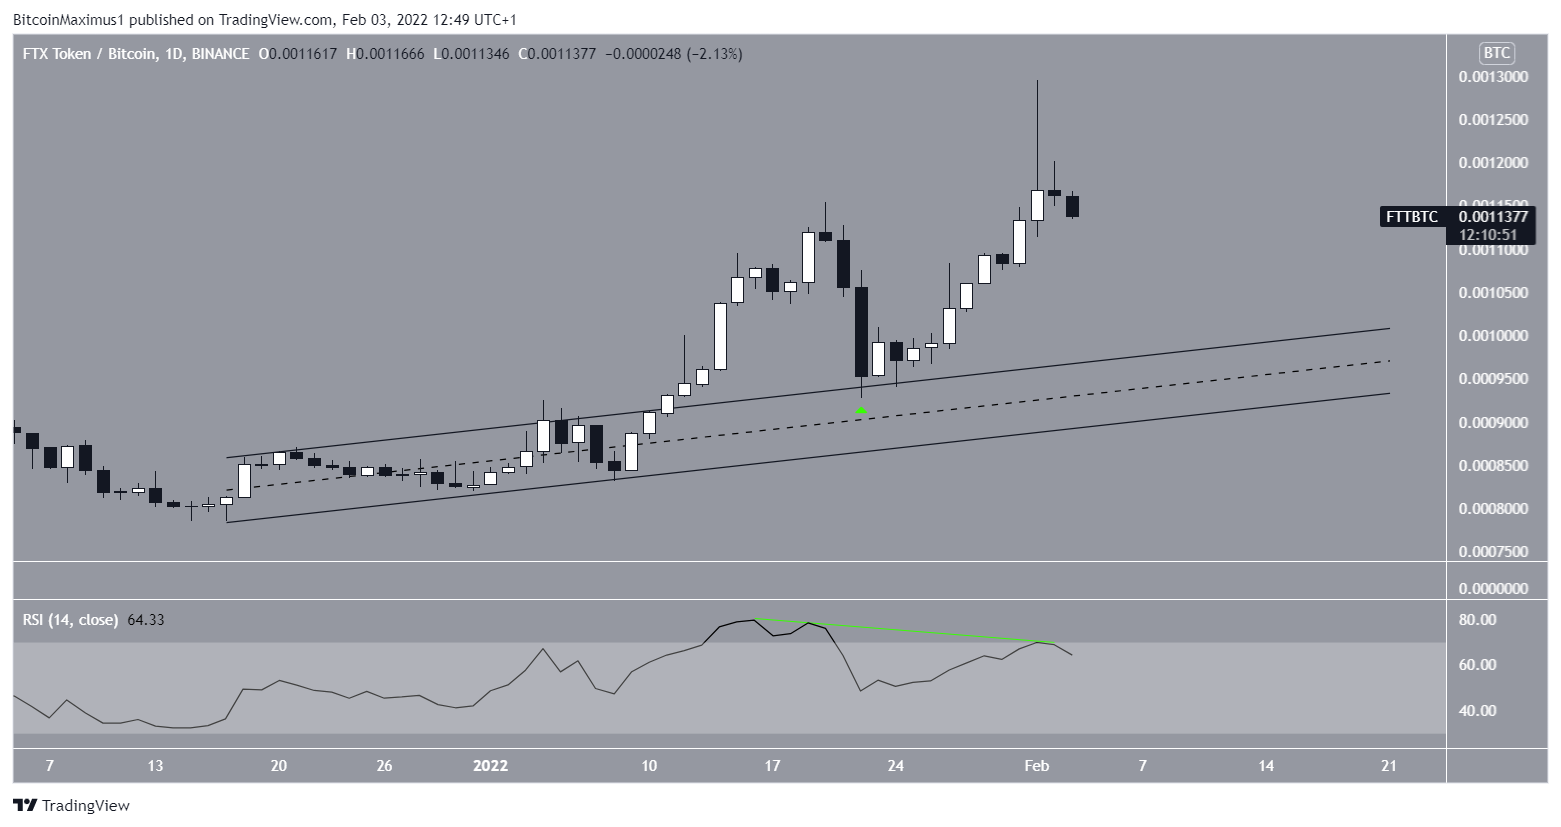
FTT/BTC
Cryptocurrency trader @CryptoNTez tweeted a chart of FTT/BTC, stating that the trend is bullish.
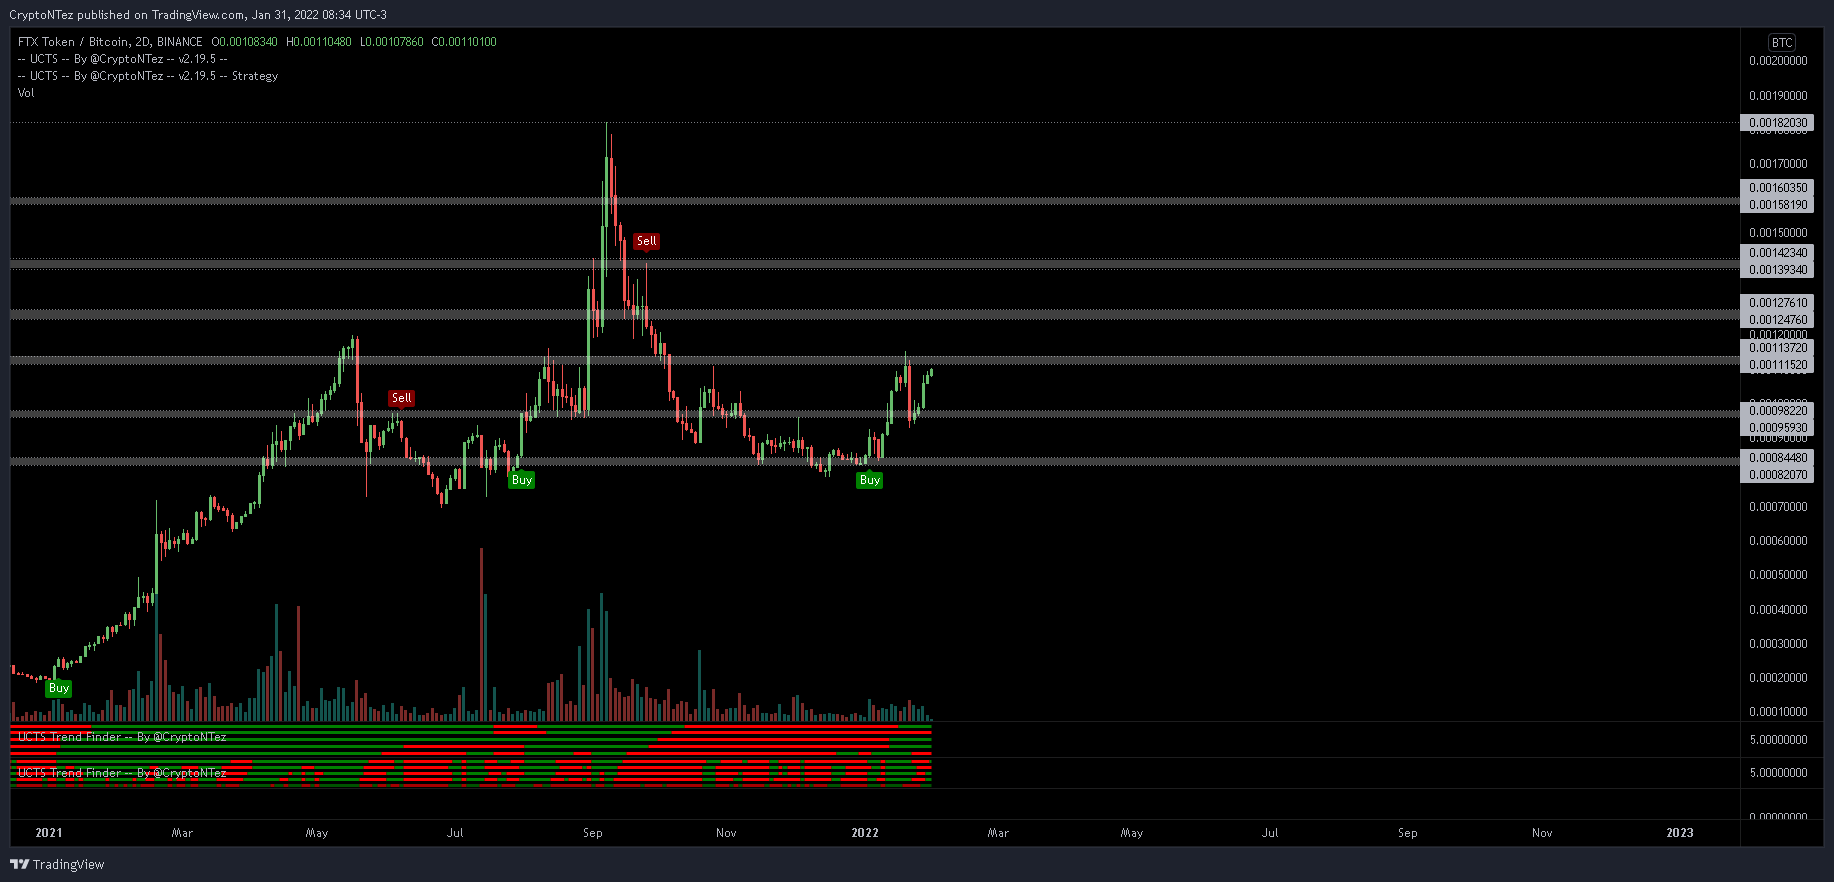
The FTX/BTC chart shows that the token has been increasing since breaking out from an ascending parallel channel and validating it as support on Jan. 22 (green icon). The ensuing upward movement led to a high of 0.00129 on Feb. 2.
However, there is a significant bearish divergence that has developed in the RSI. Therefore, it is possible that the token will fall in the short-term, potentially validating the channel once more before eventually resuming its upward movement.
For BeInCrypto’s latest Bitcoin (BTC) analysis, click here.
What do you think about this subject? Write to us and tell us!
