
In this detailed analysis, we explore the latest Floki Inu (FLOKI) price prediction, focusing on critical support and resistance levels.
Discover how current bearish trends and potential reversal signals could shape the future price movements of Floki Inu.
In-Depth Technical Analysis of Floki Inu
Daily Chart Analysis
On the daily chart, Floki Inu experienced significant volatility after reaching an all-time high of $0.00035. The subsequent 54% decline from June 5 to the present has been influenced by several key technical factors.
In our previous analysis, we highlighted that Floki’s price might drop following breakouts of key support levels.
Read More: What Are Meme Coins?
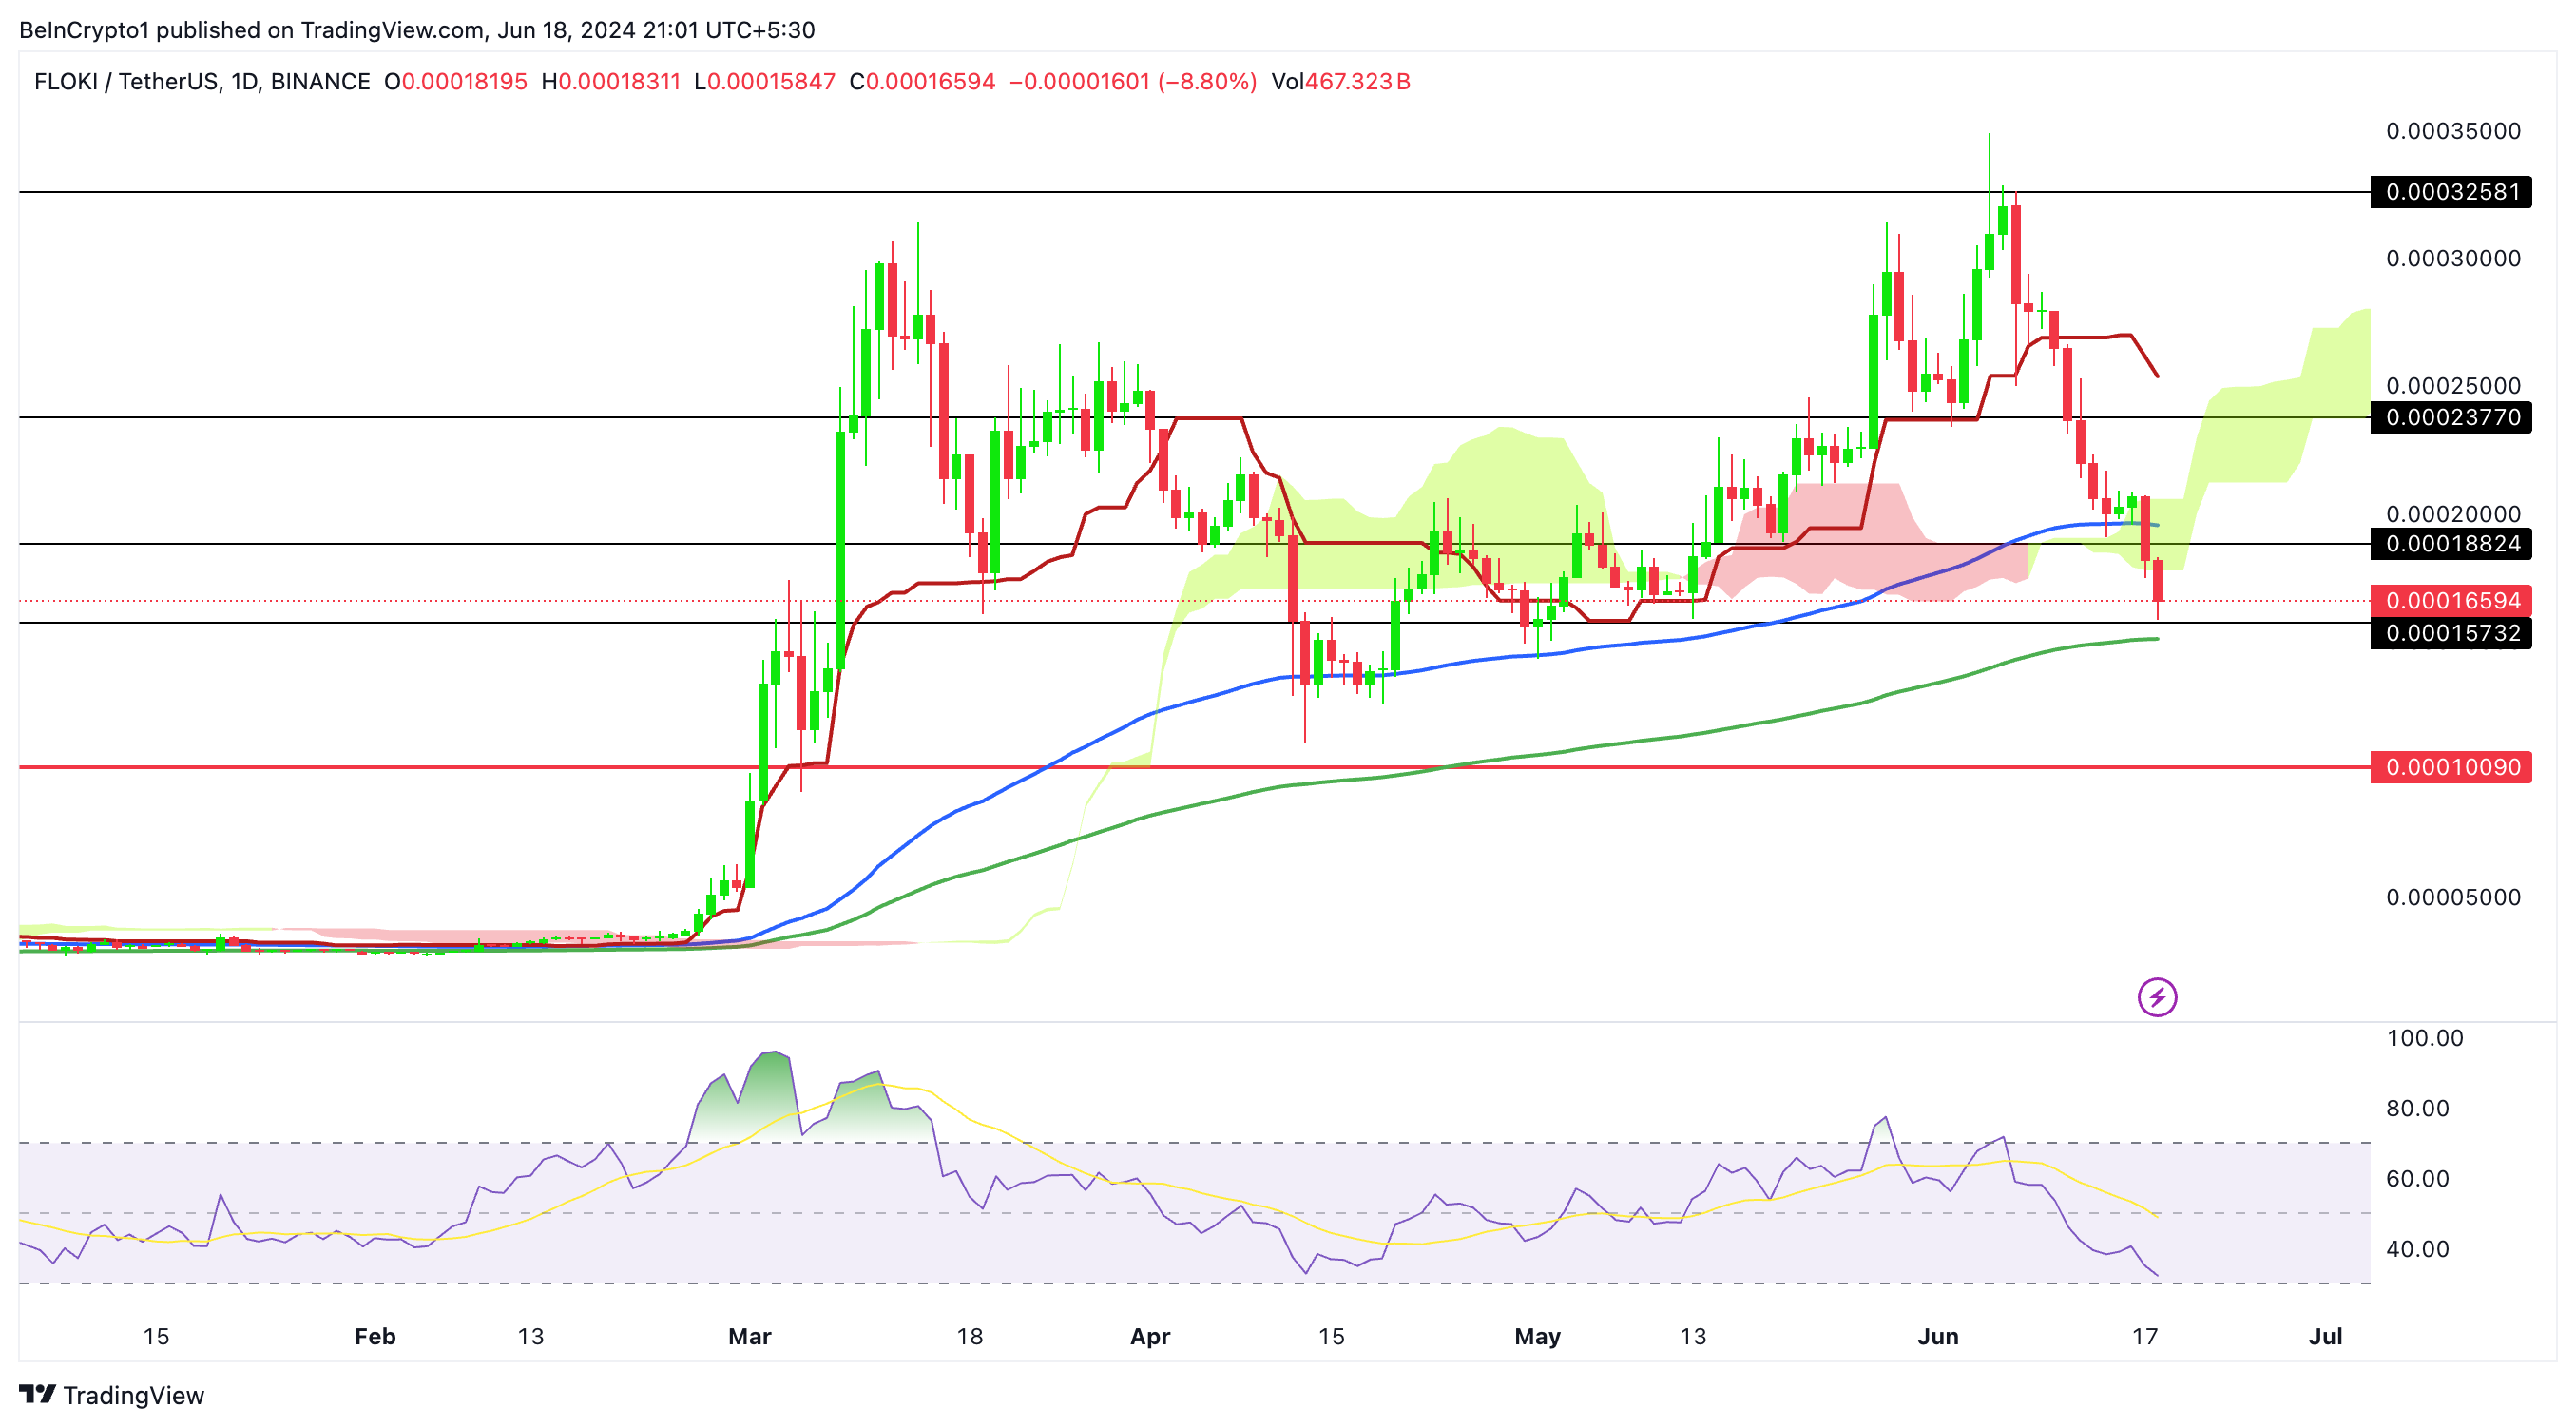
The dark red baseline of the Ichimoku Cloud served as a crucial support level during the rally to $0.00035. Well, FLOKI fell below this baseline on June 7, signaling a shift in market sentiment and acting as a catalyst for further declines.
The price is currently testing the 200 EMA (green), a significant support level on the daily chart. Historically, the 200 EMA is considered a critical long-term indicator. A breach below this level could lead to increased volatility and a further downside move towards $0.00015.
The immediate support levels to watch are $0.000165 and $0.000157. Should these levels fail to hold, the next critical support is at $0.00010. On the resistance side, FLOKI must reclaim the $0.000188 level to initiate any significant bullish reversal.
4-Hour Chart Analysis
The 4-hour chart provides a more granular view of FLOKI’s recent price movements, highlighting key technical patterns and potential reversal points.
Read More: 7 Hot Meme Coins and Altcoins that are Trending in 2024
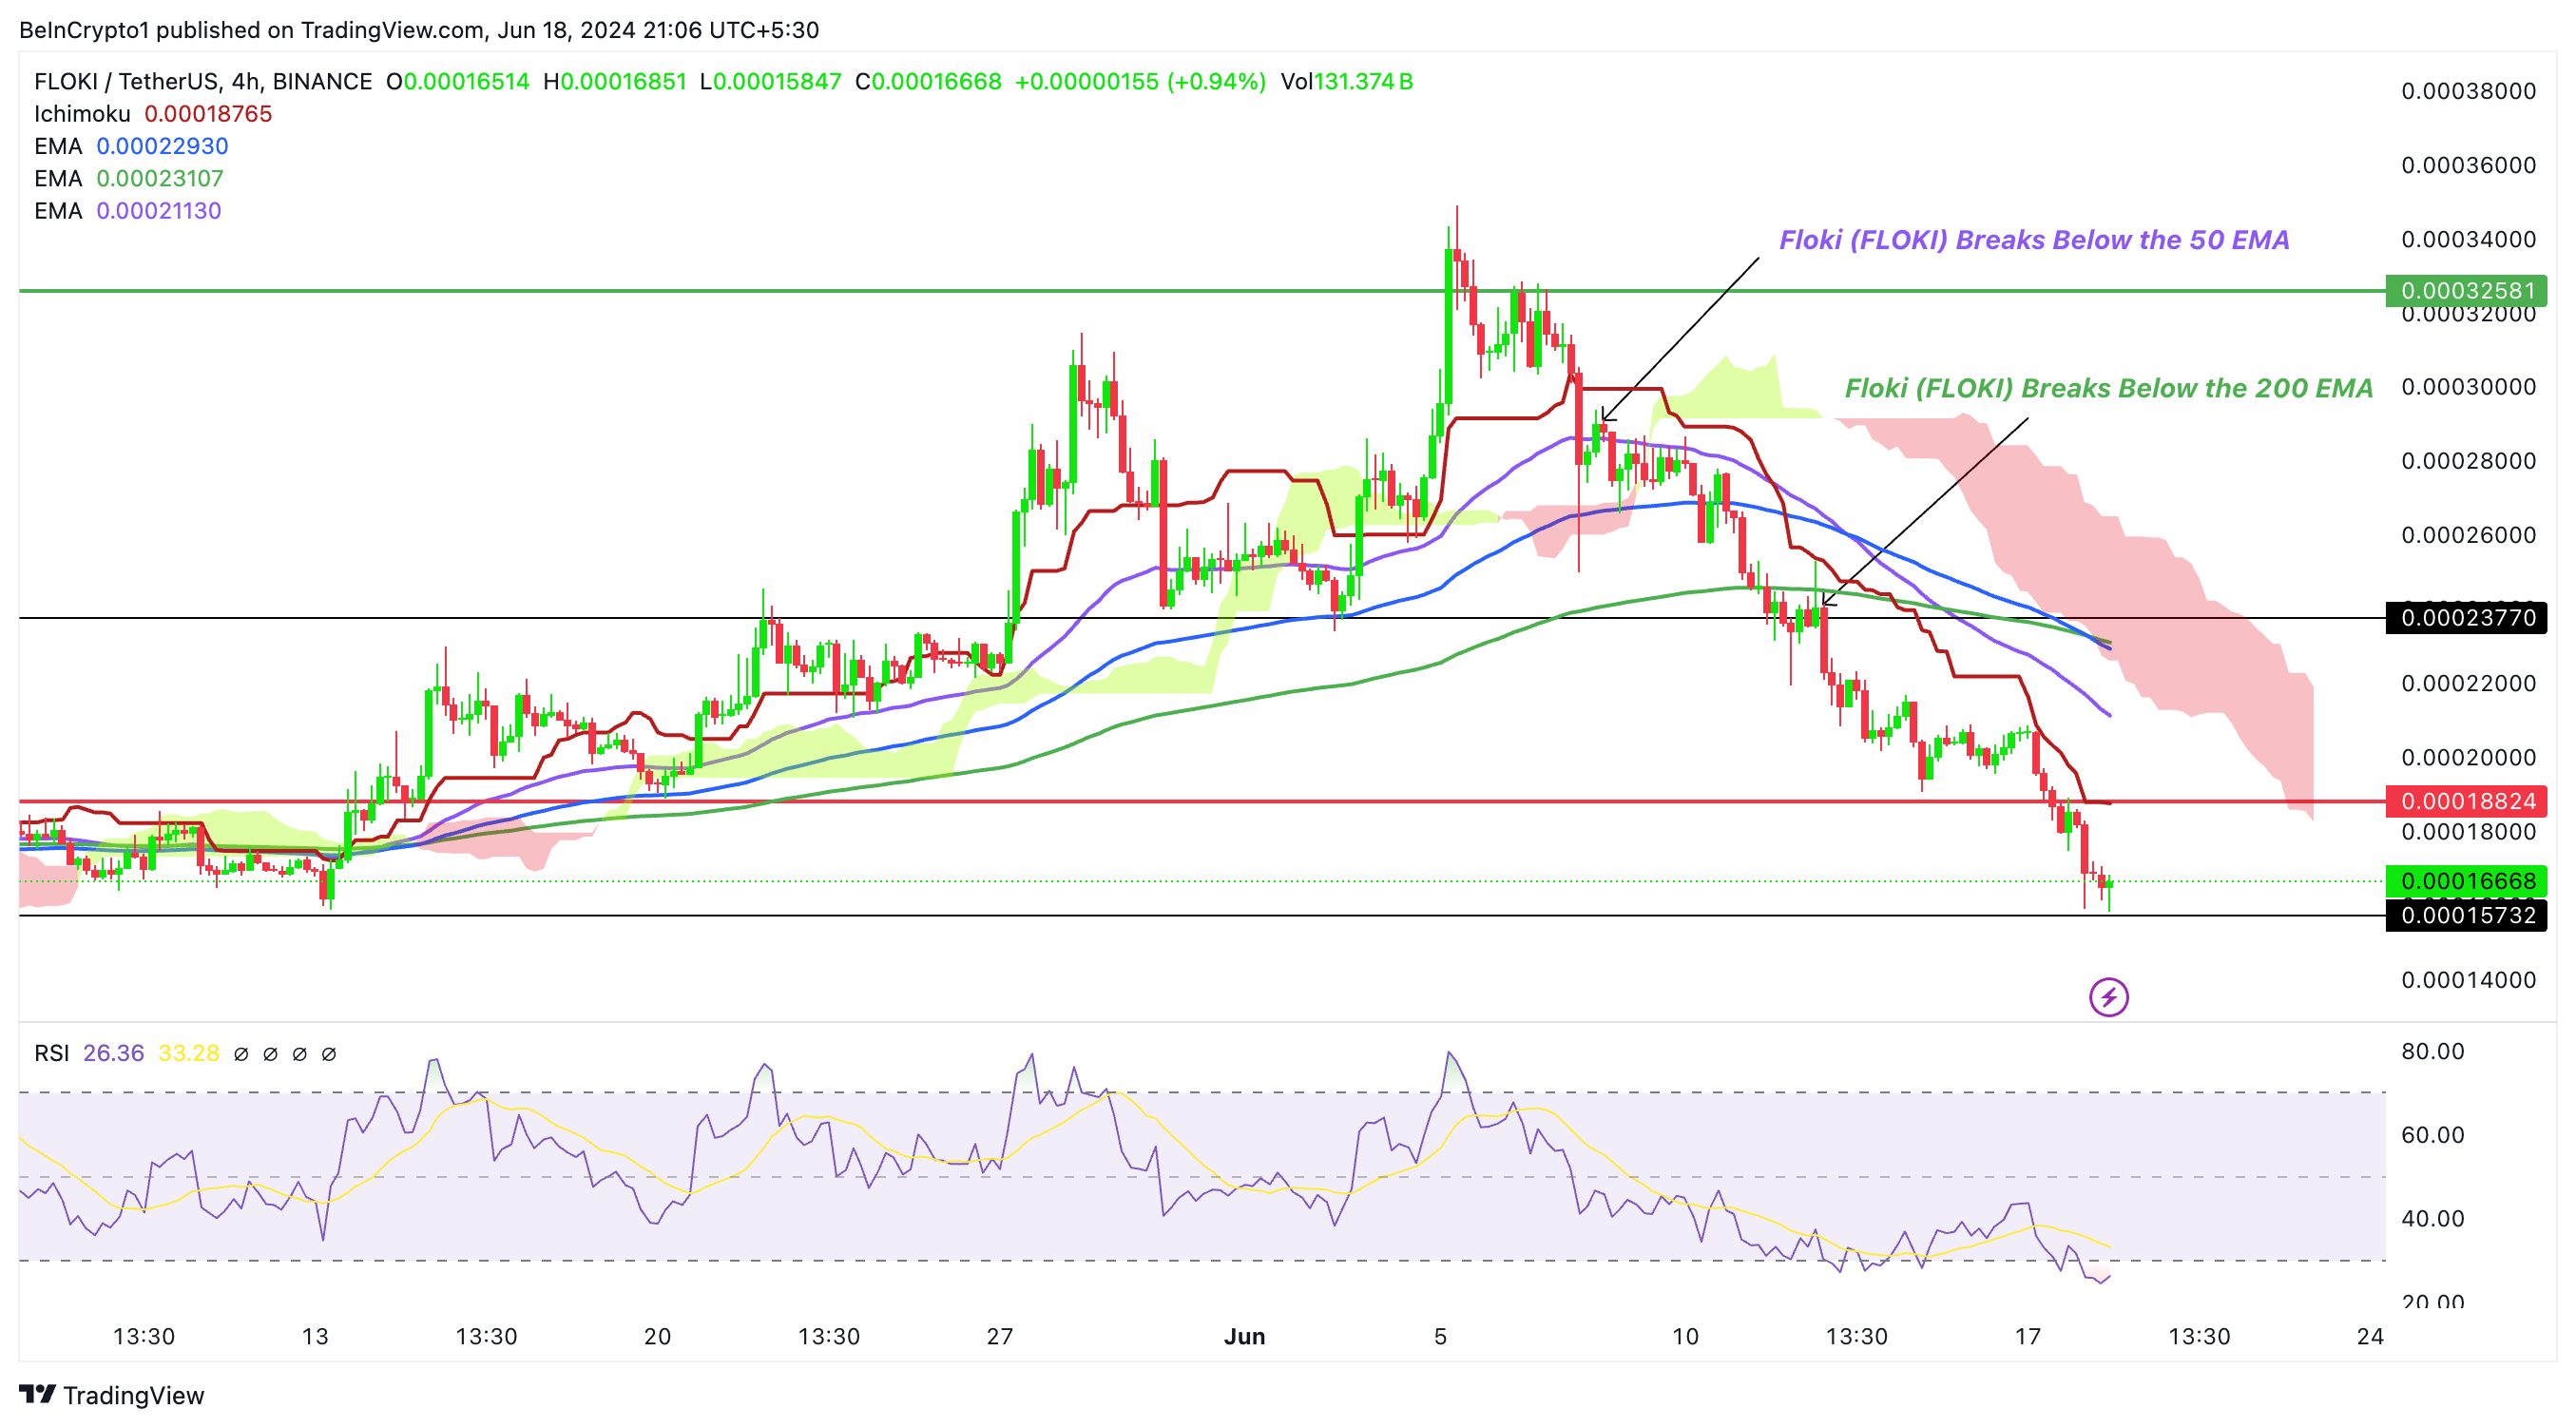
Previously, when the price was trading at $0.00032, it managed to break below the 50 EMA, a move that was anticipated in our prior analysis. This break was a major bearish signal, further confirmed by subsequent price action.
The red baseline of the 4-hour Ichimoku Cloud is now acting as a formidable resistance level. The price tested this line but failed to break above it, leading to continued downward pressure.
The price has broken below the 50, 100, and 200 EMAs on the 4-hour chart, reinforcing the bearish outlook. The Ichimoku Cloud on the 4-hour chart also shows the price trading below it, indicating strong bearish momentum.
On both the daily and 4-hour charts, the RSI is hovering in the oversold territory, suggesting that the selling pressure may be overextended. However, an RSI in oversold territory is not a definitive reversal signal; it requires confirmation from other indicators.
Strategic Recommendations
The breach of critical support levels and moving averages, coupled with the price being below the Ichimoku Cloud on both daily and 4-hour charts, suggests a bearish market sentiment. Social media and trader forums reflect a cautious outlook, with many traders adopting a wait-and-see approach.
For any meaningful bullish reversal, FLOKI needs to break above $0.000188. This level represents the flattening baseline of the 4-hour Ichimoku Cloud. A sustained break above this level could shift market sentiment and trigger a rally towards the upper resistance levels at $0.000237 and beyond.
Short-term traders should consider tightening stop-loss levels to mitigate risks. If the price finds support around the current levels, watch for potential bounce-back opportunities.
Long-term investors should evaluate the broader market context and macroeconomic factors before significantly changing their holdings. Given the current volatility, it might be prudent to wait for clear signs of a trend reversal before increasing exposure without increasing the risk.
