
BeInCrypto breaks down the five biggest altcoin movers and shakers from the previous week. Will their momentum continue?
The five altcoins that increased the most last week were:
- Avalanche (AVAX): 157.1%
- Audius (AUDIO): 67.5%
- NEAR Protocol (NEAR): 61.1%
- Fantom (FTM): 48.9%
- Areware (AR): 40.1%
AVAX
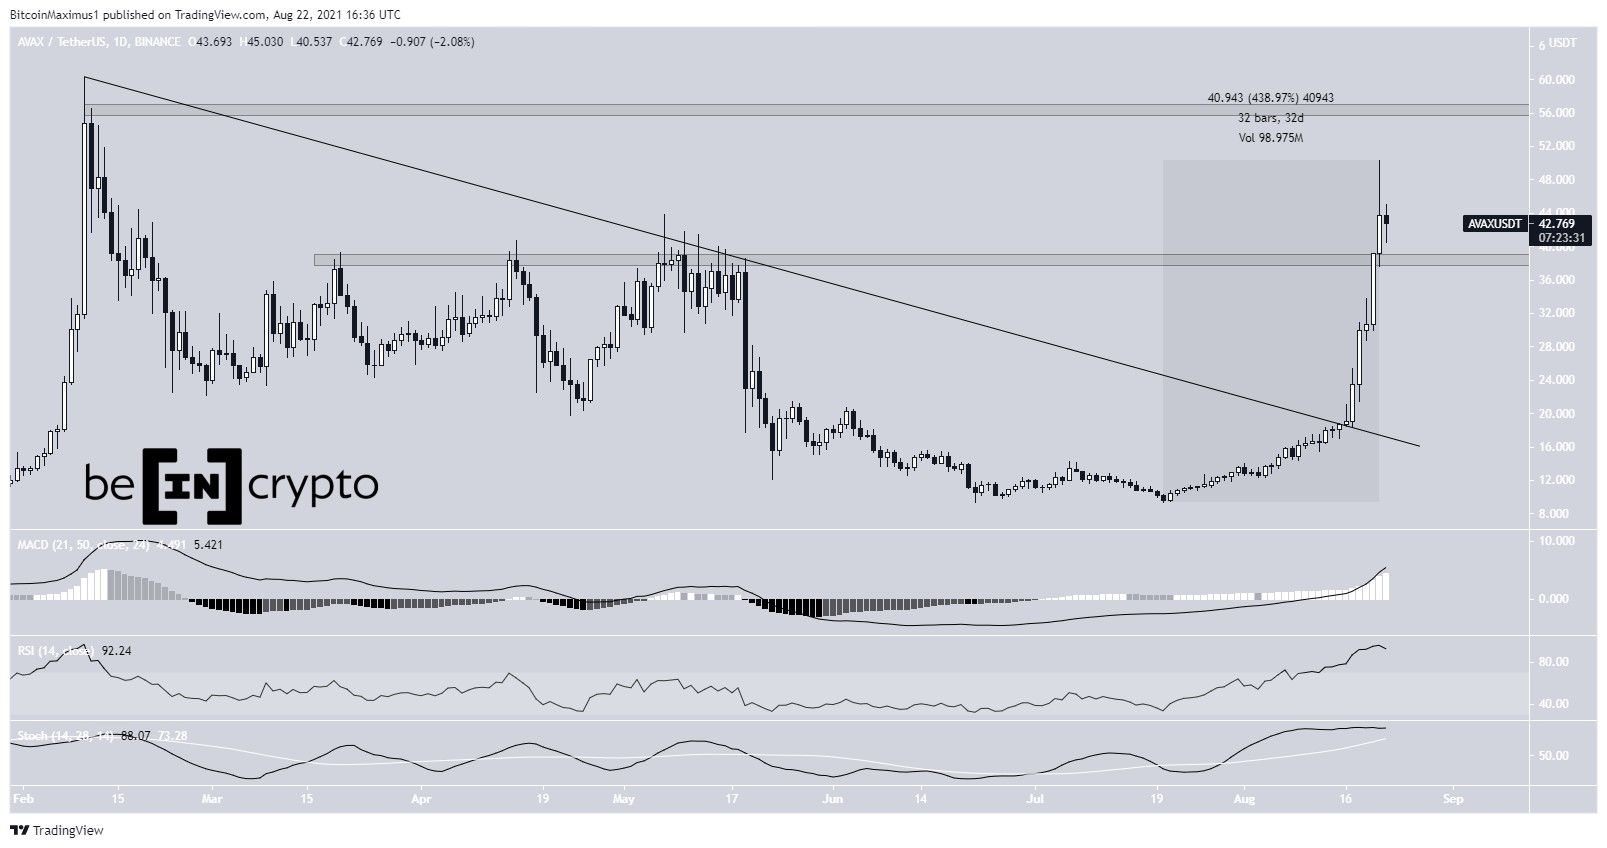
AVAX has been increasing at a rapid pace since July 20. In a span of 32 days, it has increased by roughly 440%. This led to a high of $50.27 on Aug 21.
Throughout the upward move, AVAX broke out from a descending resistance line on Aug 16 and then reclaimed the $38 horizontal resistance area on Aug 21. The $38 area is now expected to act as support.
Technical indicators do not show any signs of weakness, despite the overbought RSI. The next closest resistance area is at $56.50, close to the all-time high price.
It’s possible that AVAX will trade in a range between $38-$56.50 before trying to reach a new high.
AUDIO
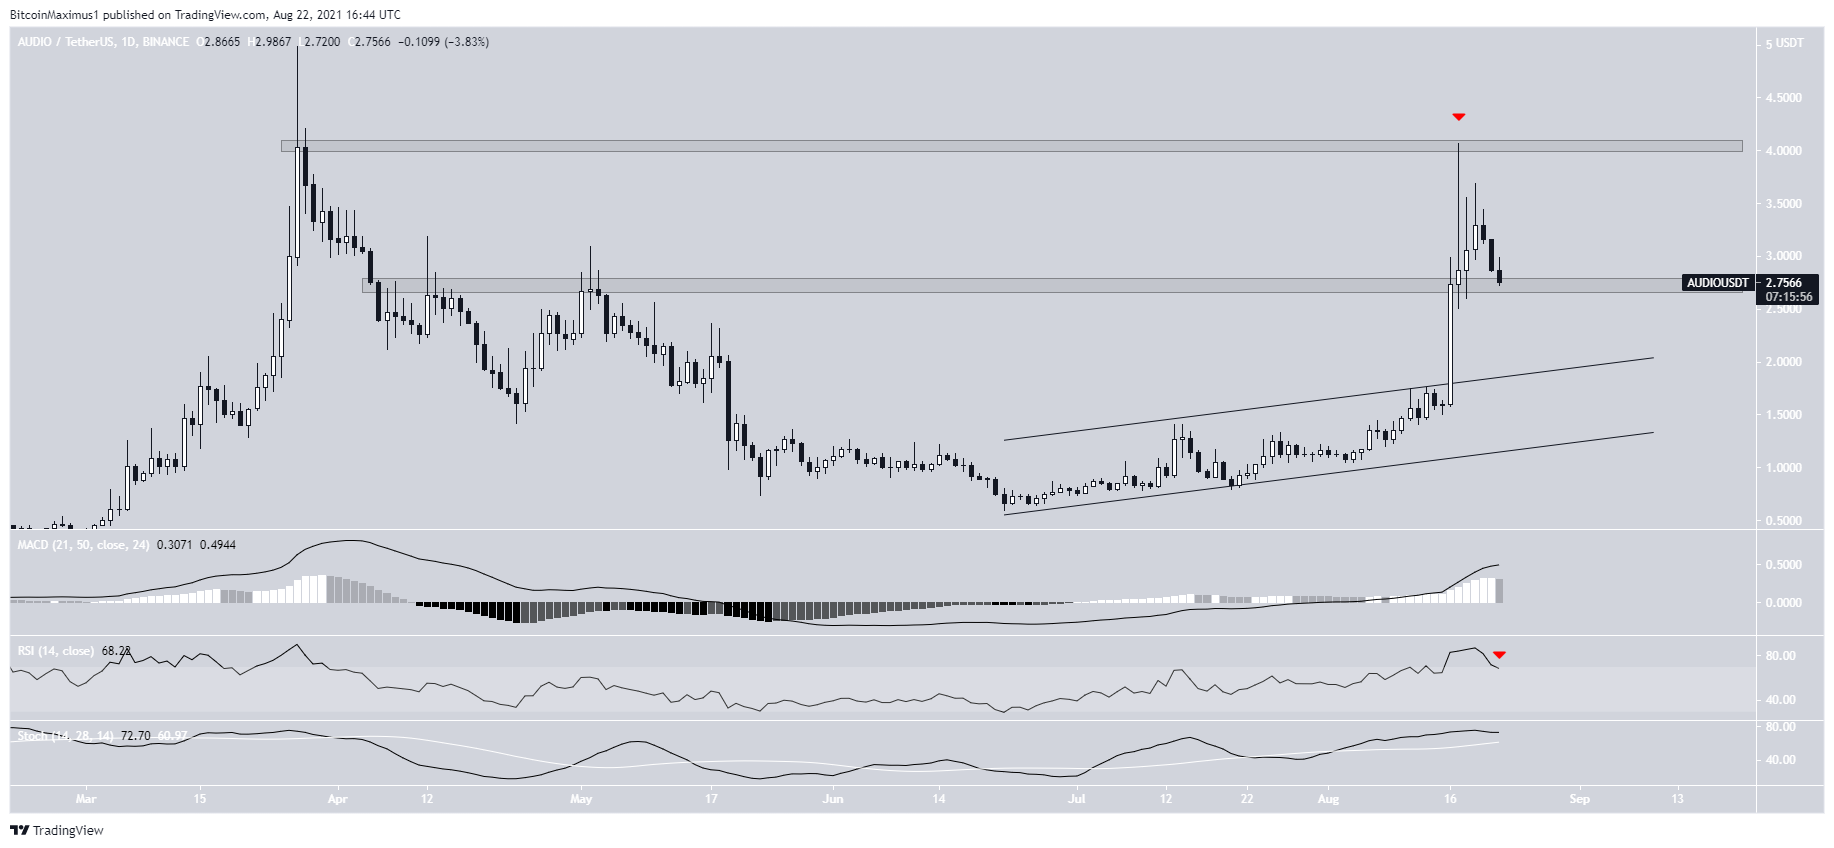
AUDIO had been increasing inside an ascending parallel channel since June 22. On Aug 16, it broke out from the channel and proceeded to reach a high of $4.07 the next day. However, the higher prices could not be sustained and it created a long upper wick (red icon) and has been moving downwards since.
The rejection and drop validated the $4.05 horizontal area as resistance.
The main support area is found at $2.70. This is a horizontal level that previously acted as resistance.
Unlike AVAX, there are signs of weakness in technical indicators, such as the potential RSI cross below 70 and lower momentum bar in the MACD.
Therefore, if the $2.70 area does not hold, it’s possible that AUDIO will return to $2 and validate the resistance line of the channel as support before moving upwards again.
NEAR
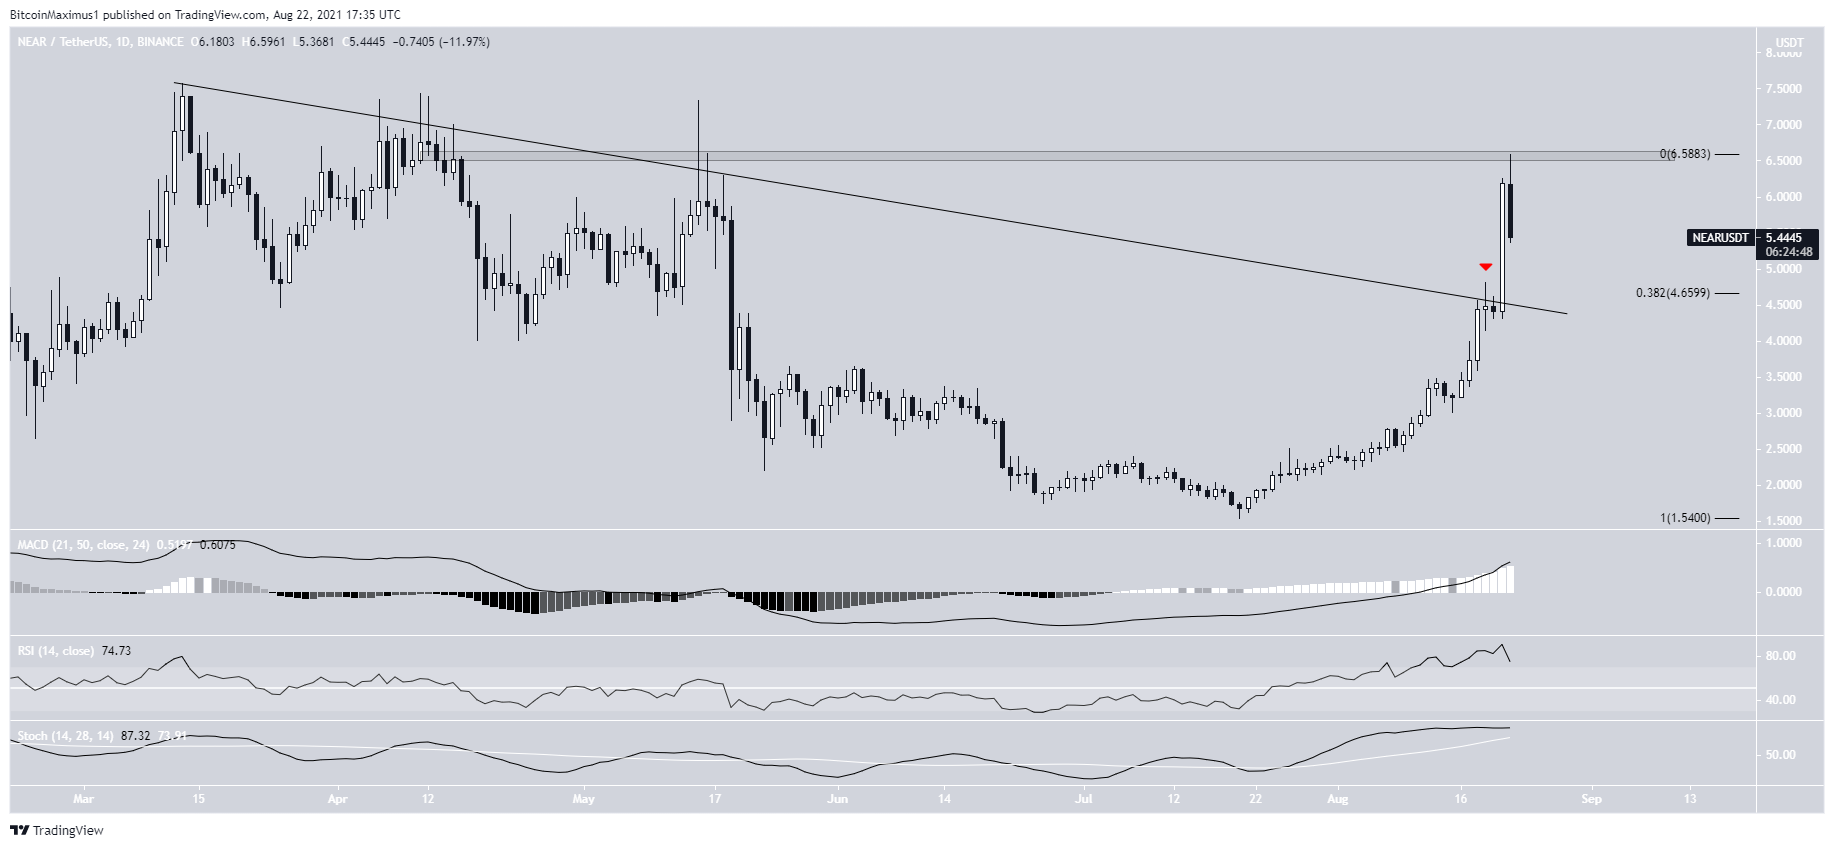
NEAR has been moving upwards since July 20. On Aug 19, it reached a local high of $4.82 but was rejected for the fifth time by a descending resistance line that had been in place since the March 13 all-time high.
However, NEAR broke out two days later and proceeded to reach a high of $6.59 on Aug 22. This validated the $6.50 area as resistance. A breakout above would likely lead to a new all-time high price.
Technical indicators in the daily time frame are bullish, supporting the possibility of an eventual breakout.
NEAR is currently trying to find support after the parabolic increase. The closest support area is found at $4.66. This target is the 0.382 Fib retracement support level.
FTM
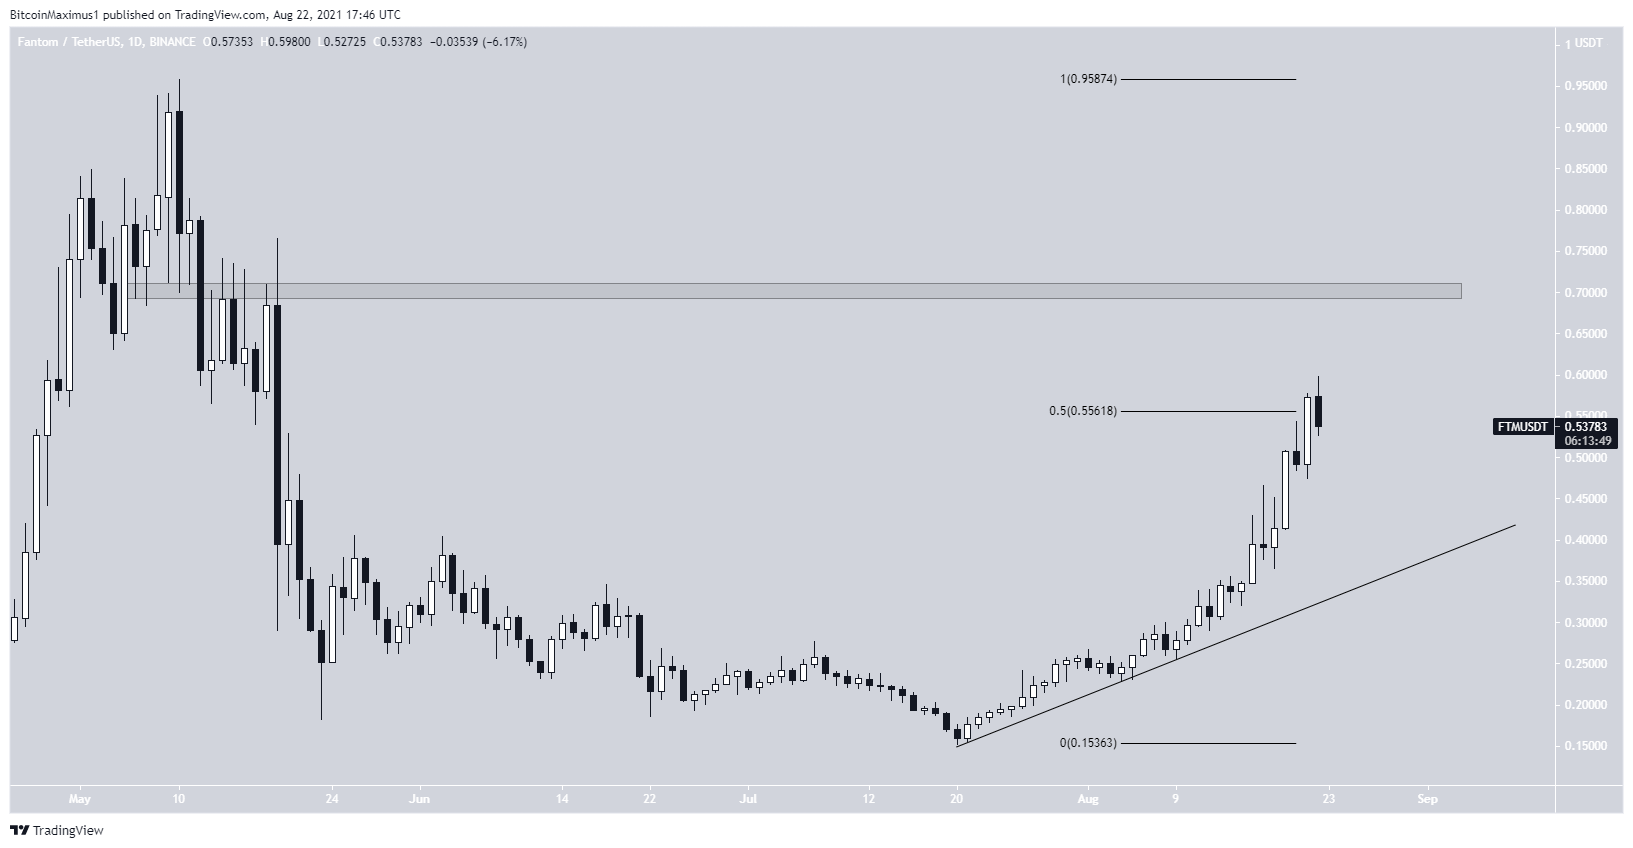
FTM has been increasing alongside an ascending support line since reaching a low on July 20. The rate of increase began to accelerate on Aug 16.
On Aug 22, FTM managed to reach a high of $0.598. However, it appeared to have gotten rejected by the 0.5 Fib retracement resistance level and failed to reach a close above it. If it can start closing above this resistance, its next target would be found at $0.70.
Conversely, the previously outlined support line is located at $0.46.
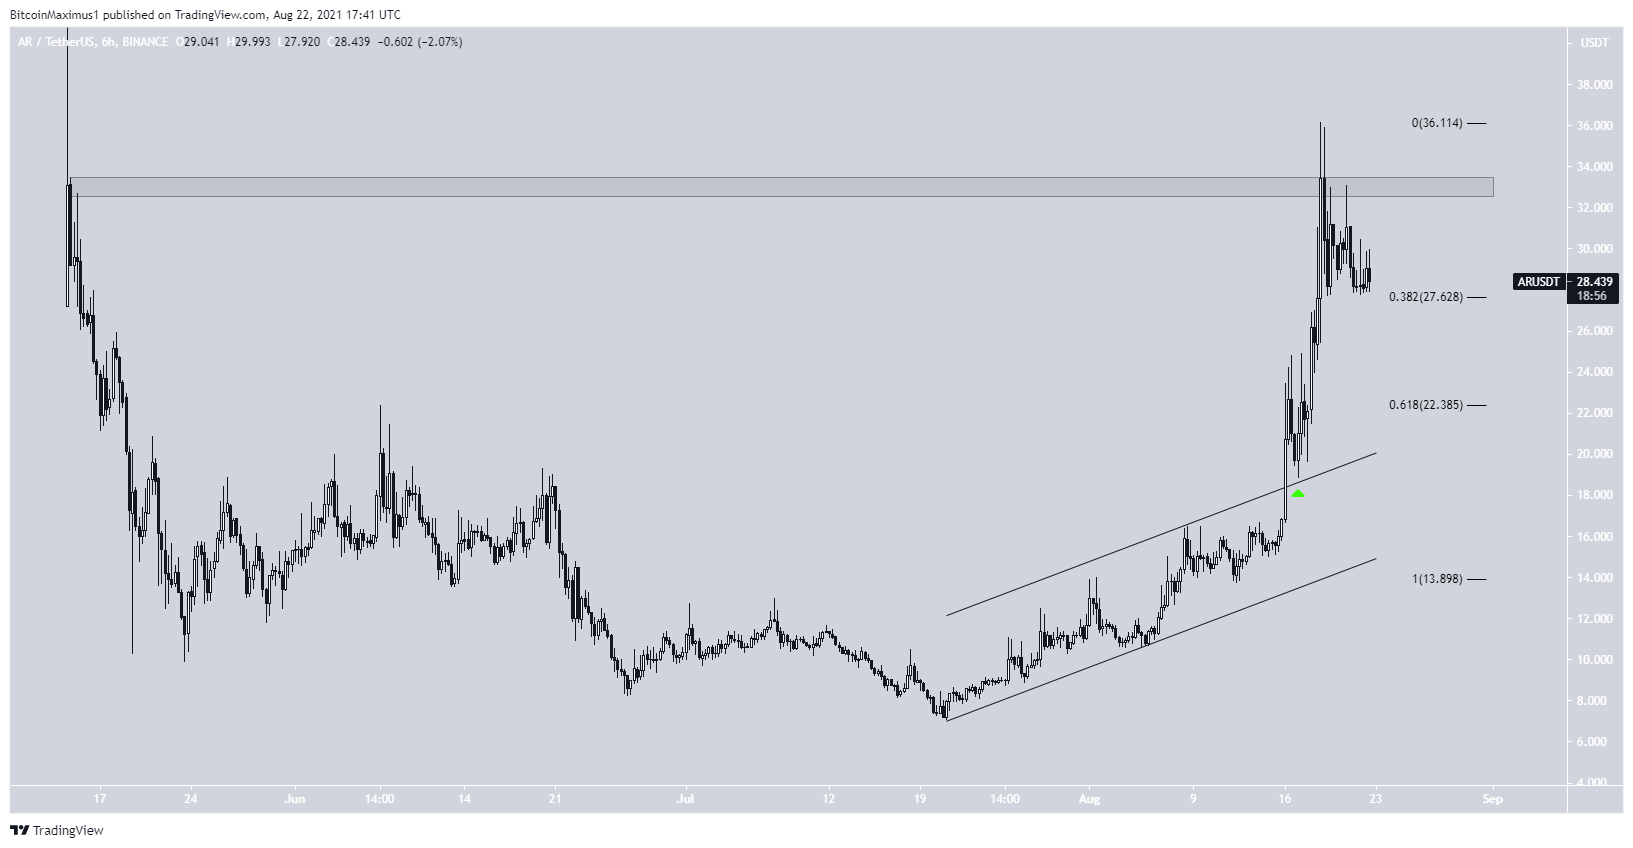
AR
AR had been increasing inside an ascending parallel channel since July 20. It managed to break out on Aug 15. After validating the channel as support three days later (green icon), AR began to accelerate.
This led to a high of $36.16 on Aug 18. However, the higher prices could not be sustained and AR decreased shortly after, validating the $33 area as resistance.
Currently, AR is trying to find support above the 0.382 Fib retracement support level at $27.60. The next support is found at $22.40.
For BeInCrypto’s latest Bitcoin (BTC) analysis, click here.
