


Filecoin (FIL) broke out from a descending resistance line on June 18, but accelerated its rate of increase on July 30.
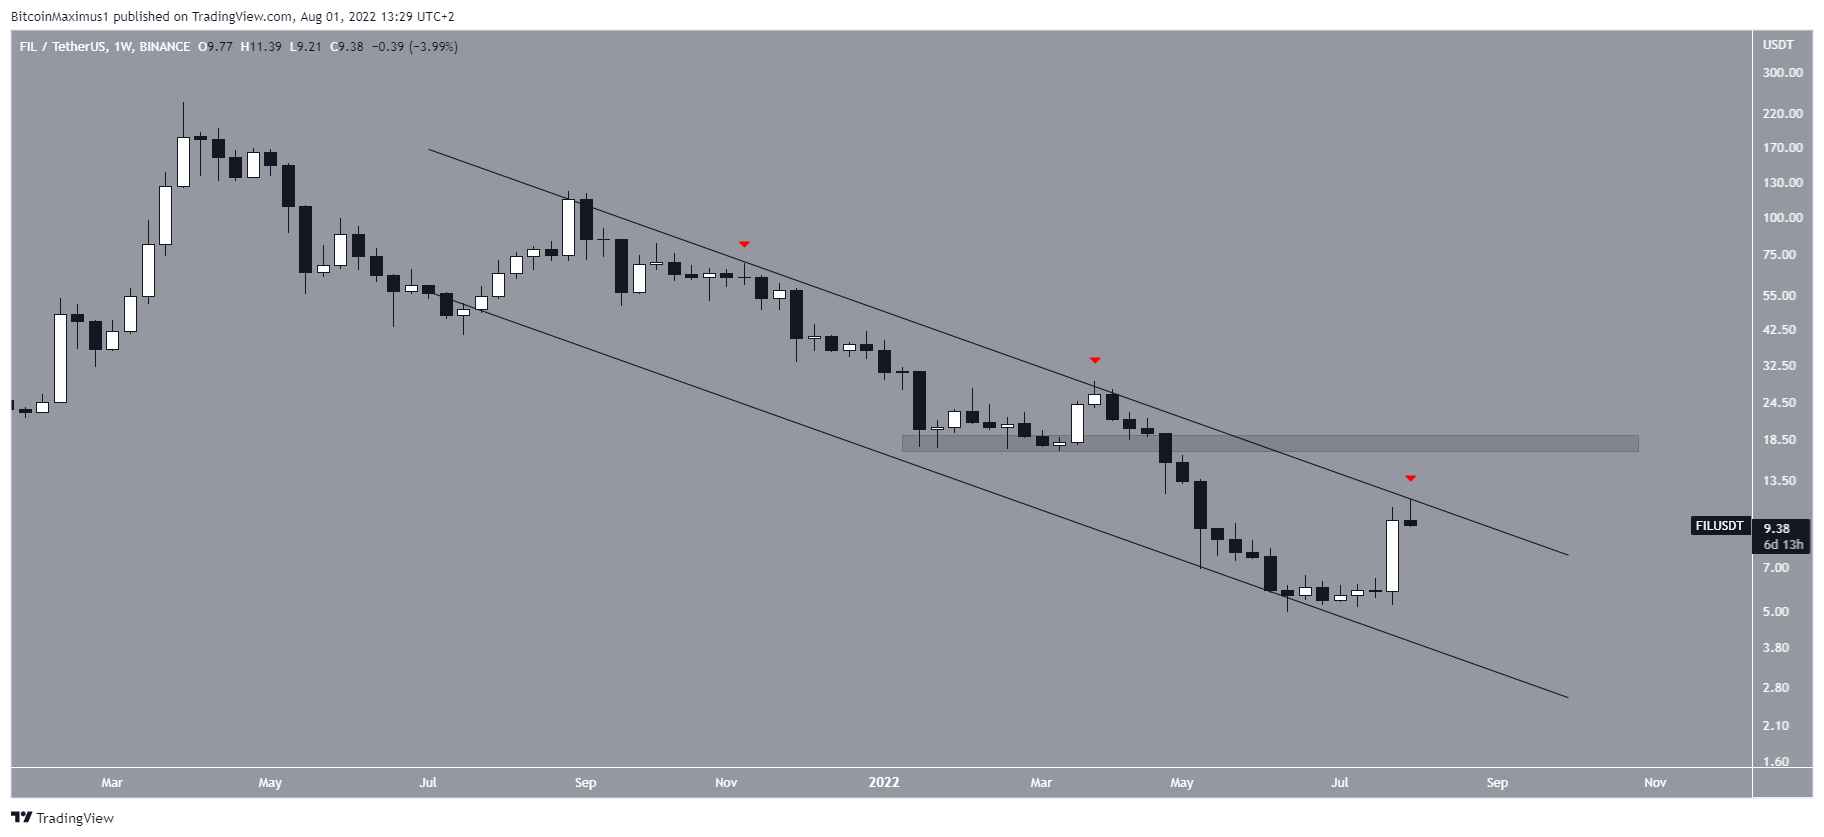
FIL has been falling since reaching an all-time high price of $238 in March 2021. Since July of that same year, the movement has been contained inside the confines of a descending parallel channel.
Such channels usually contain corrective structures, meaning that an eventual breakout from it would be likely.
Moreover, the price has already made three attempts (red icons) at breaking out from the resistance line, making it weaker in the process.
Cryptocurrency trader @ZAYKCharts tweeted a chart of FIL, stating that a breakout from the current descending parallel channel could cause the price to increase towards $30.
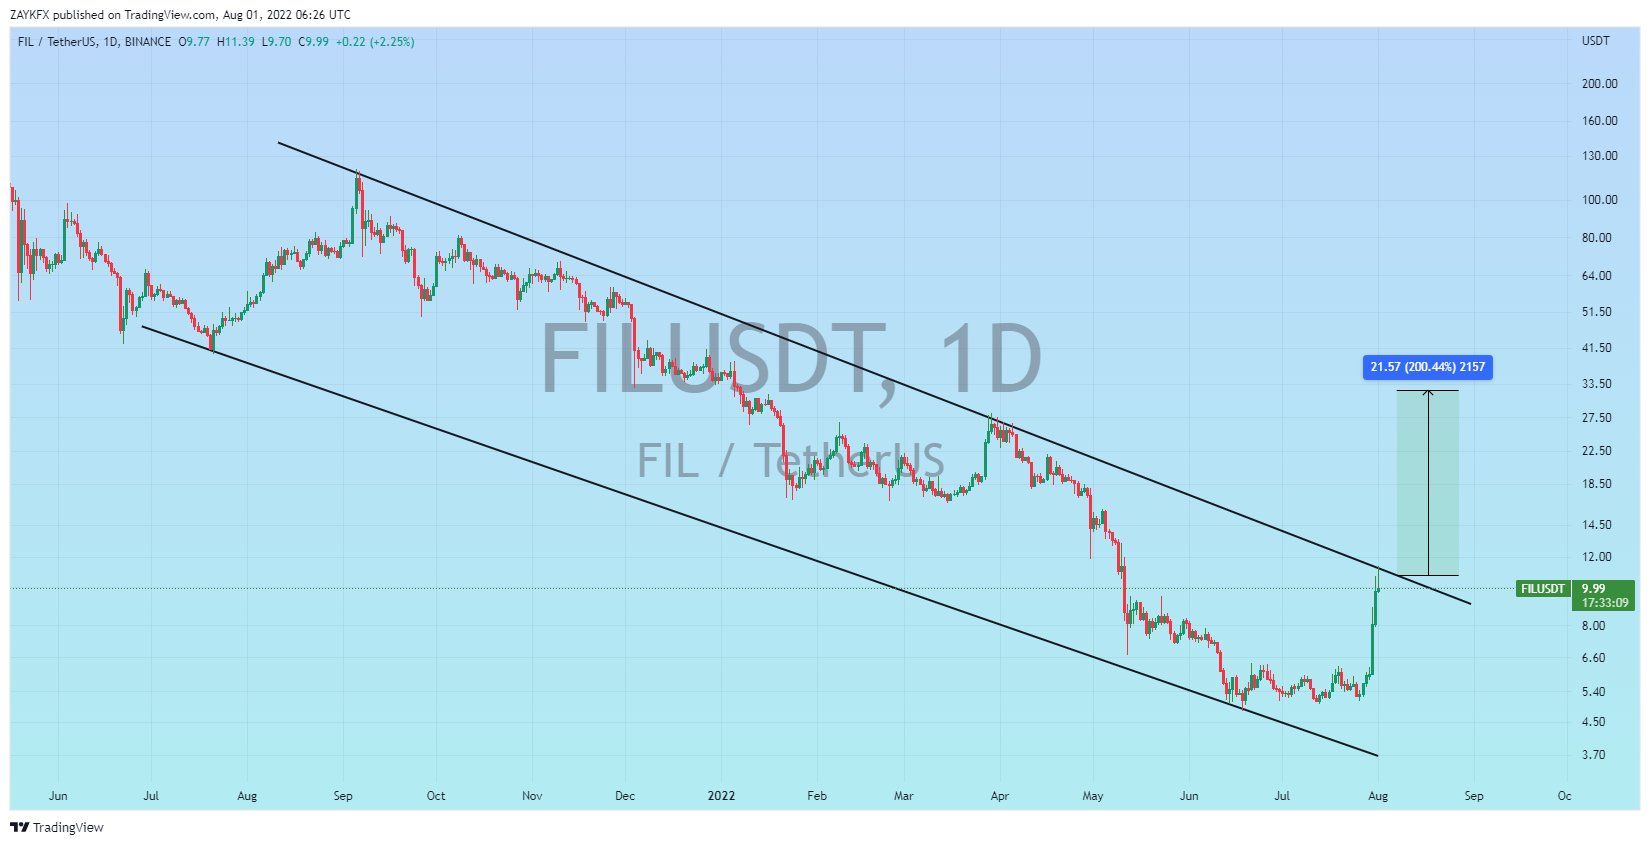
As outlined above, the first minor resistance area would be at $17, prior to the next resistance closer to $30.
FIL breaks out
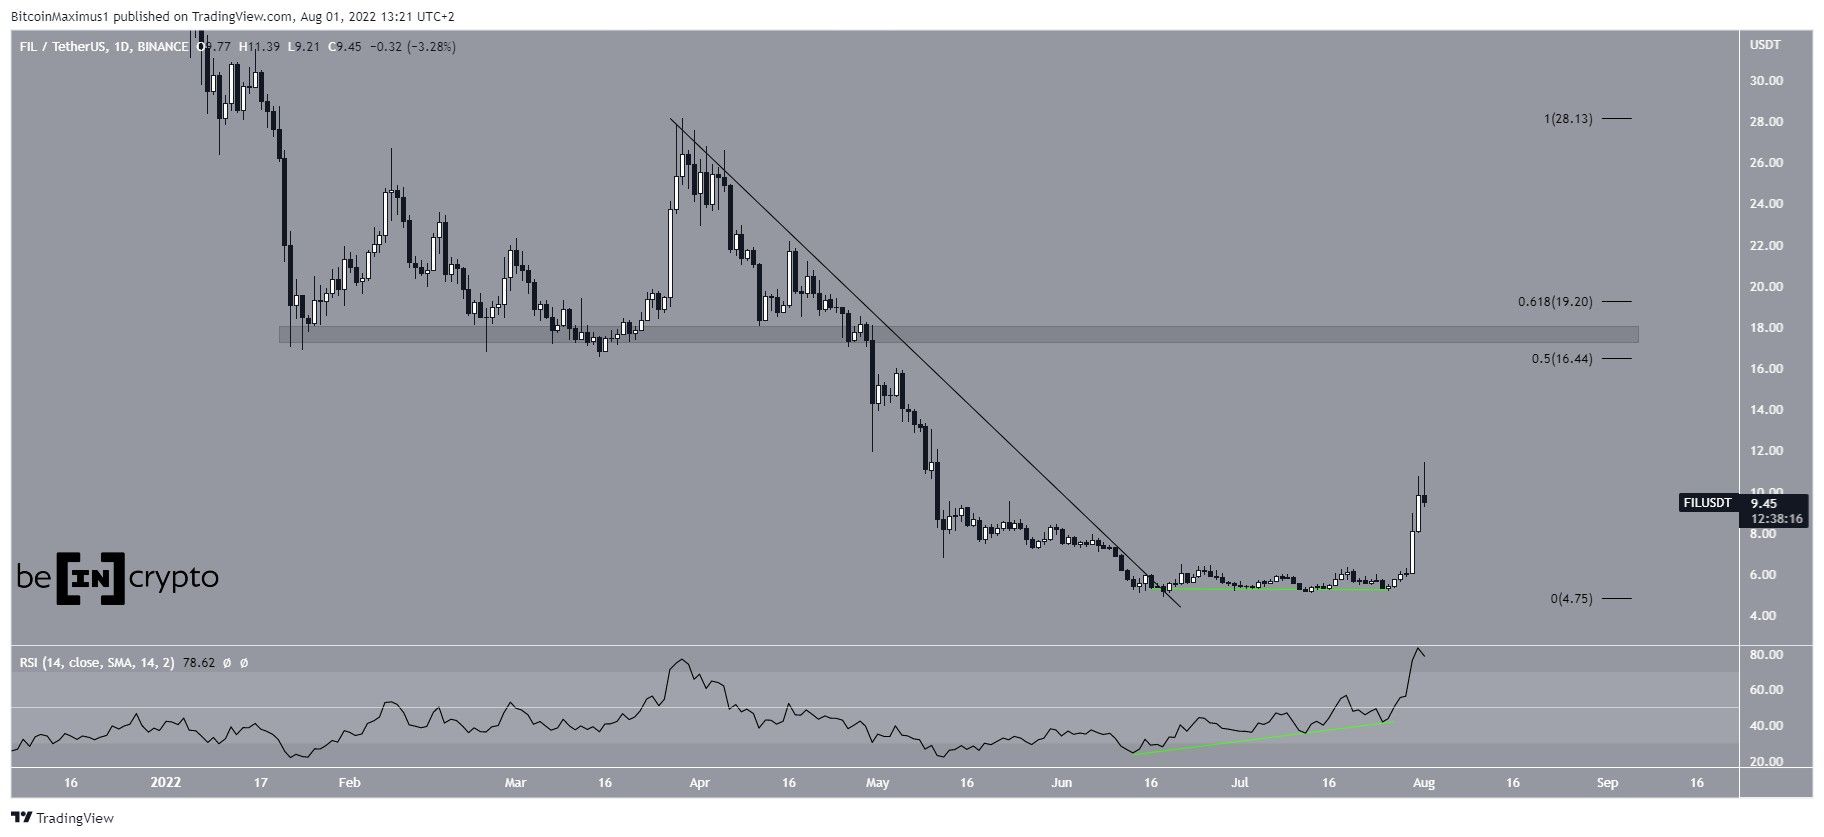
The daily chart shows that while FIL broke out from a descending resistance line on June 18, it did not accelerate its rate of increase until July 30.
Afterward, it increased sharply over the next two and a half days and reached a high of $11.39 on Aug 1.
This entire movement was preceded by a long-term bullish divergence that developed in the RSI beginning on June 14.
If the upward movement continues, the main resistance area would be between $16.40 and $19.20. This is a horizontal resistance area that is also between the 0.5-0.618 Fib retracement resistance levels. Finally, it also coincides with the previously outlined resistance area.
Therefore, if the price were to get there, the area would be expected to provide strong resistance.
Wave count analysis
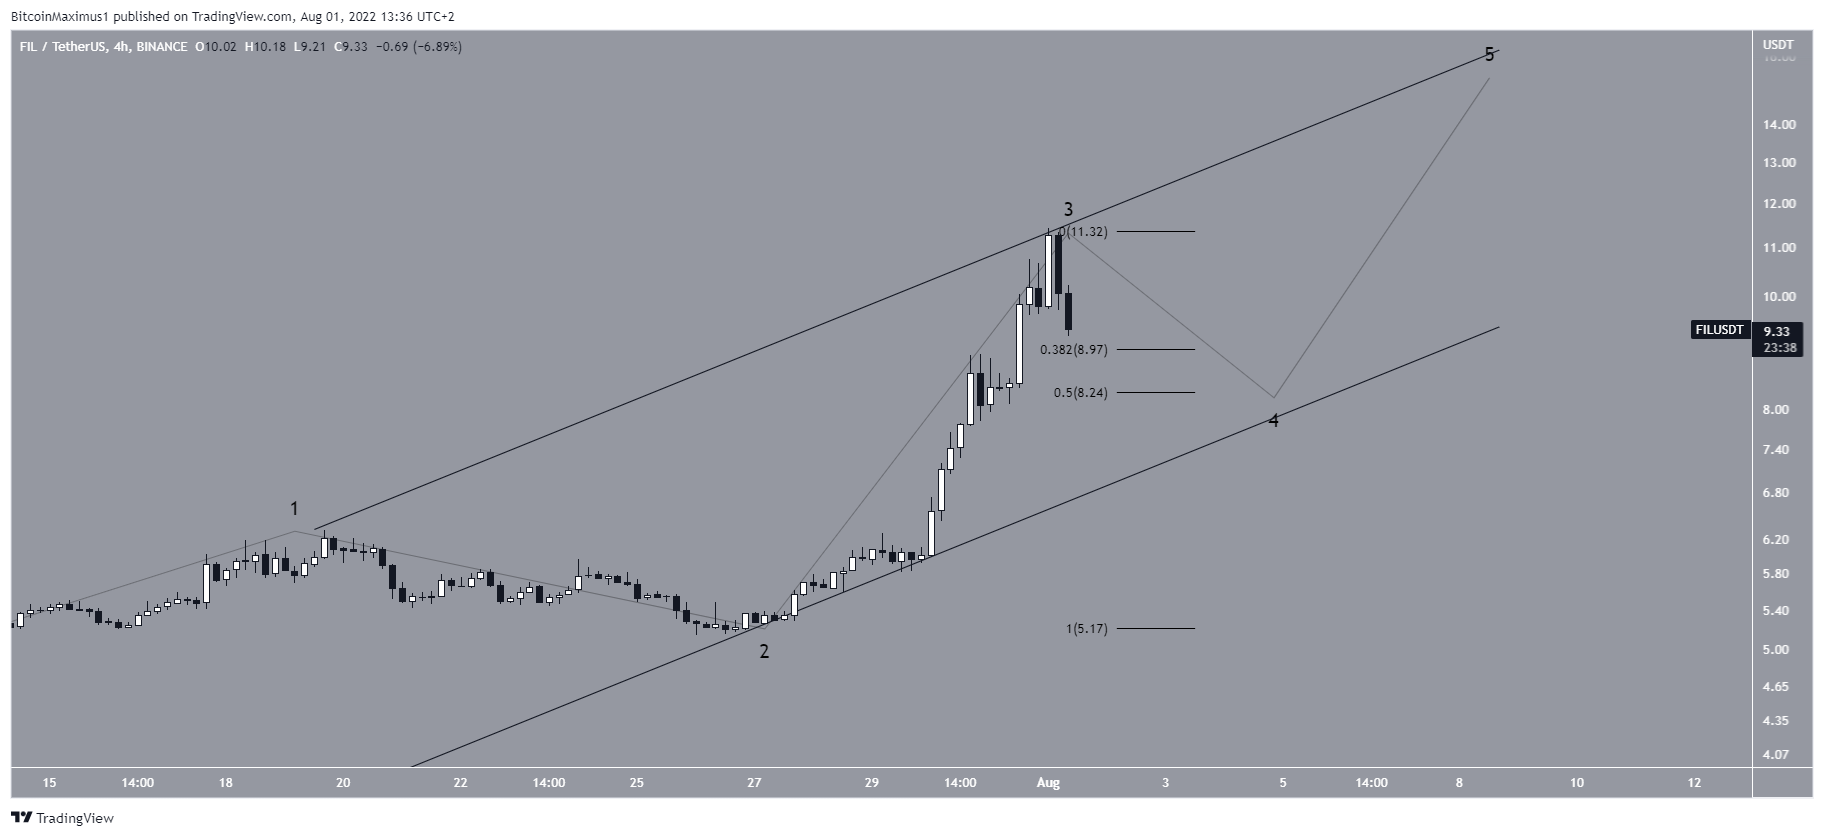
The most likely wave count suggests that FIL is in the midst of an extremely extended wave three, from a five-wave upward movement (black) that began on June 18.
Since wave two was gradual and deep, the concept of alternation states that most likely outline for wave four would be a sharp and shallow retracement.
So, it is possible that FIL will make a higher low between the 0.382-0.5 Fib retracement support area of $8.25 to $9 before completing its upward movement close to $15.
For Be[in]Crypto’s latest Bitcoin (BTC) analysis, click here


