
Exploring the current technical landscape of Fantom unveils fascinating insights within the 4H Ichimoku cloud.
Pairing this with a closer look at exchange netflows paints a comprehensive picture of FTM’s potential. Join BeInCrypto as we delve into this analysis together.
Fantom Technical Outlook
On the 4-hour chart, Fantom seems to be consolidating within the Ichimoku cloud, currently testing its upper edge.
The $0.78 to $0.81 range is crucial as it aligns with three key indicators: the 100-day EMA, the 200-day EMA, and the Ichimoku cloud’s 4-hour baseline.
If the price drops below the cloud, Fantom may find support in this range, but a clear break beneath it could signal a shift from bullish to bearish sentiment. Conversely, if the price remains within the cloud and breaks above it, this could suggest a surge in bullish momentum and higher volatility.
Read More: What Is Fantom (FTM)?
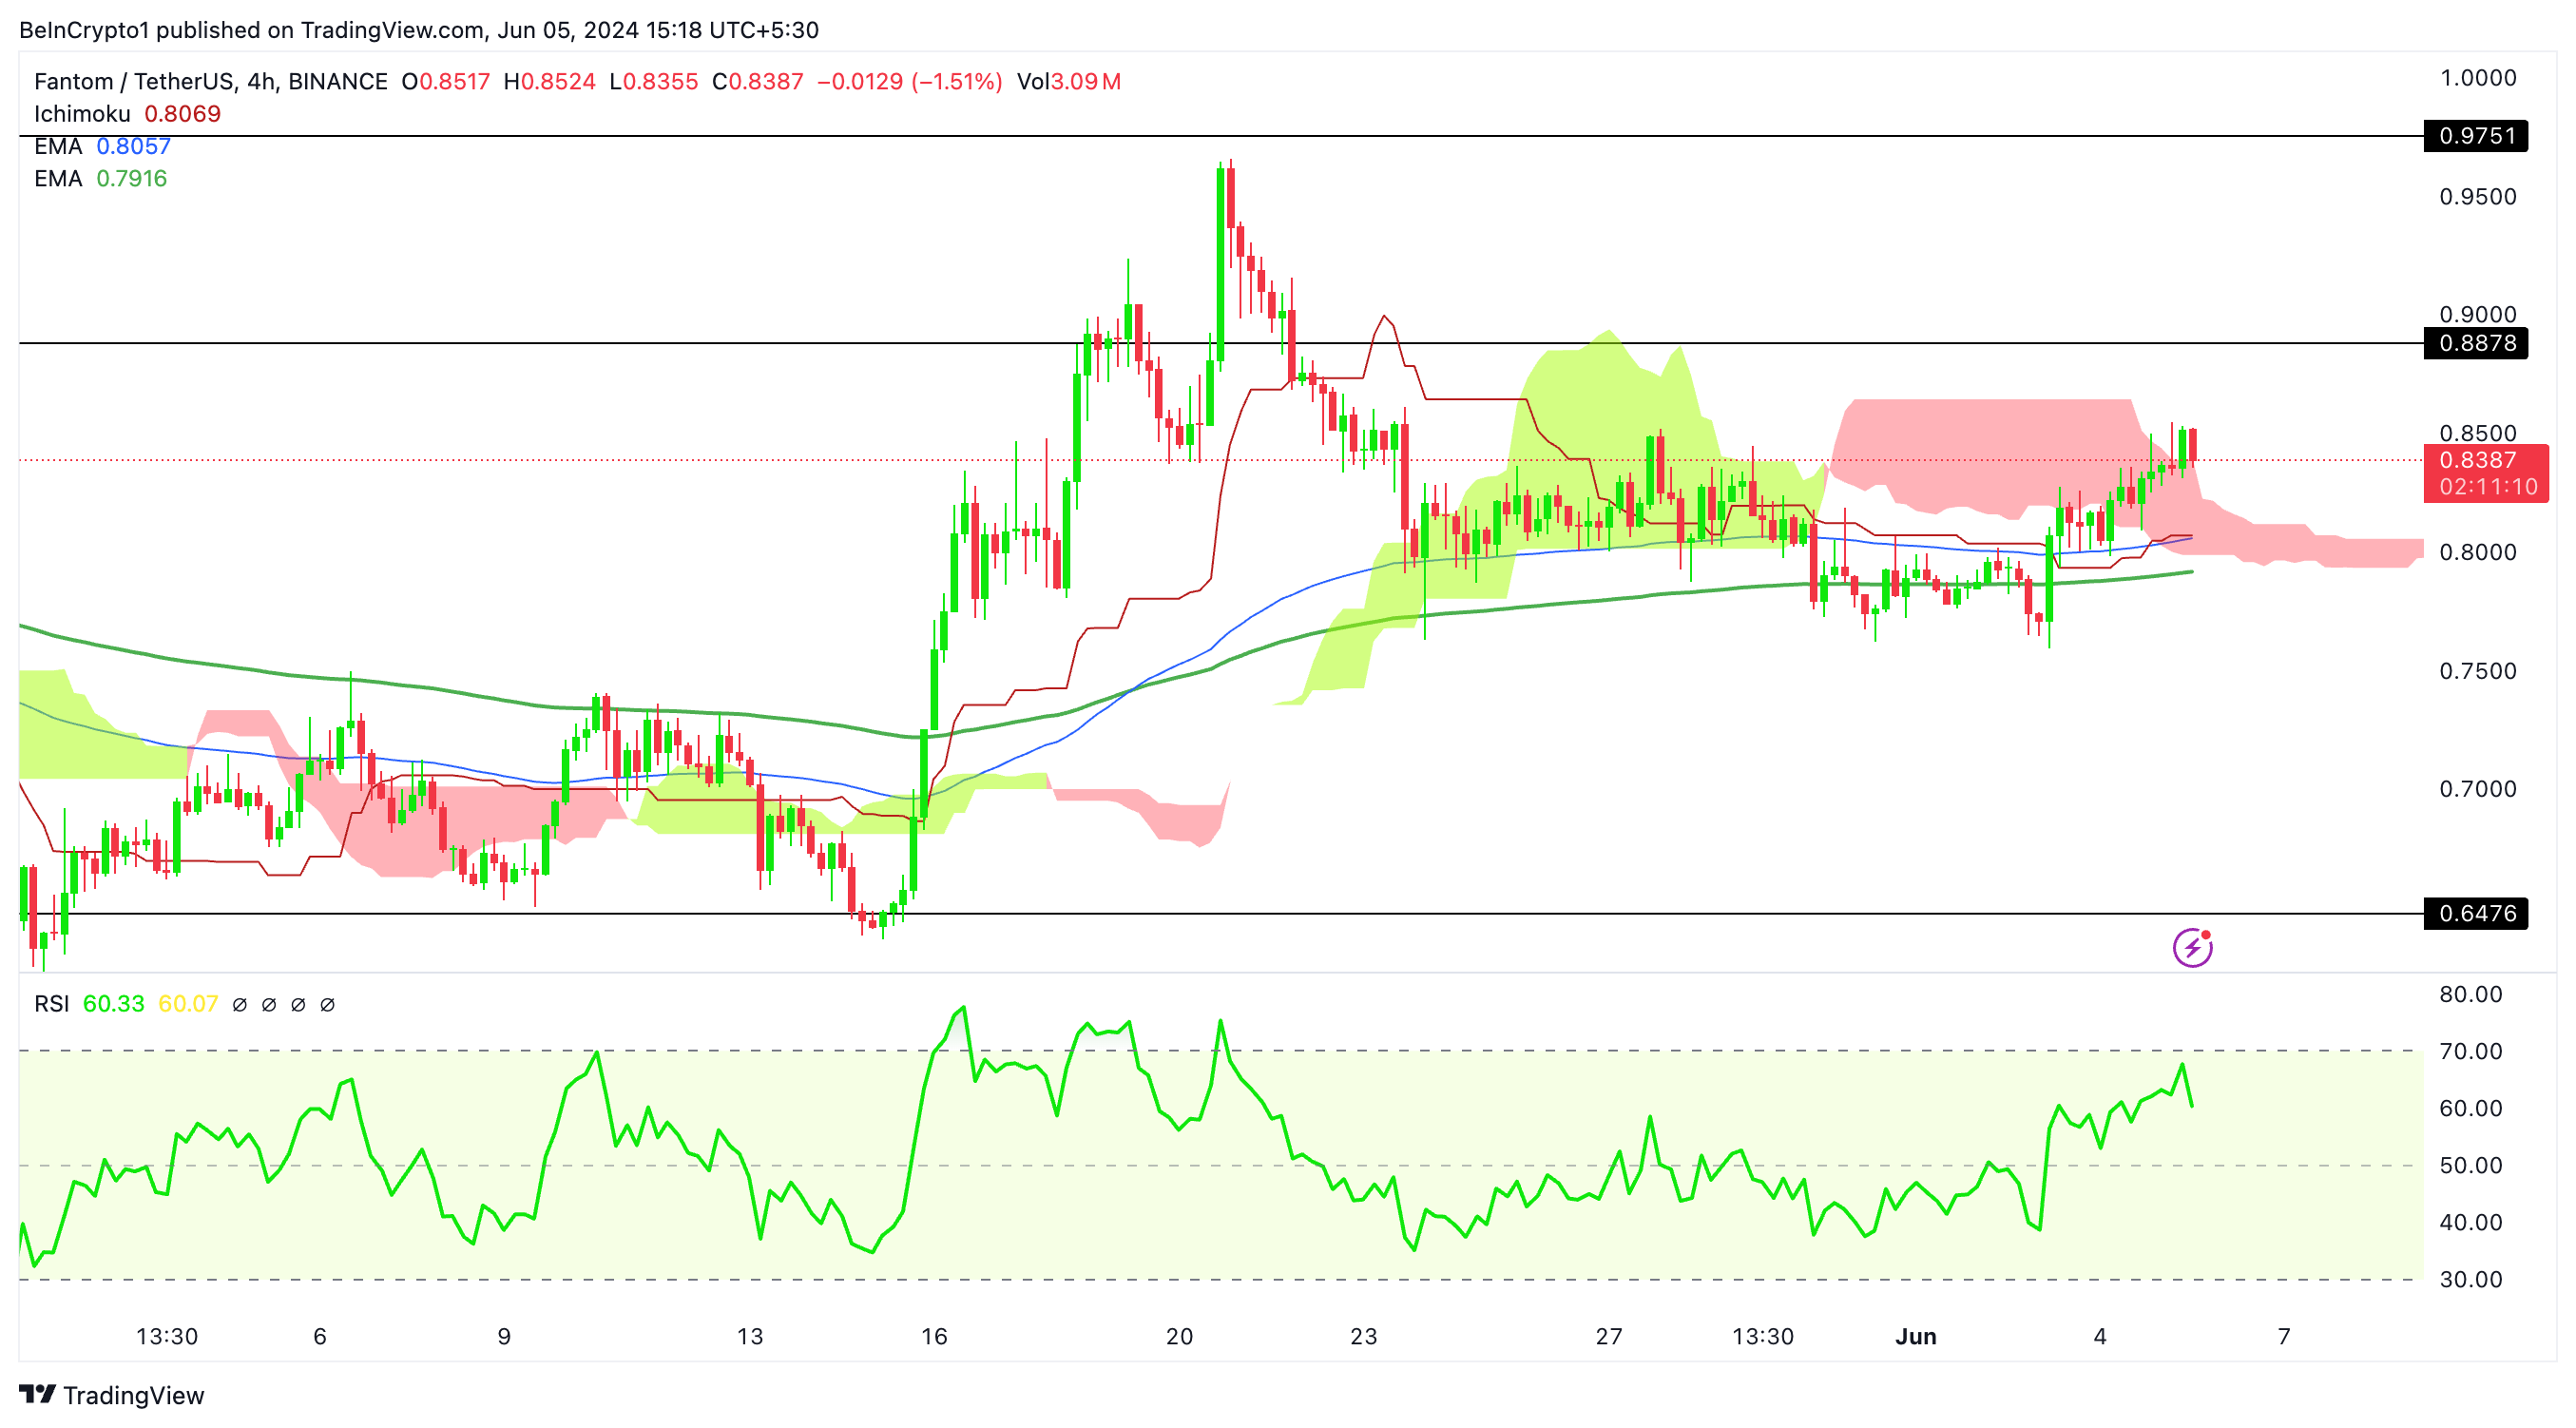
The RSI is fluctuating around 60 and trending upwards. This suggests that bullish momentum is building.
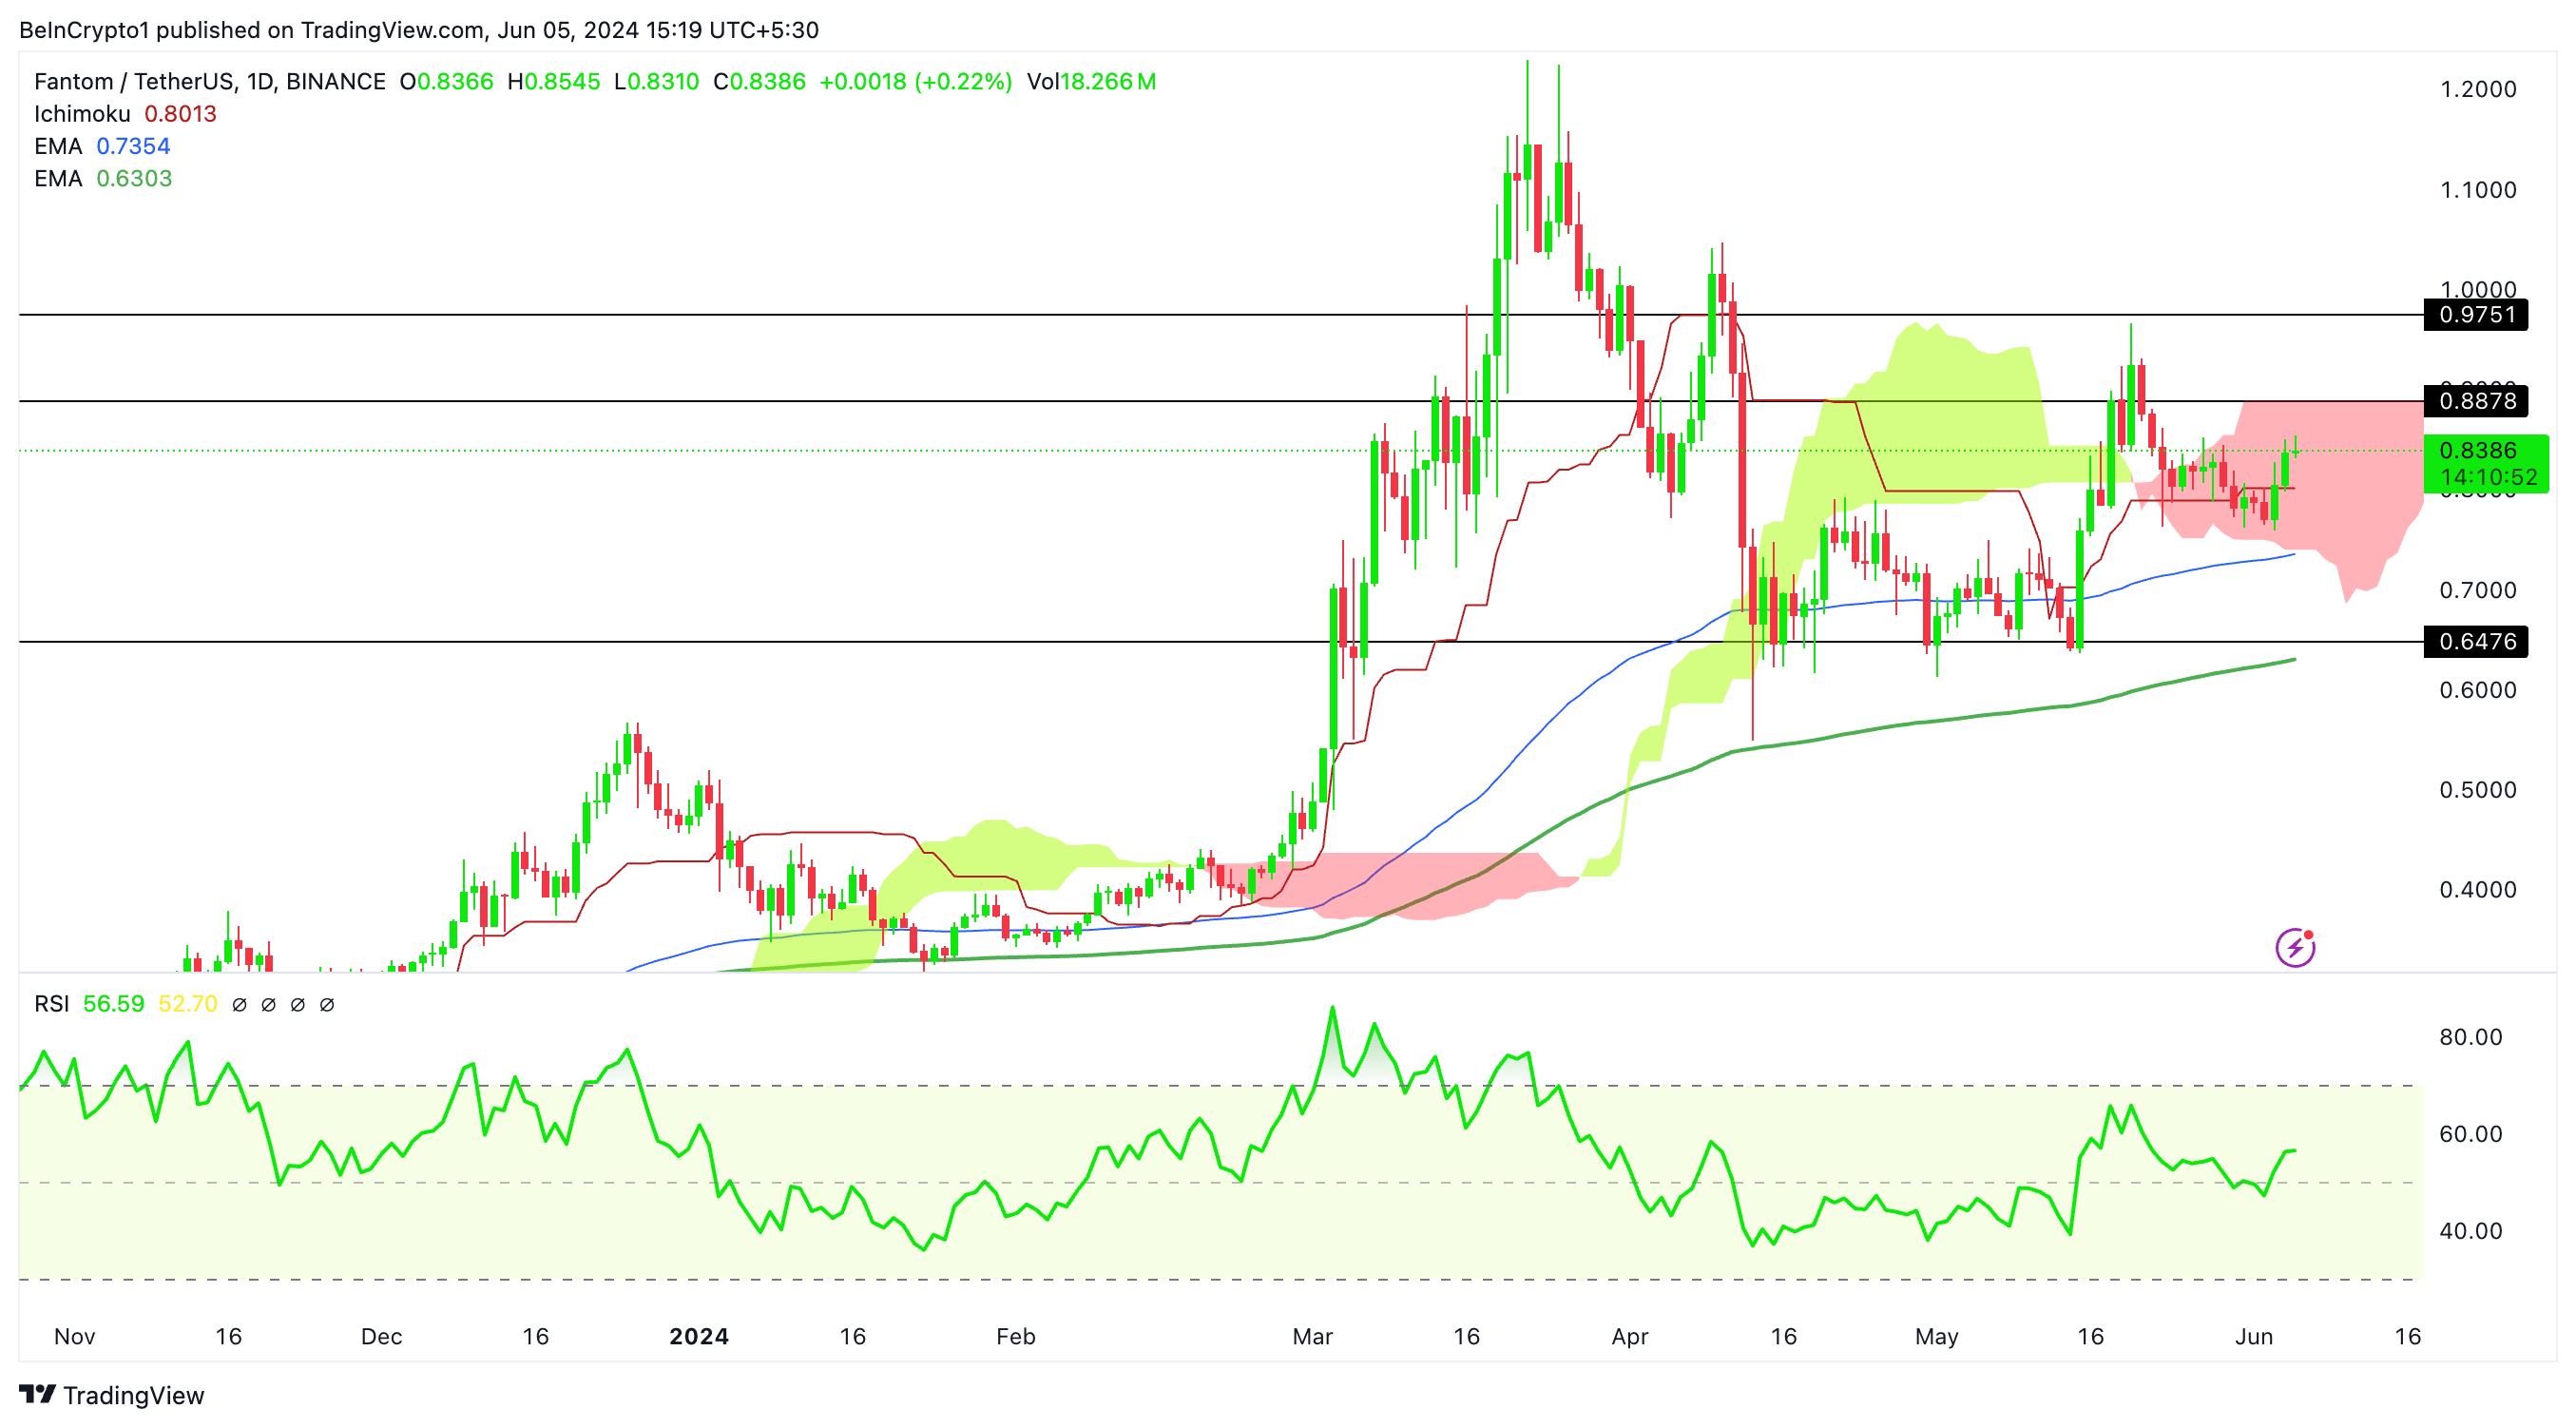
Looking at the Fantom daily chart, there’s a bullish signal. The price recently moved above the Ichimoku cloud’s baseline, indicating a possible mid-term uptrend. Currently, the price is comfortably within the cloud, providing additional support.
If the price breaks above the cloud’s upper boundary at $0.88, it could push towards $0.97. However, FTM might test the cloud’s lower boundary if the price reverses. This support zone could act as a hurdle, but a clear break below it might drop the price to the 100-day EMA at $0.73.
A further decline below the 100-day EMA could lead to a sharp fall towards the stronger support level at $0.647.
Analyzing Fantom Exchange Netflows
Examining the netflows of FTM exchanges, we see a noticeable pattern of net outflows. This suggests that investors are acquiring Fantom and subsequently transferring their holdings away from exchanges, opting for private wallets or alternative storage methods.
Read More: Fantom (FTM) Price Prediction 2024/2025/2030
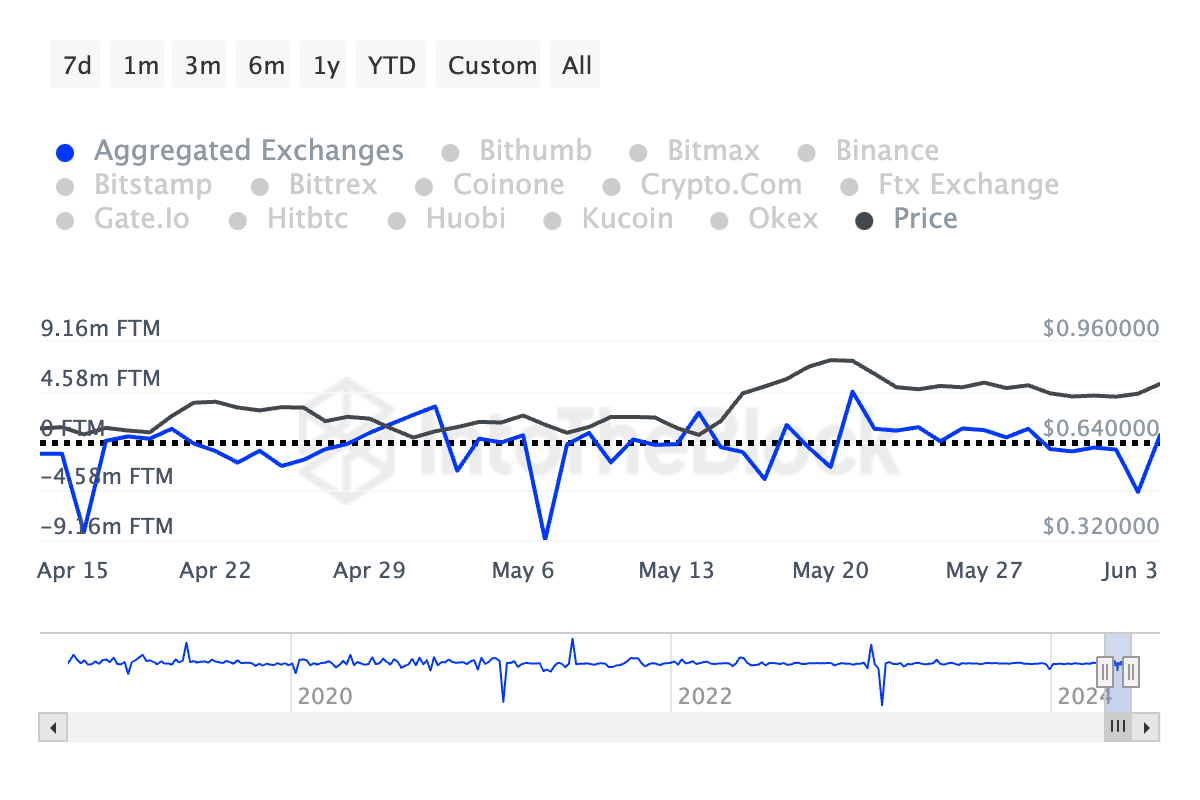
When holders move their assets off exchanges, it typically reduces the available pool for trading, thereby exerting upward pressure on the price. The continued occurrence of negative net flows indicates a strong belief in FTM’s potential.
Investors opt to hold onto their tokens for the long term rather than engage in short-term exchange-based transactions. This cycle of accumulation and withdrawal corresponds with the observed healthy uptrend in FTM’s value.
Strategic Recommendation
If the price returns to the 4-hour Ichimoku cloud, it may signal caution for traders and investors. The cloud acts as support and resistance, indicating shifts in market sentiment. Re-entering the cloud after a bullish run suggests a potential shift to neutral or bearish sentiment.
Monitoring the cloud’s interaction with the price is crucial, especially if the price struggles to break above it. This indicates weakening bullish momentum and a possible trend reversal.
The $0.78 to $0.81 range, aligned with Fibonacci retracement levels, adds weight to this cautionary outlook. Traders should watch how the price behaves around these levels and the cloud boundaries, as failure to break above could reinforce a bearish bias and lead to a trend reversal.
