


The Fantom (FTM) price could be in wave five of an upward movement, accelerating the rate of increase in the near future.
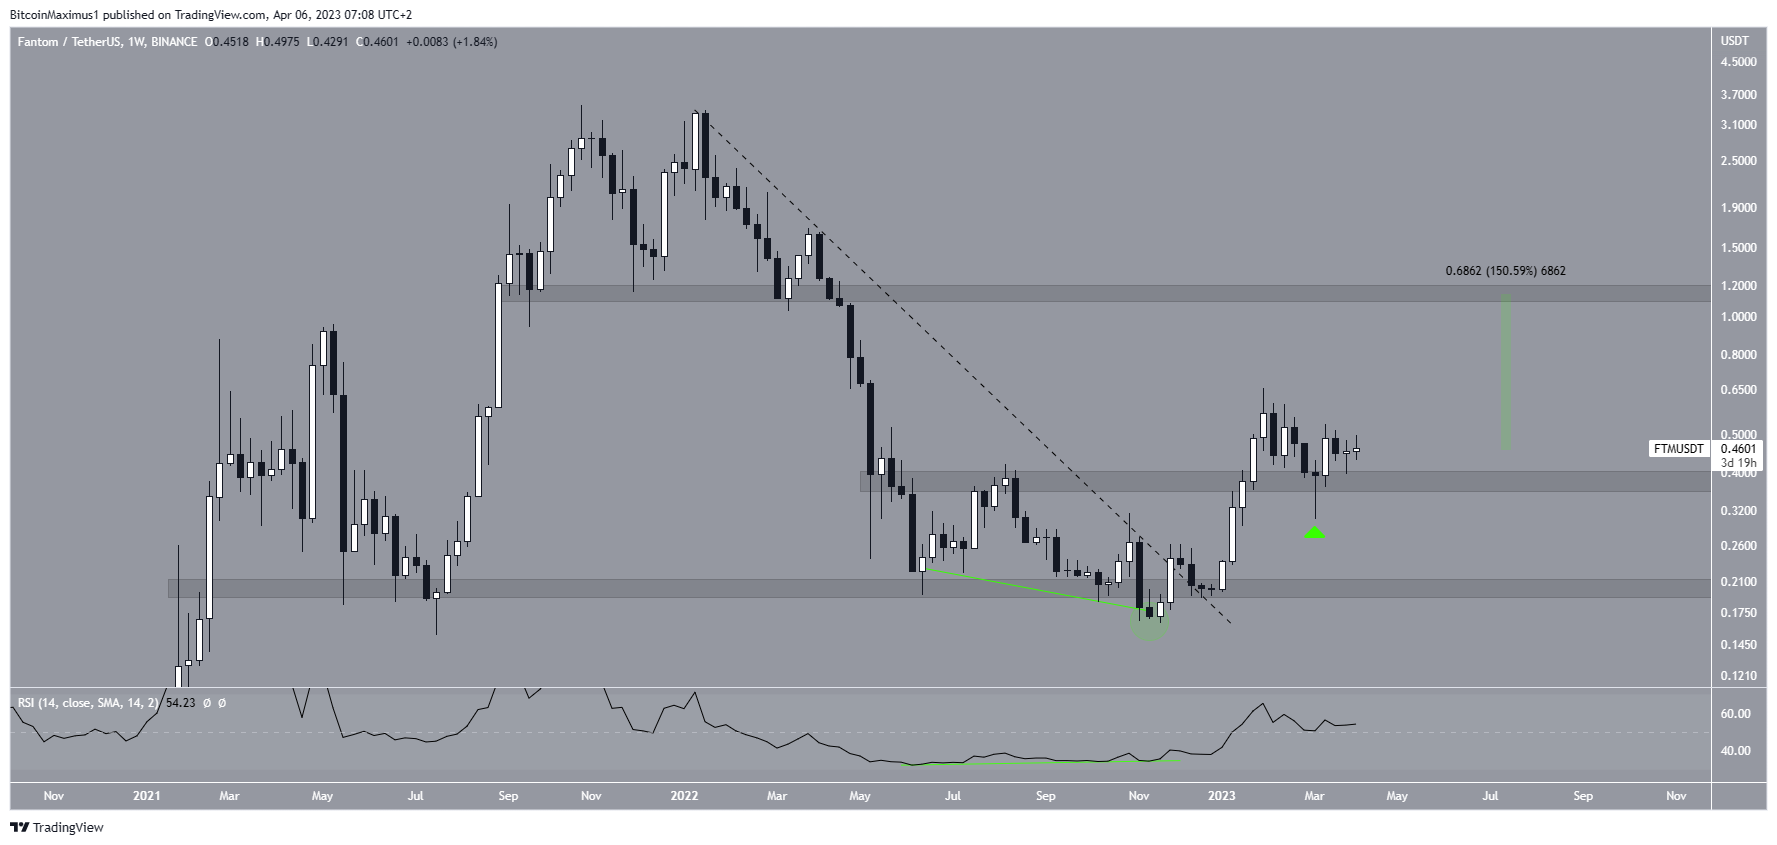
After reaching a record high in January 2022, the FTM price declined beneath a descending resistance line. This drop caused a breakdown from the support area of $0.20, leading to a low of $0.164 in November 2022. However, this decline was only a deviation (green icon), as the price of Fantom has increased since then.
The increase was preceded by a bullish divergence in the RSI (green line). The indicator is now above 50, indicating a bullish trend. The FTM token price went up to $0.655 in January, but later decreased, bouncing back at the horizontal support level of $0.39. The long lower wick (green icon) confirmed this level as a support.
If the upward trend continues, the future price can reach $1.15, an increase of 150% from the current level. However, if the price falls and closes below $0.39, it may lead to a drop toward $0.20.
Fantom (FTM) Price Prediction for April: $1.15 Within Reach
The technical analysis from the daily time frame aligns with the readings from the weekly one. As a result, it gives a bullish FTM price prediction for April. There are numerous reasons why this is the case, given the price action and the wave count.
The price appears to have completed a fourth-wave pullback and bounced in the middle (green circle) of the previous ascending channel. After a sharp upward movement that broke out from a short-term descending resistance line, the FTM price validated the channel’s resistance line as support (green icon).
The wave count (black) indicates that the FTM price is now in wave five. The sub-wave count is given in white. The most likely areas for the top are at $0.87 and $1.20. The former is found by the 1.61 external Fib retracement of wave four (black), while the latter is found by projecting the length of waves one and three combined (white).
Since the $1.20 target coincides with the previously mentioned long-term resistance area and fits better with the sub-wave count, it is more likely to act as the top.
If the Fantom price falls below the sub-wave two low (red line) of $0.39, it will invalidate this bullish FTM price forecast. In that case, the price could drop toward $0.20.
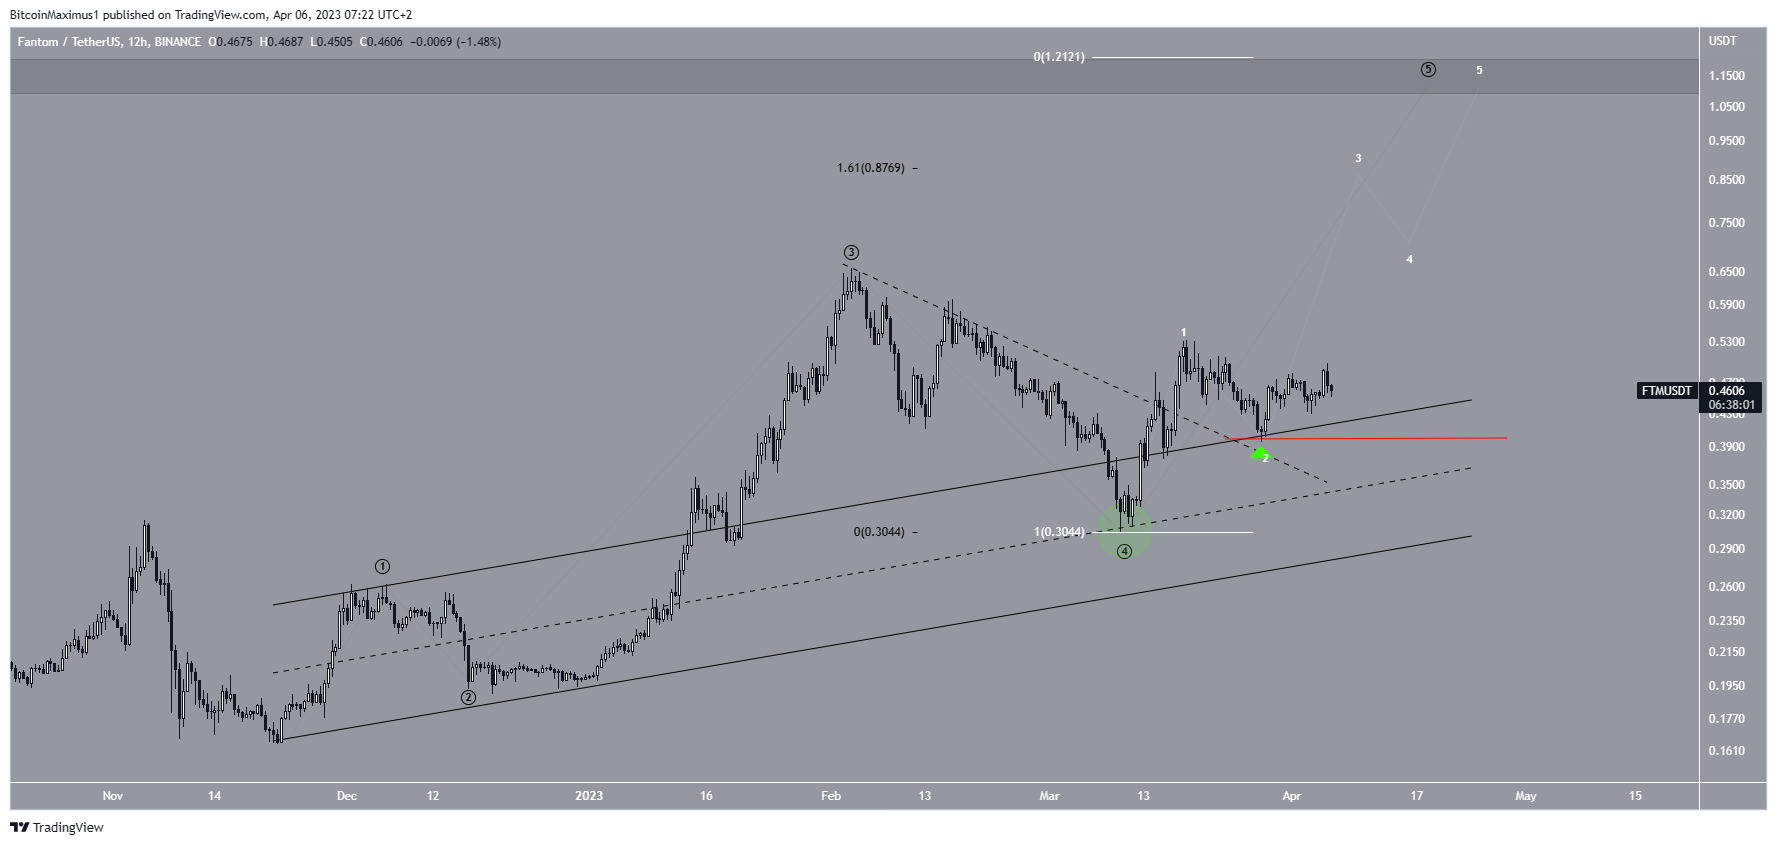
To conclude, the most likely FTM price forecast is an increase toward an average price of $1.15-$1.20. This would be invalidated with a decrease below $0.39, something which could catalyze a fall to$0.20.
For BeInCrypto’s latest crypto market analysis, click here.


