


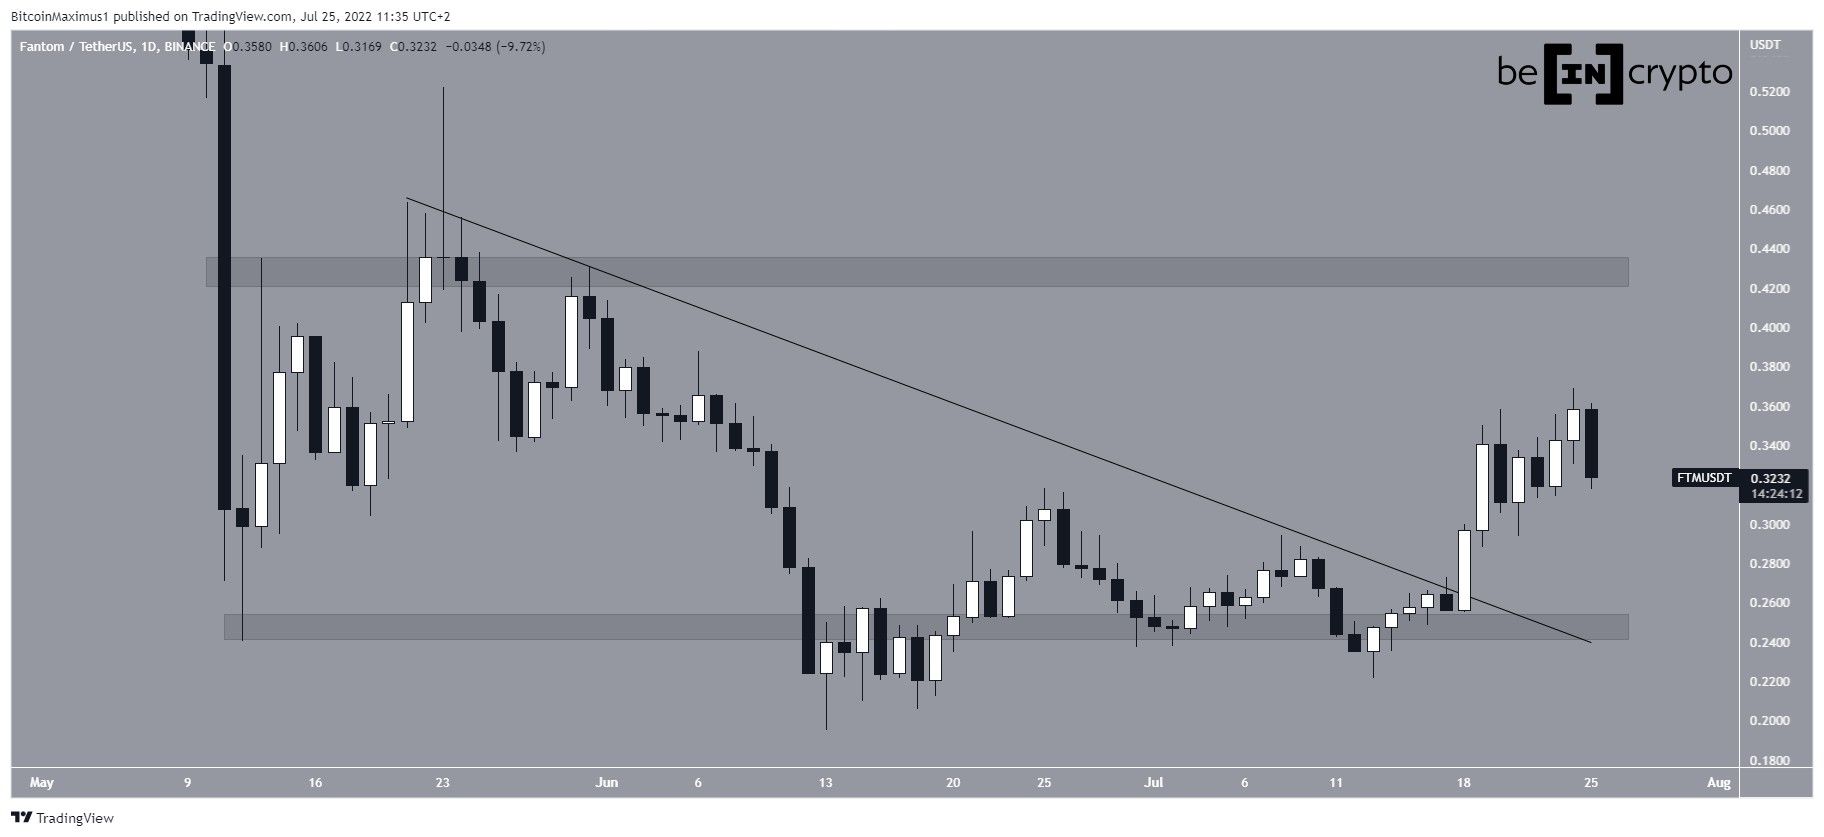
Fantom (FTM) has been increasing at an accelerated rate since breaking out from a descending resistance line on July 18.
FTM has been moving upwards since reaching a low of $0.194 on June 13. On July 18, it managed to break out from a descending resistance line that had previously been in place since May 23.
The upward movement led to a high of $0.368 on July 24.
The price has decreased slightly since and is currently trading at $0.325. The closest support and resistance areas are at $0.245 and $0.43 respectively.
Bullish readings
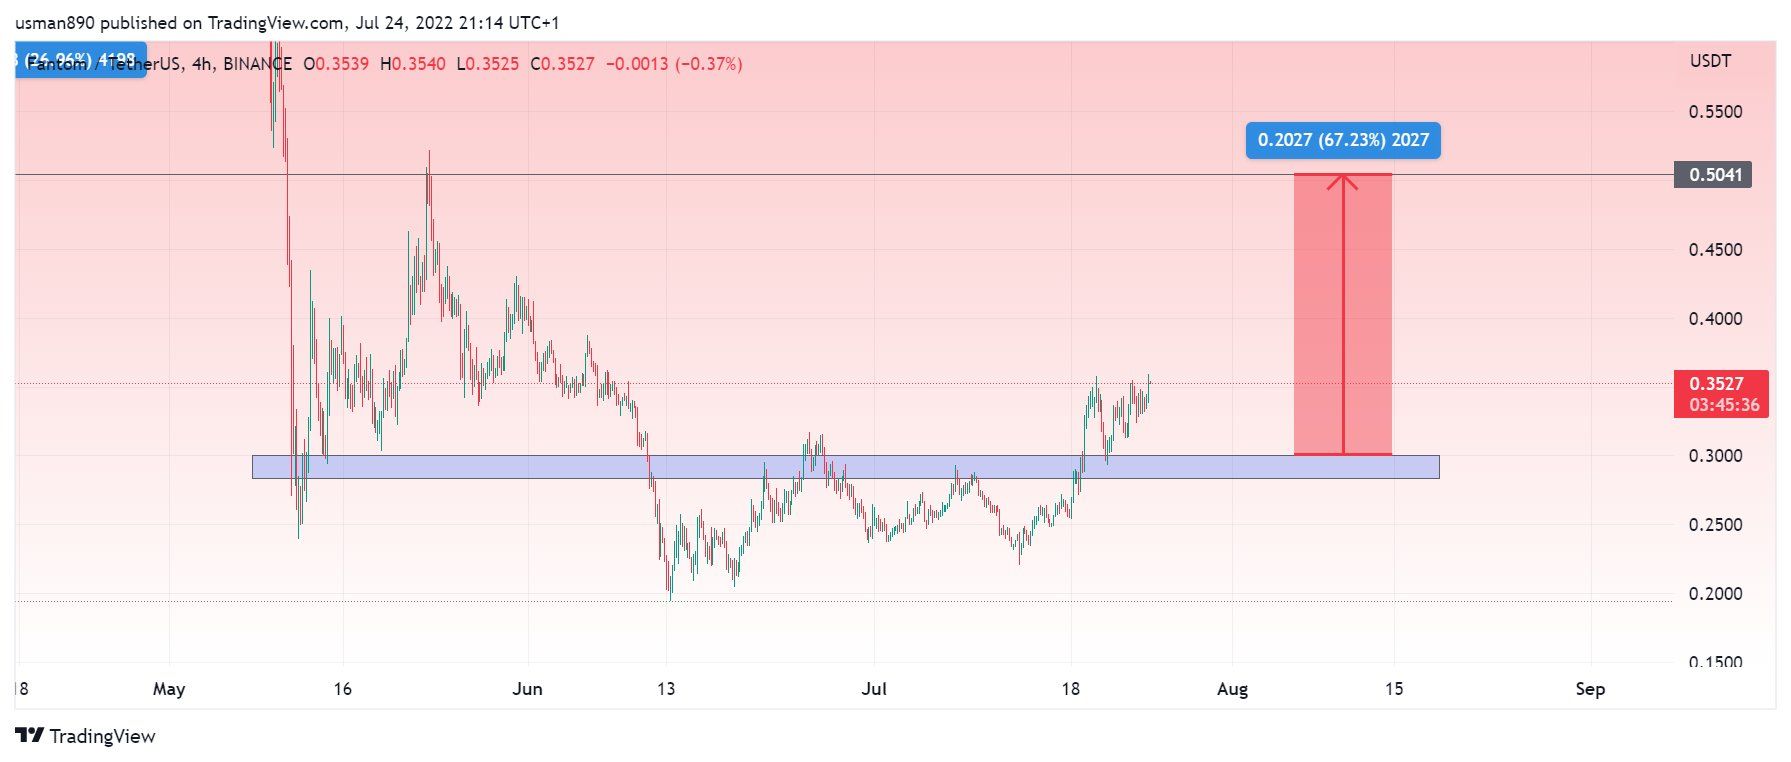
Cryptocurrency trader @Cryptoknight890 tweeted a chart of FTM, stating that the price could increase by a further 70%.
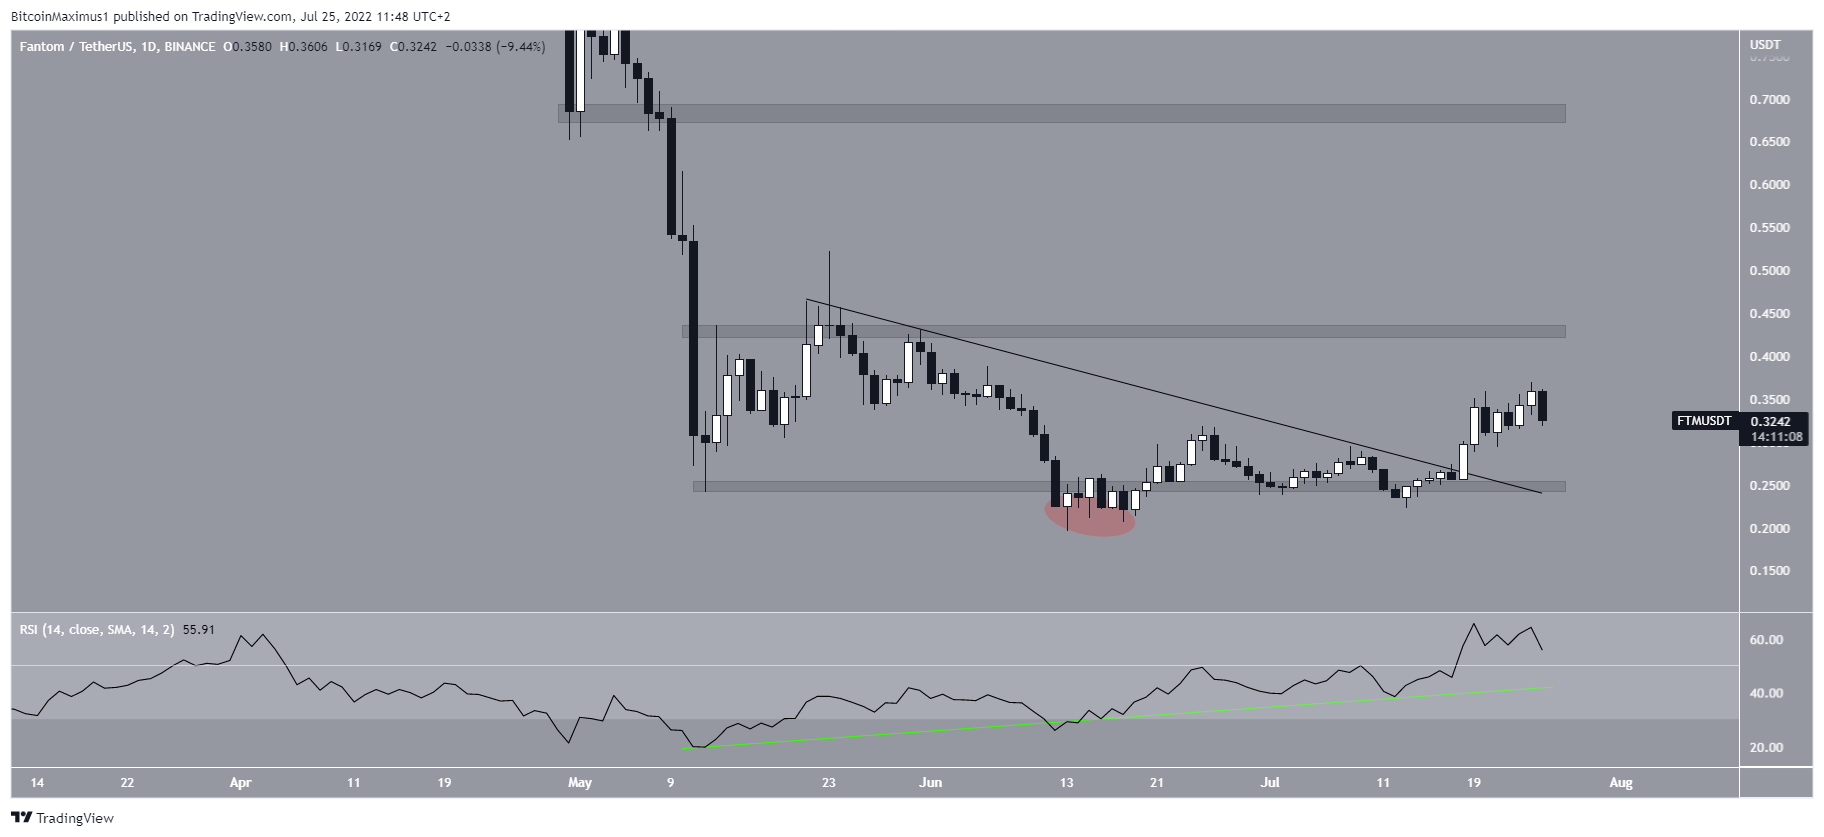
The readings from the daily RSI support the continuation of the upward movement. After a long period of generating bullish divergence (green line), the RSI moved above 50, something which is considered a sign of a bullish trend.
Moreover, the deviation (red circle) and subsequent reclaim above the $0.245 area is a strong sign of a potential bullish reversal, aligning with the readings from the RSI.
So, the daily time frame supports the possibility that the price will move to the $0.445 area and potentially break out. If it is successful in doing so, the next closest resistance area would be at $0.70, created by the April lows.
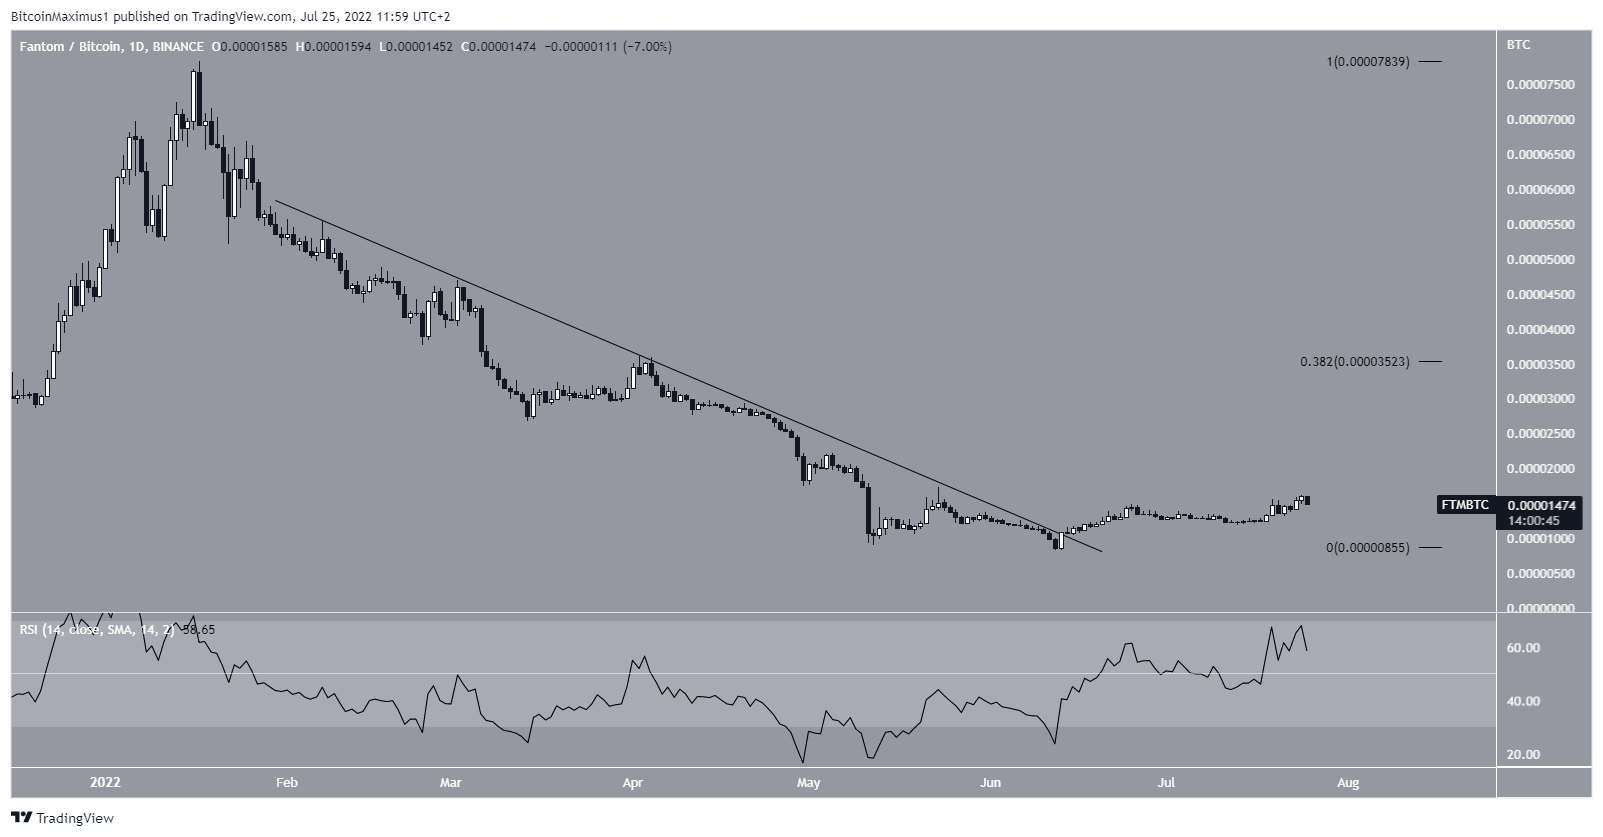
FTM/BTC
The FTM/BTC chart is similarly bullish, since the price has broken out from a descending resistance line. Additionally, the daily RSI has moved above 50, doing so at the same time that the price created its first higher low.
If the upward movement continues, the next closest resistance area would be at 3,500 satoshis. This is the 0.382 Fib retracement resistance level when measuring the entire downward movement.
For Be[in]Crypto’s latest Bitcoin (BTC) analysis, click here


