On May 27, the THETA price moved inside a range of 38%, between 4,207-5,813 satoshis, the latter value being an all-time high price. This day with significant volatility comes after an upward move that has been ongoing since May 20 and has seen the price increase by 150%.
All-Time High
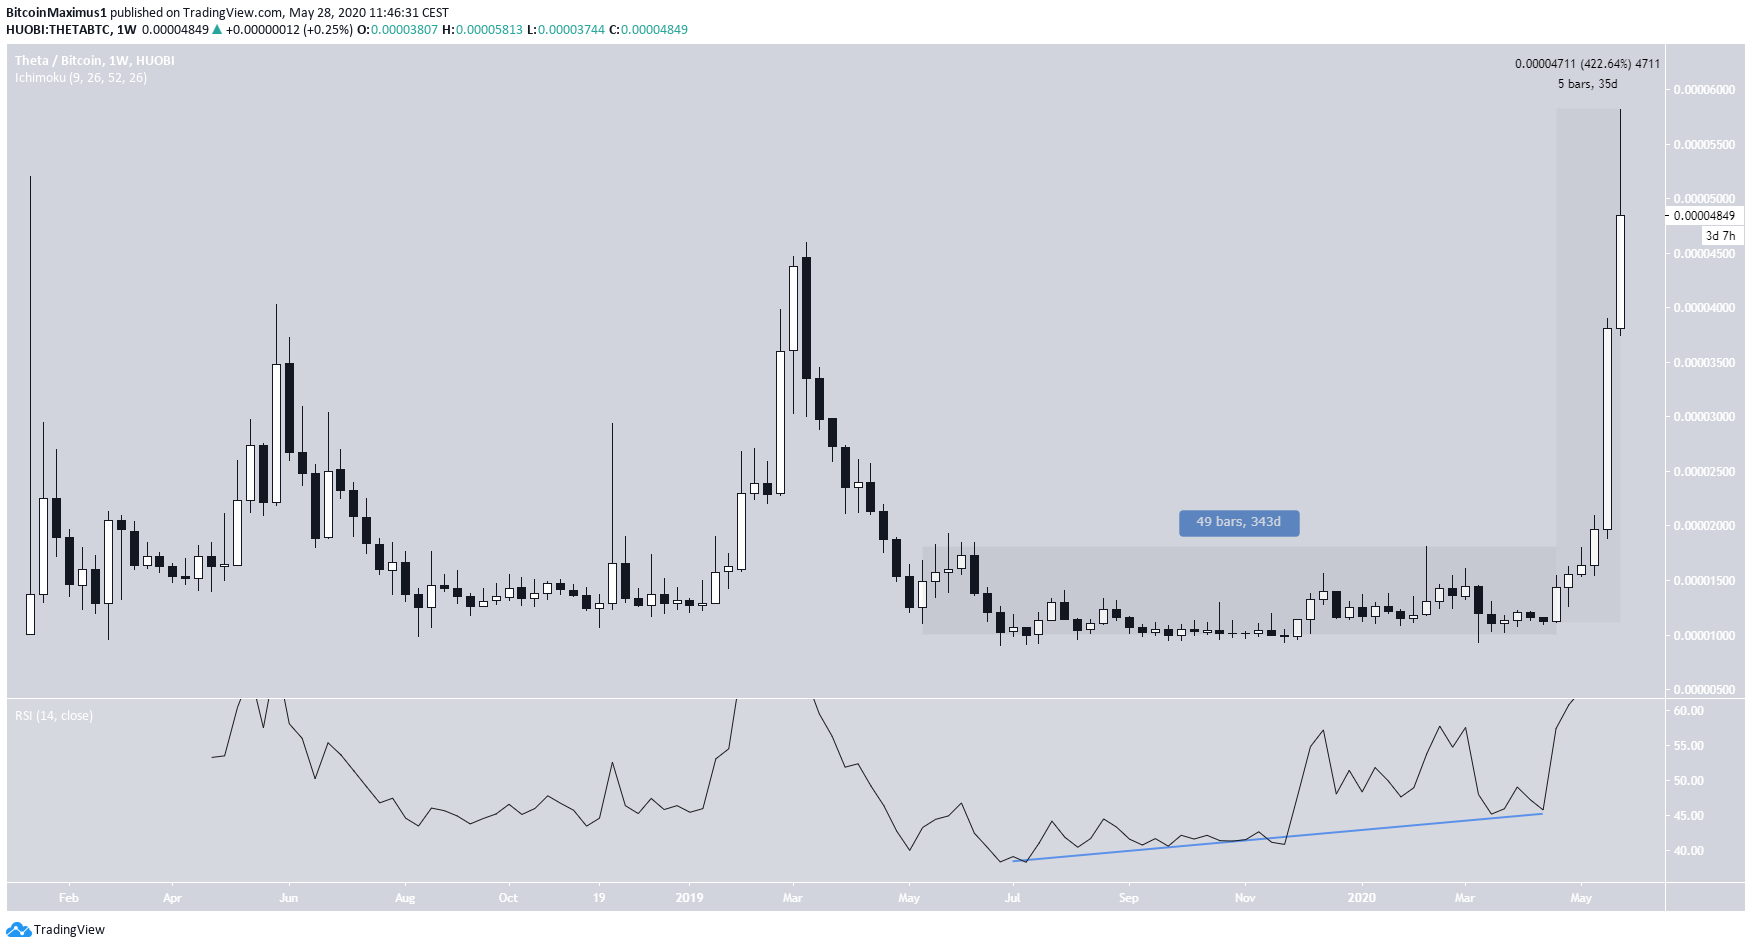
Using the weekly chart, we can see that THETA consolidated for a period of 343 days, while generating considerable bullish divergence in the RSI. Afterwards, a period of rapid increases ensued, in which THETA moved upwards by 422% in only 35 days. This also caused the price to reach an all-time high on May 27.
However, the price decreased considerably the next day, leaving a long upper wick in its wake, even though the weekly candle has four more days until it closes.
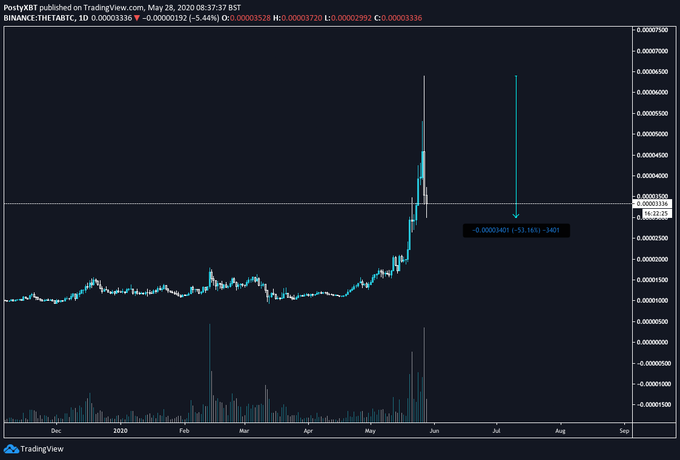
The sharpness of the decrease was better illustrated by cryptocurrency trader @postyXBT, who tweeted a THETA chart which shows a 50% decrease in a matter of hours.
Future Movement
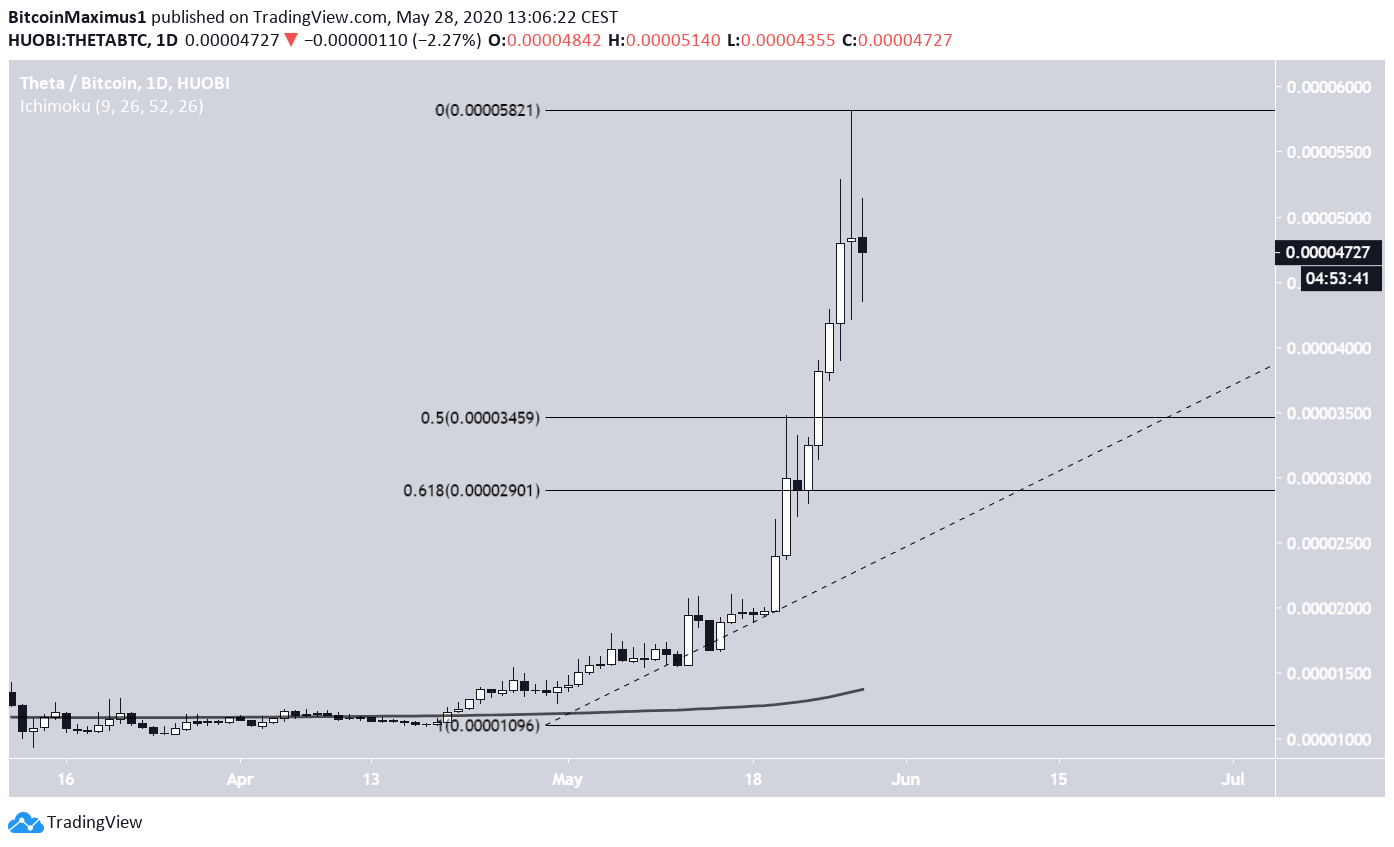
The daily chart better reveals that the movement has become almost parabolic, making it impossible to draw any type of support line.
Furthermore, the price is considerably above the 200-day moving average (MA), which is still at 1,500 satoshis. This better illustrates how rapid the entire upward move has been.
Yesterday, the price created a doji candlestick, which can be read as a sign of reversal when occurring after an upward movement. In order for the reversal to be confirmed, the price has to reach a daily close below yesterday’s wick low of 4,000 satoshis.
If the price begins to decrease, the closest support level is found between the 0.5-0.618 Fib levels at 2,900-3,450 satoshis.
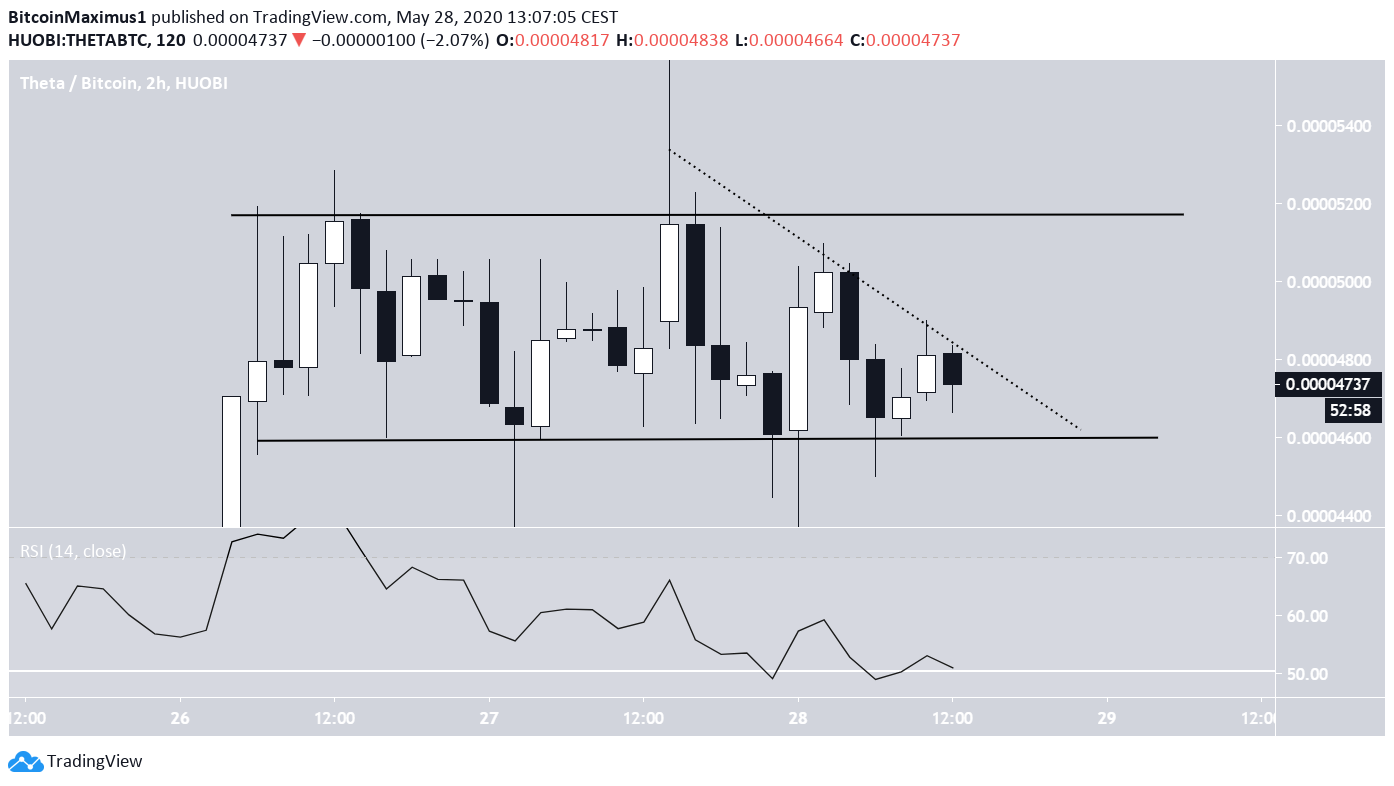
The two-hour chart shows that the price is trading inside a horizontal channel, currently being slightly above the support line. In addition, the RSI is also holding up above the 50-line.
However, the price has generated three successive lower highs, a sign of weakness. Therefore, the price is expected to break down from this channel and decrease towards the support area outlined previously.