
Binance Coin (BNB) has broken out from an ascending parallel channel but was rejected at the $508 resistance area.
Uniswap (UNI) has broken out from a symmetrical triangle and reached the $29 resistance area.
THORChain (RUNE) has broken out from a descending resistance line and reached the $12.10 resistance area.
BNB
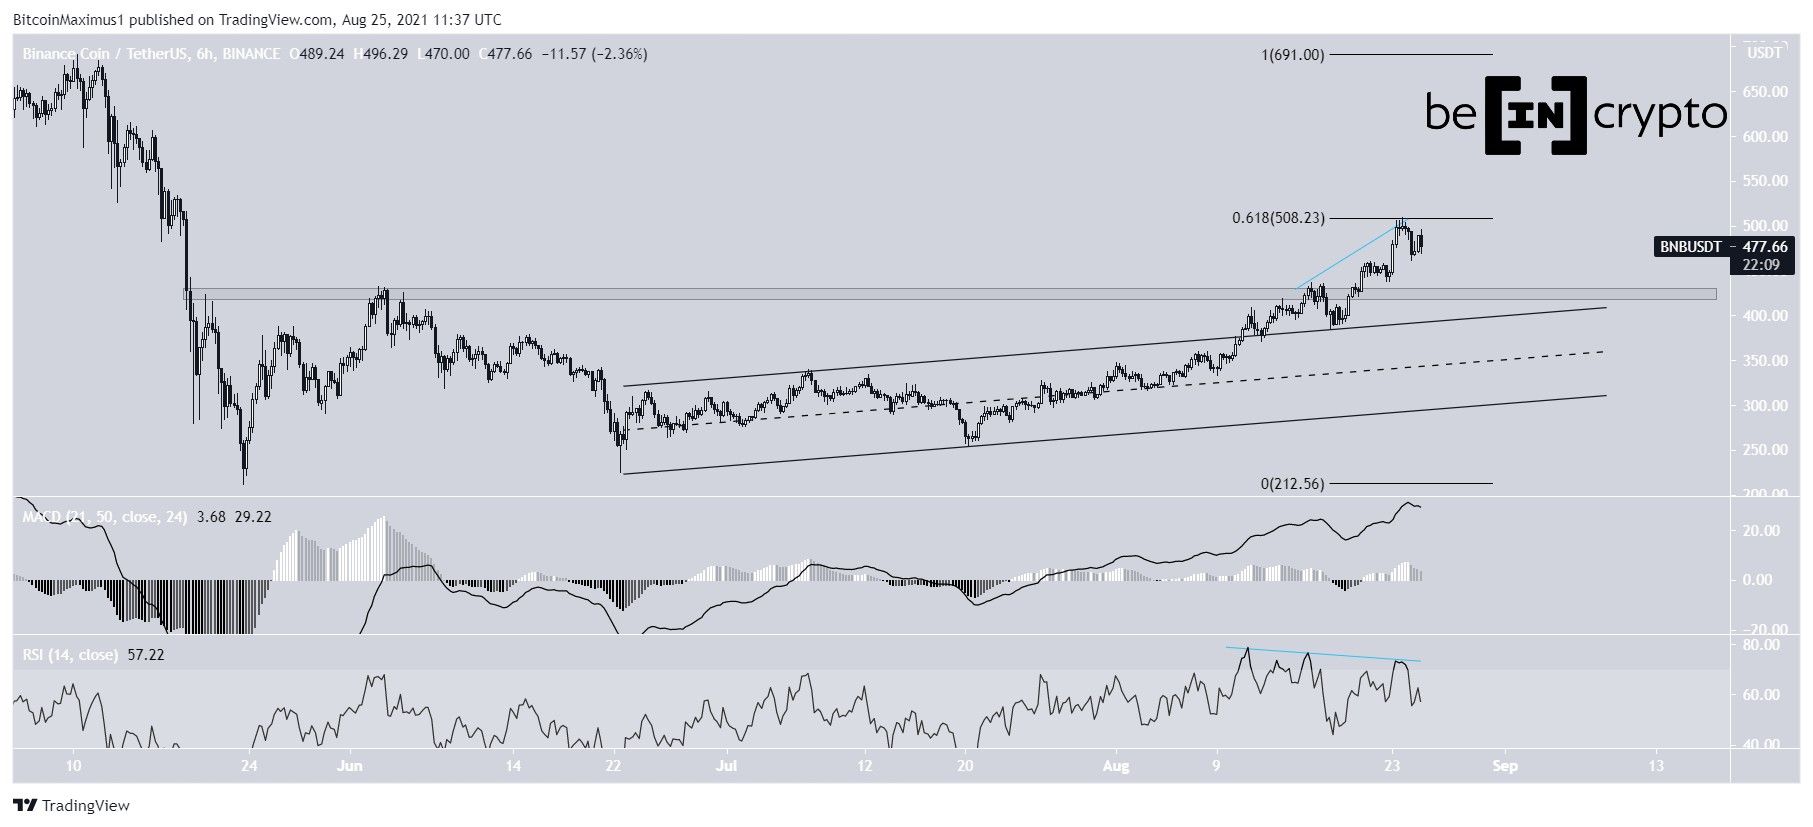
BNB had been increasing inside an ascending parallel channel since Jun 22. On Aug. 11, it managed to break out from the channel and moved above the $425 resistance area shortly afterwards.
The rally continued until a high of $509.7 was reached on Aug. 23. However, the token was rejected by the 0.618 Fib retracement resistance level shortly afterwards and began to decrease. The decrease was preceded by bearish divergence in the RSI.
There is a confluence of support levels at $425, created by the horizontal support area and the resistance line of the parallel ascending channel.
Therefore, BNB could decrease and validate this level as support before moving upwards once more.
Highlights
- BNB has broken out from an ascending parallel channel.
- It is facing resistance at $508.
UNI
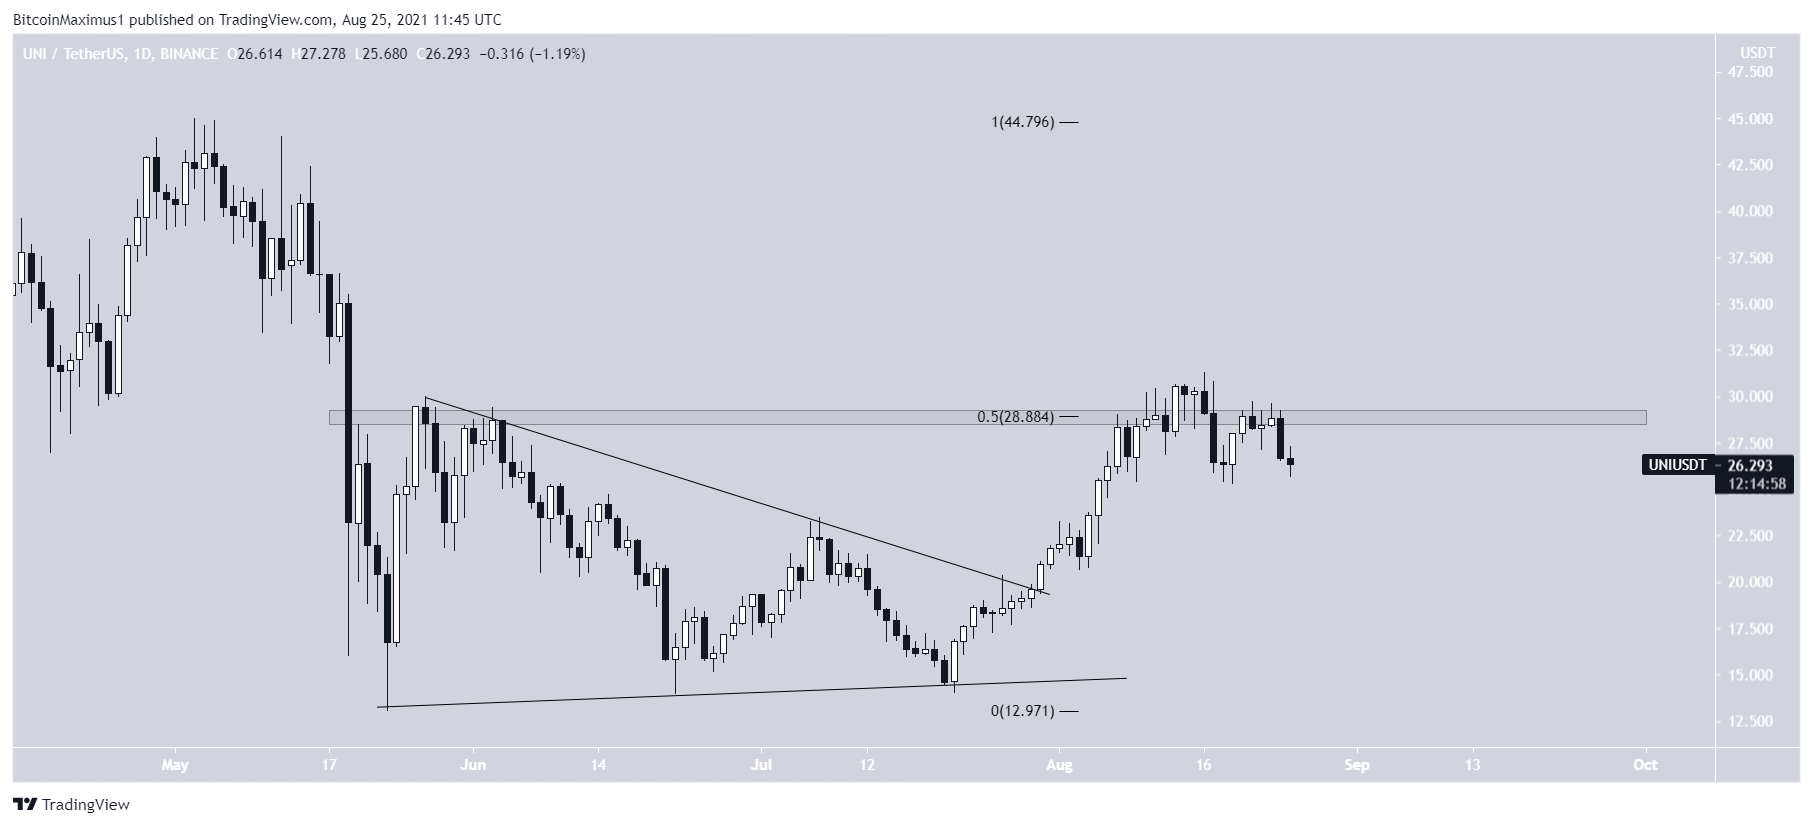
In the period from May 23 to July 30, UNI had been trading inside a symmetrical triangle. It managed to break out on July 30 and continued increasing until it reached a high of $31.25 on Aug. 16.
Afterwards, it was rejected by the 0.5 Fib retracement resistance level and has been moving downwards since.
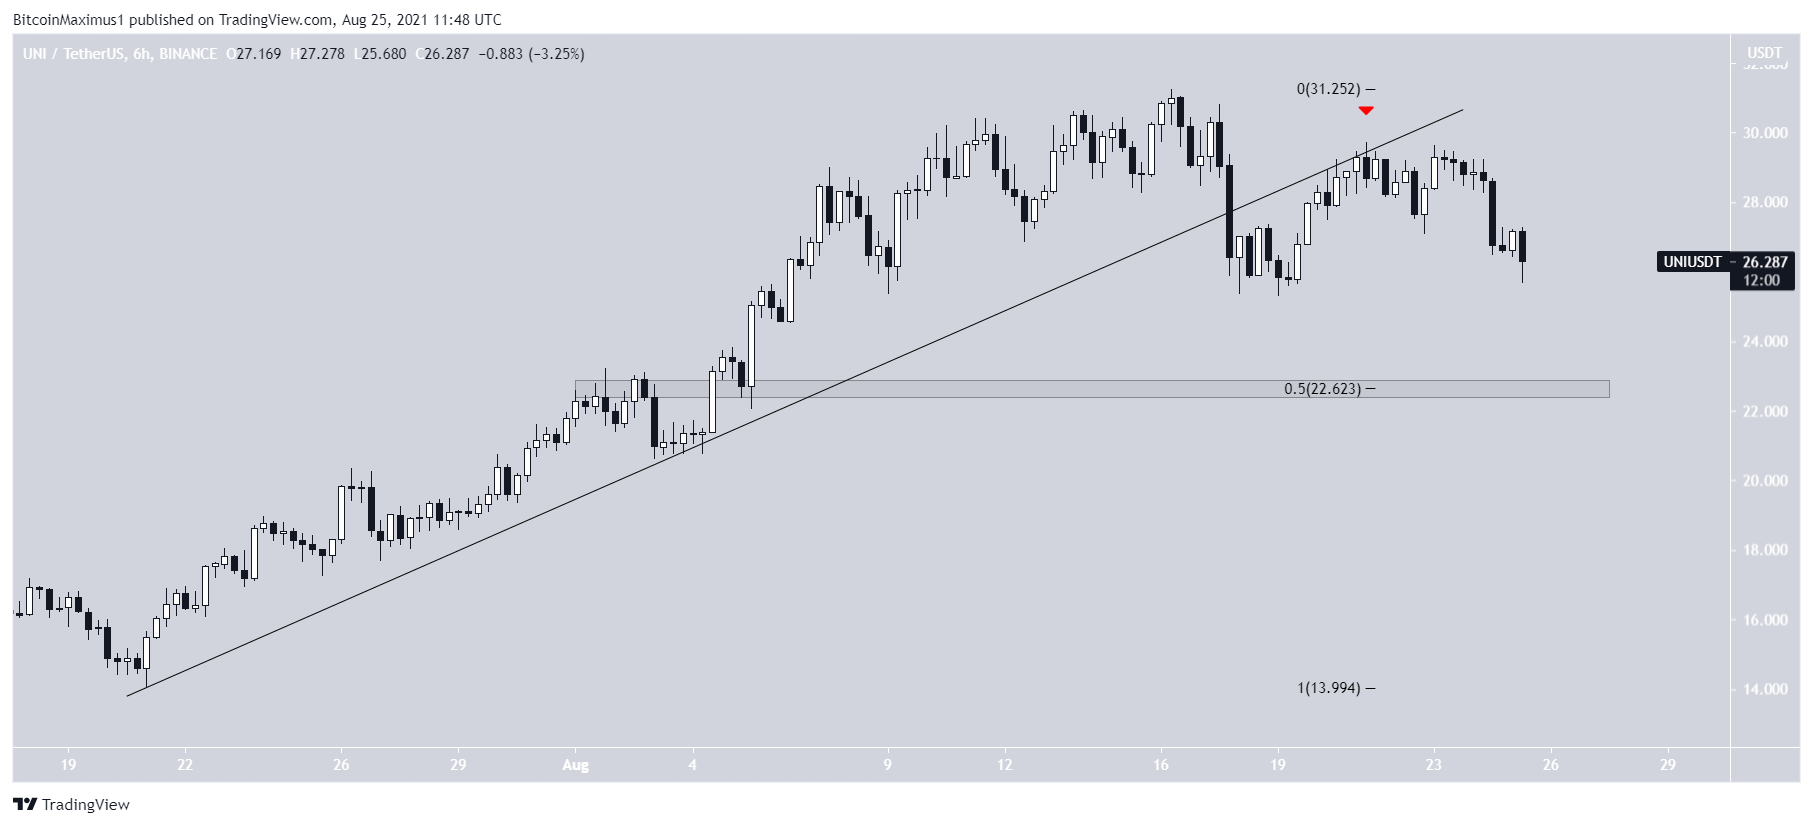
A look at the shorter-term six-hour chart shows that UNI has broken down from an ascending support line and validated it as resistance afterwards (red icon).
If the downward movement continues, the main support area is at $22.60, the 0.5 Fib retracement level and a horizontal support area.
Highlights
- UNI has broken out from a symmetrical triangle.
- There is resistance at $29.
RUNE
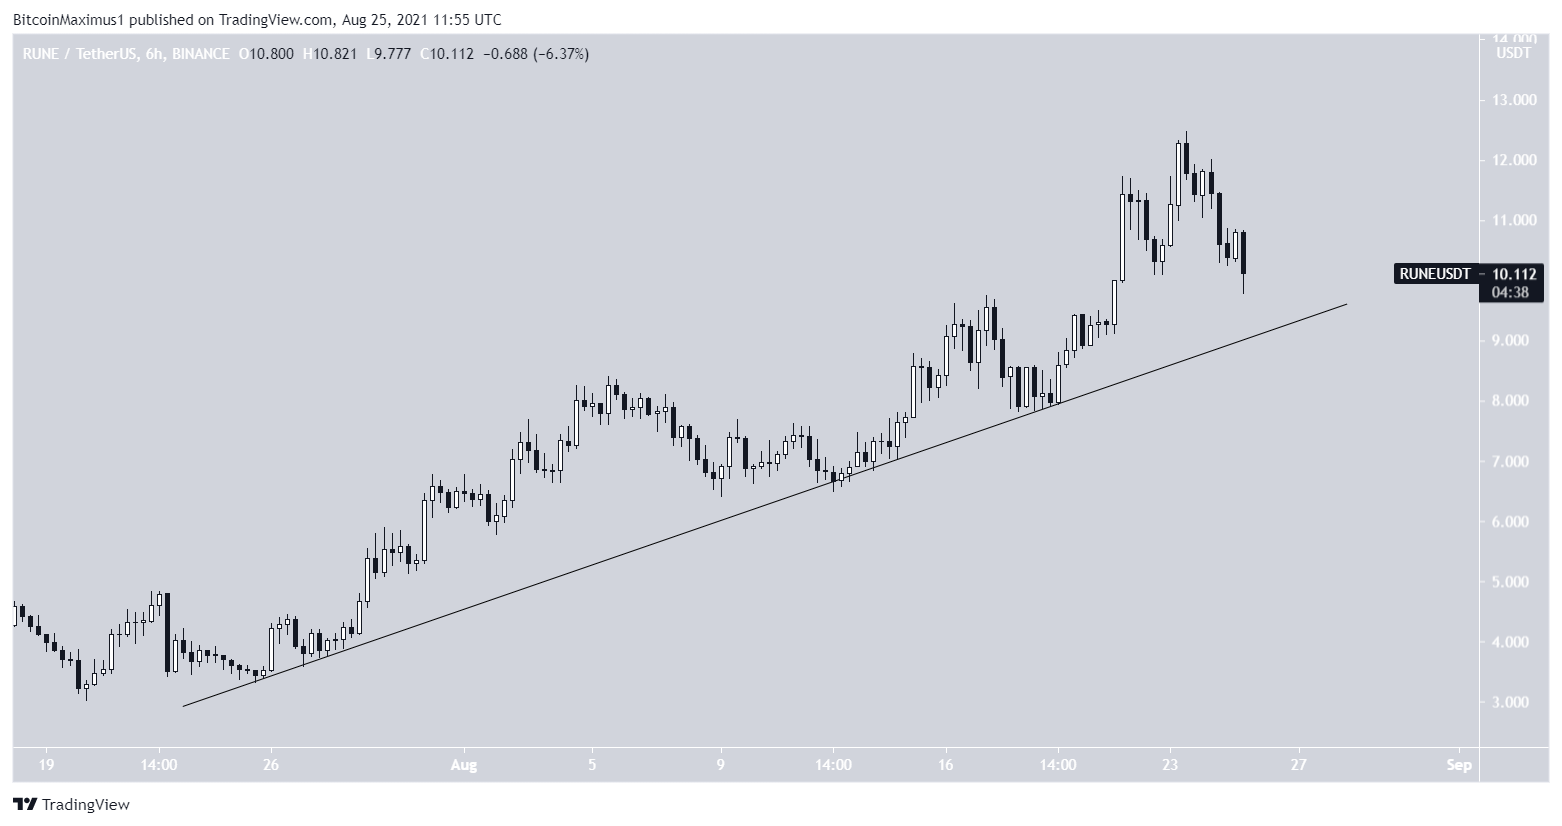
On June 20, RUNE bounced at the $3.80 horizontal support area and broke out from a descending resistance line. As a result, it continued to increase until Aug. 23, when it reached a high of $12.47.
However, it was rejected by the $12.10 resistance area, which is the 0.5 Fib retracement resistance level. This created a long upper wick and a bearish candlestick on Aug. 24.
Unlike in the case of BNB and UNI, there was no bearish divergence prior to the decrease.
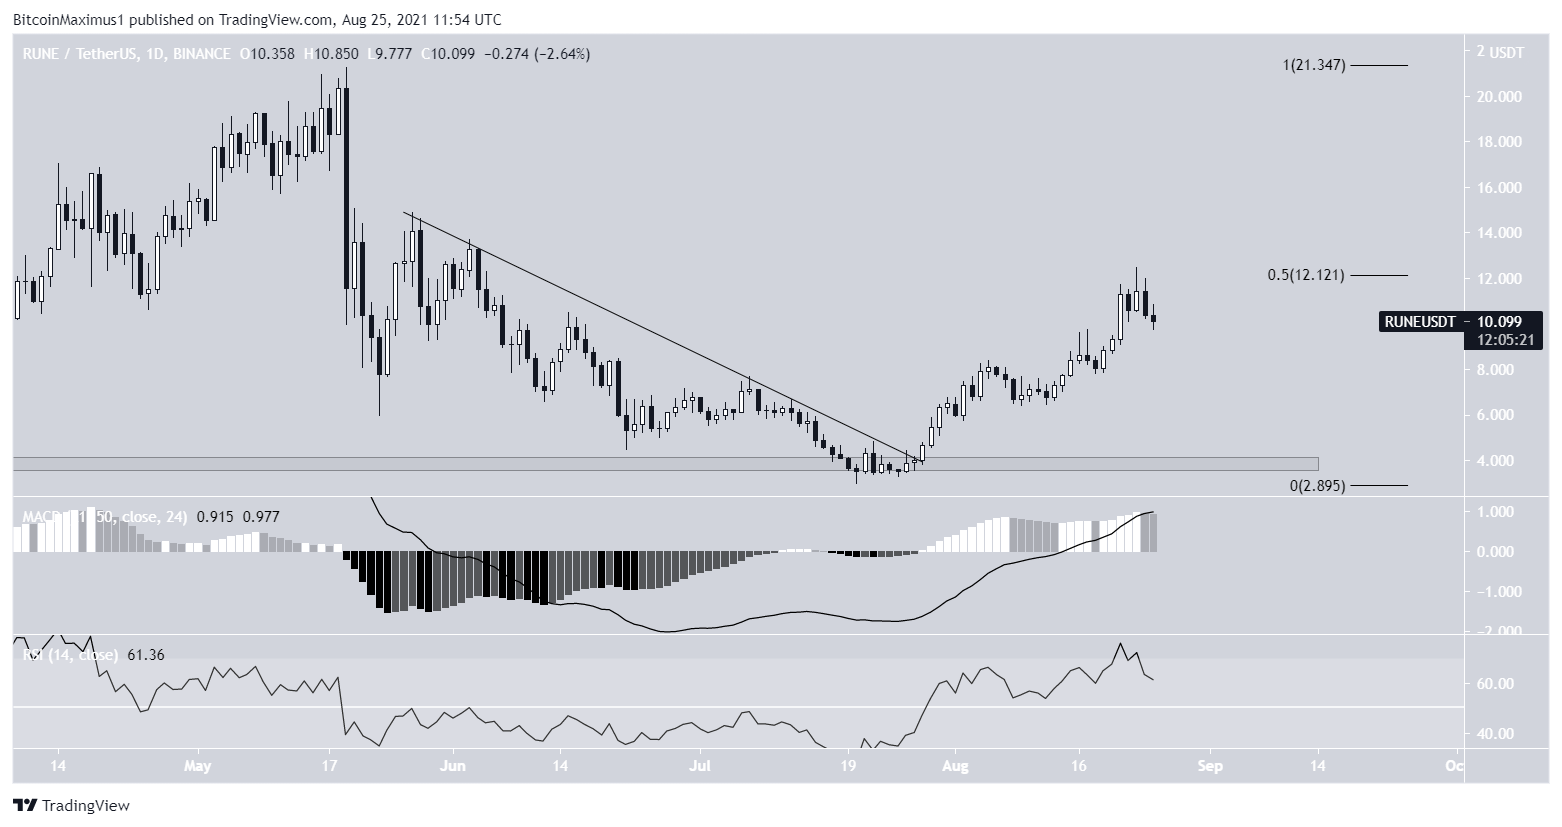
Despite the drop, the bullish structure is still intact, since RUNE is still following an ascending support line.
As long as it is doing so, the trend can be considered bullish.
Highlights
- RUNE is following an ascending support line
- It is facing resistance at $12.10.
For BeInCrypto’s latest Bitcoin (BTC) analysis, click here.
