


The Ethereum (ETH) price has broken out from a long-term resistance line, indicating that it has begun a bullish trend. However, the upward move is showing considerable weakness.
A short-term retracement could occur before the price resumes its upward move.
Ethereum’s Breakout Ends Long-Term Correction
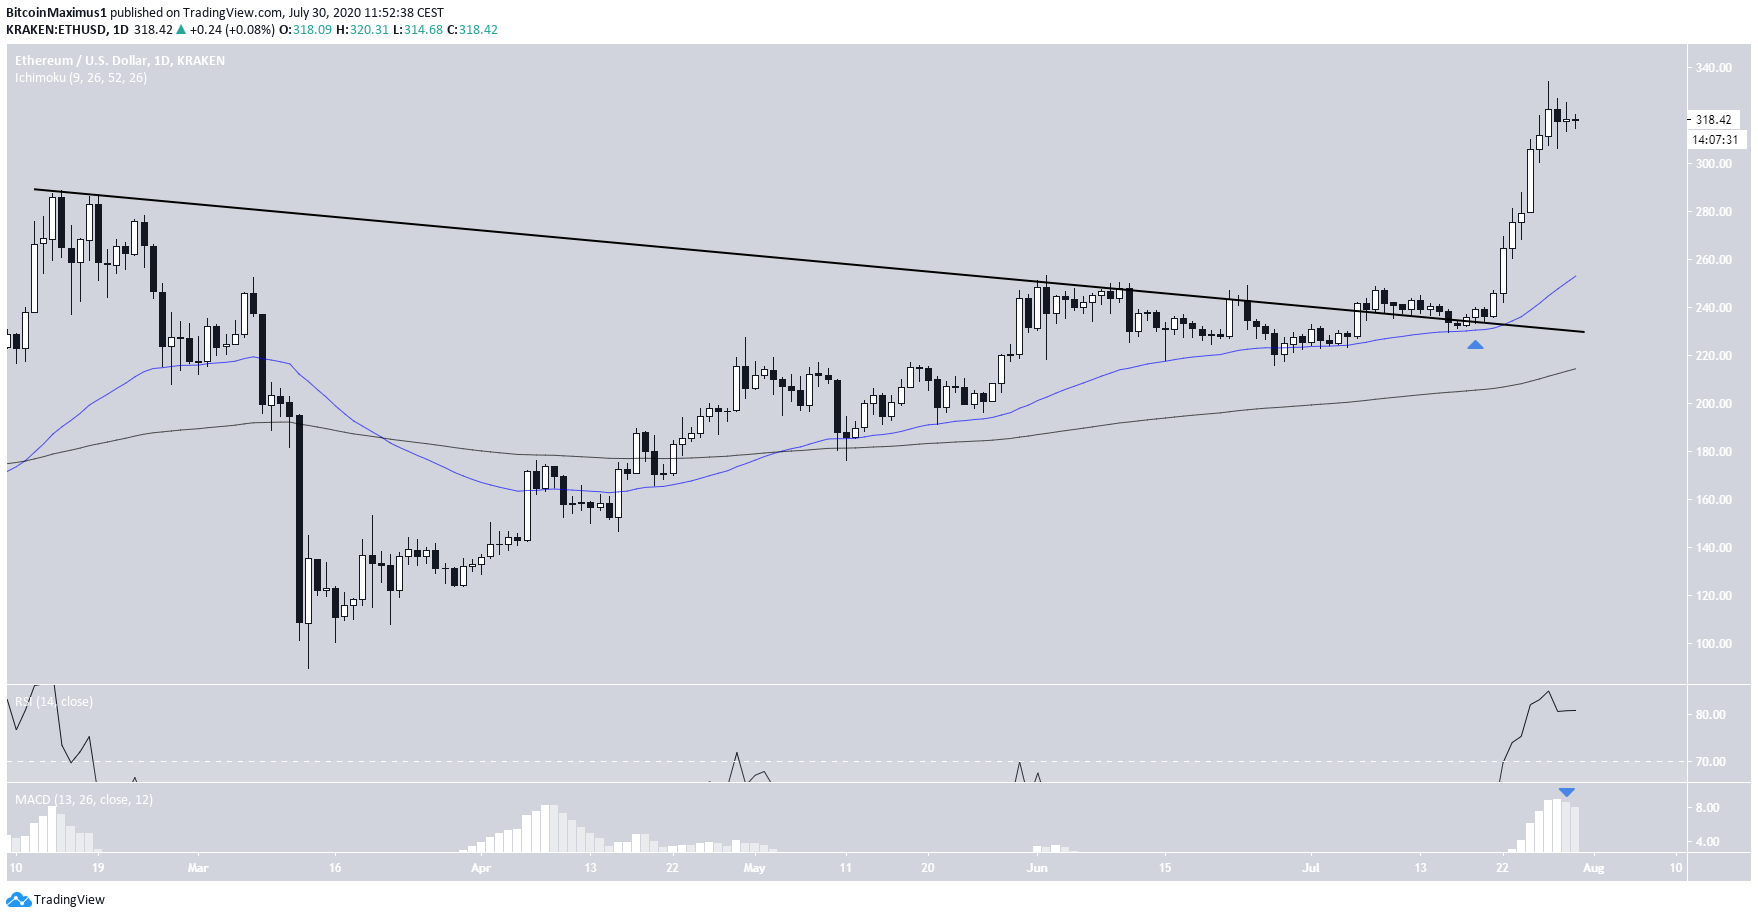
On July 6, the Ethereum price broke out from a descending resistance line that had previously been in place since February 2020. After validating the line again on July 17, the price has been rallying at an accelerated rate.
The resistance line now turned support also coincided with the 50-day moving average (MA). The MA will now likely act as support, further strengthened by the previous bullish cross it made with the 200-day MA.
Technical indicators hint at weakness in the trend. The RSI is heavily overbought and has begun to fall. In addition, the MACD shows declining volume, a sign that the momentum is declining.
Direction of the Next Movement
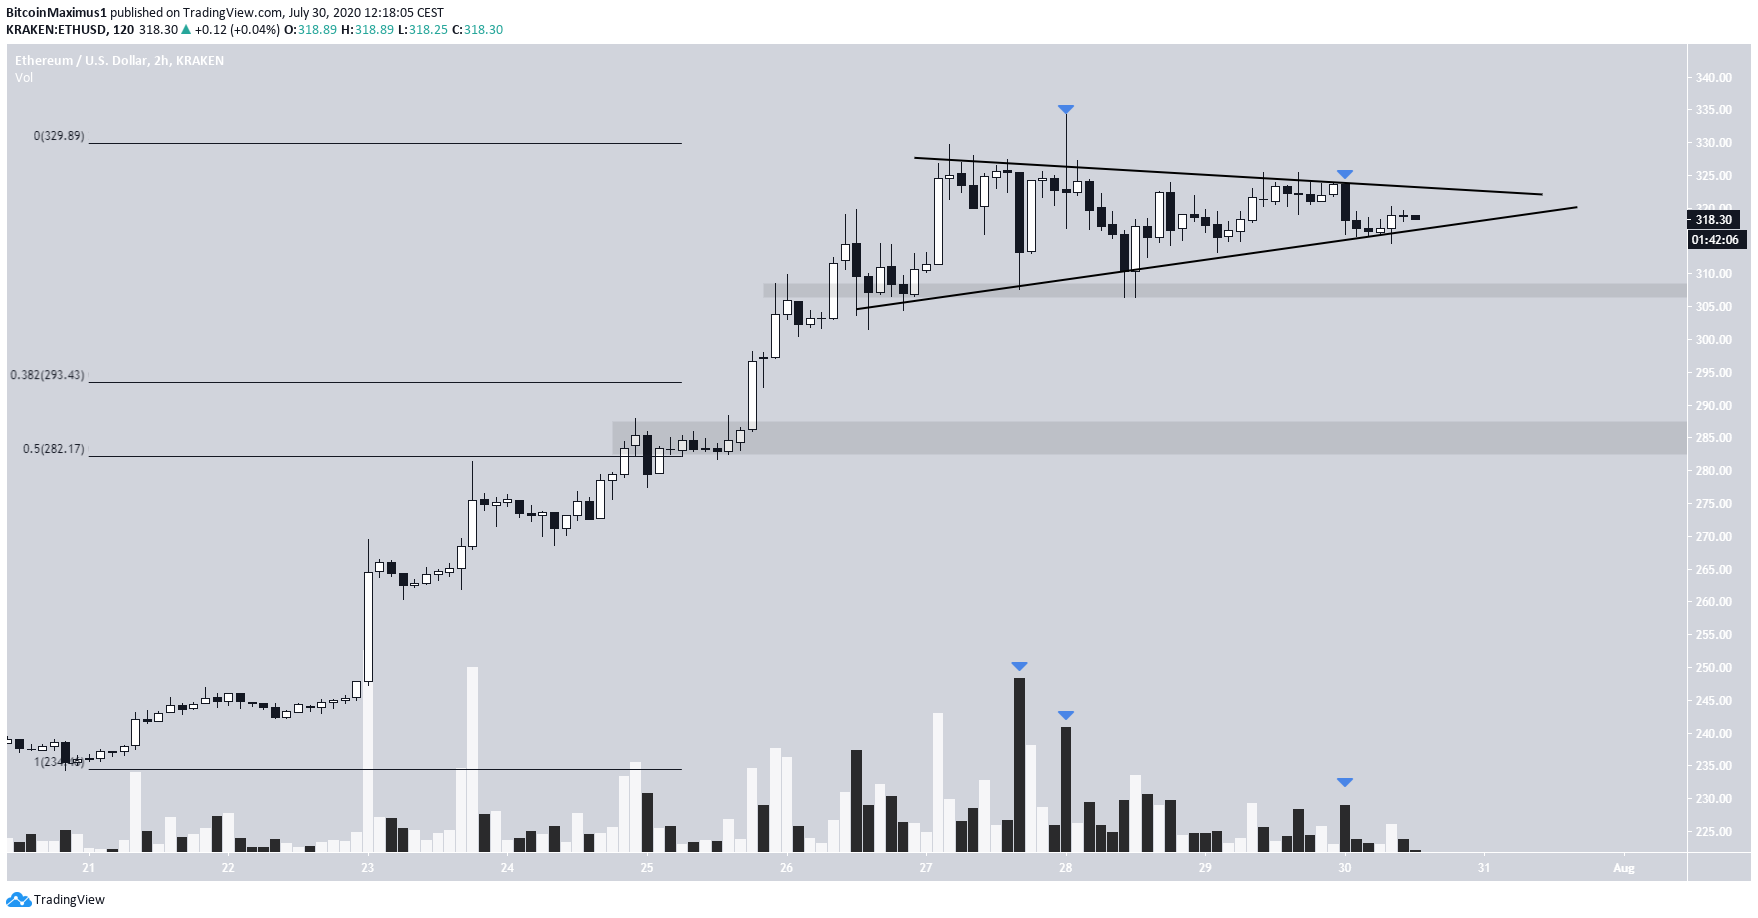
Cryptocurrency trader @RookieXBT outlined an Ethereum chart showing the price trading inside a symmetrical triangle. It highlights two possibilities here: bearish and bullish.
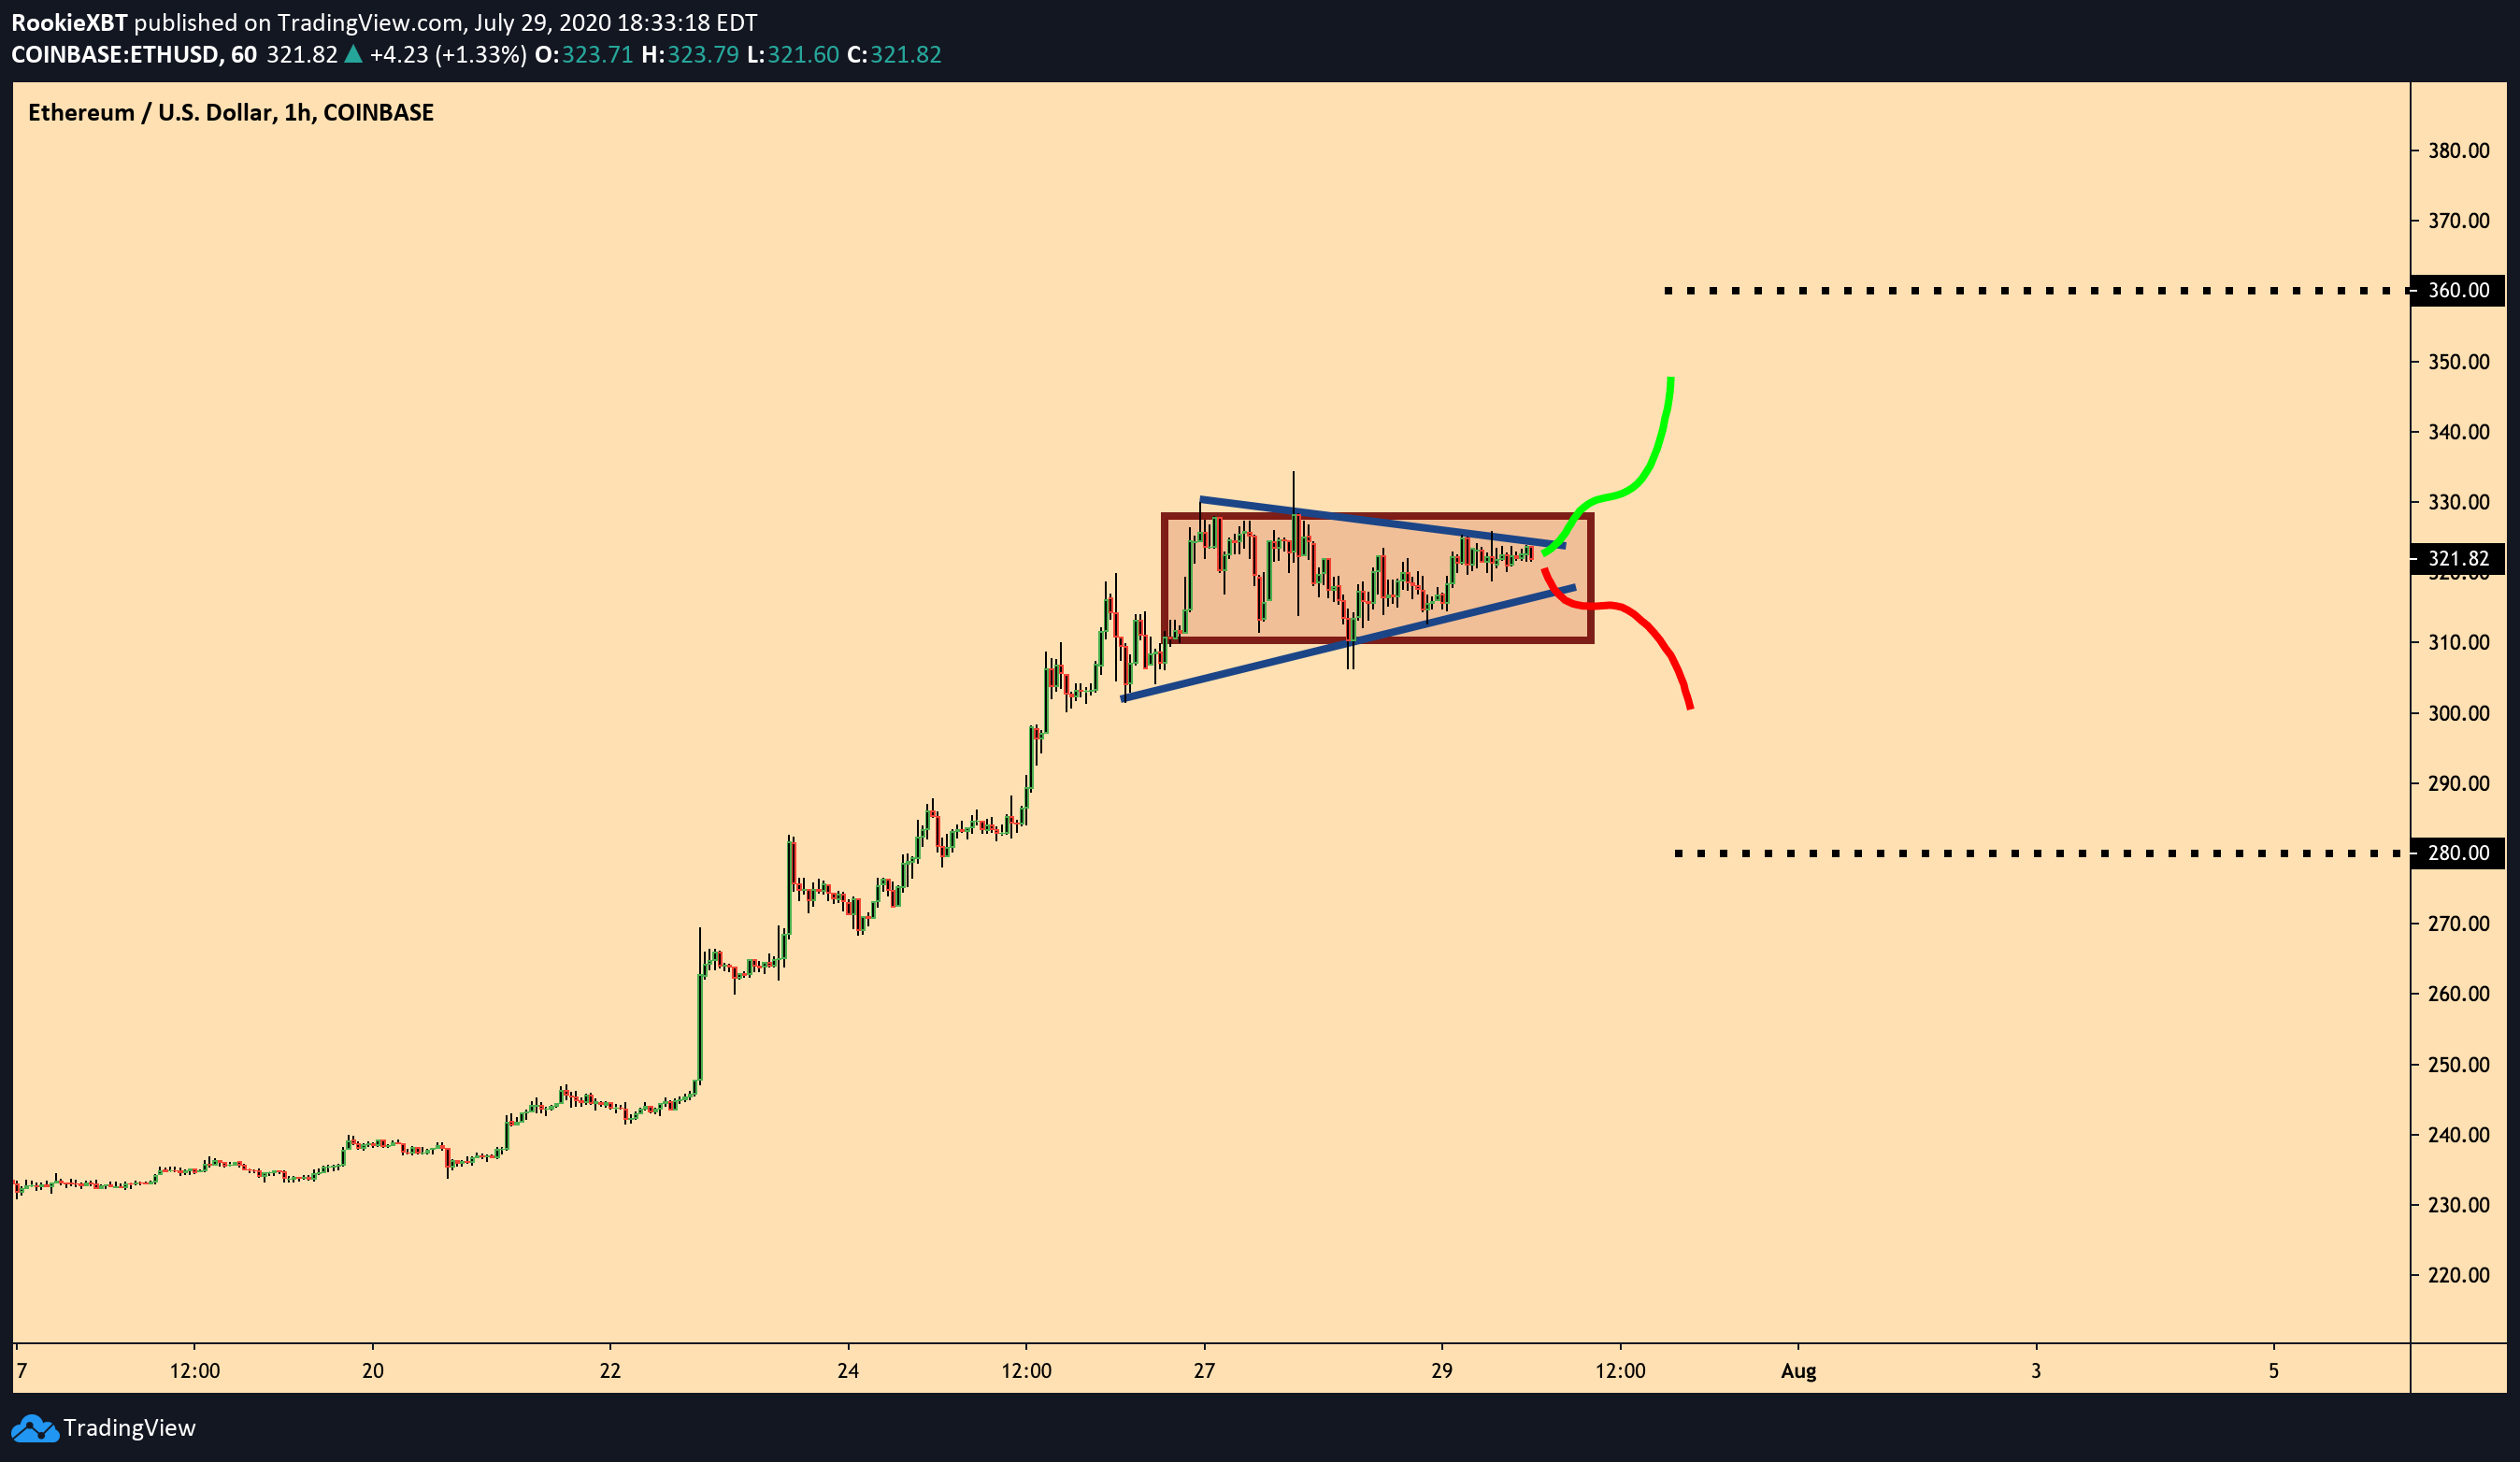
Last night, the resistance line of the triangle rejected the price, creating a bearish engulfing candlestick.
Since the bearish doji that swept the highs on July 27, the bearish candlesticks have been bigger in size and have had more volume than their bearish counterparts.
This is a sign that the bears are taking control. Therefore, combining this with the bearish signs from the daily chart, we can assume that the price will break down from the triangle.
If so, the closest support areas are found at $307 (minor), and a major support area at $285, which is the 0.5 Fib level of the entire rally.
ETH/BTC
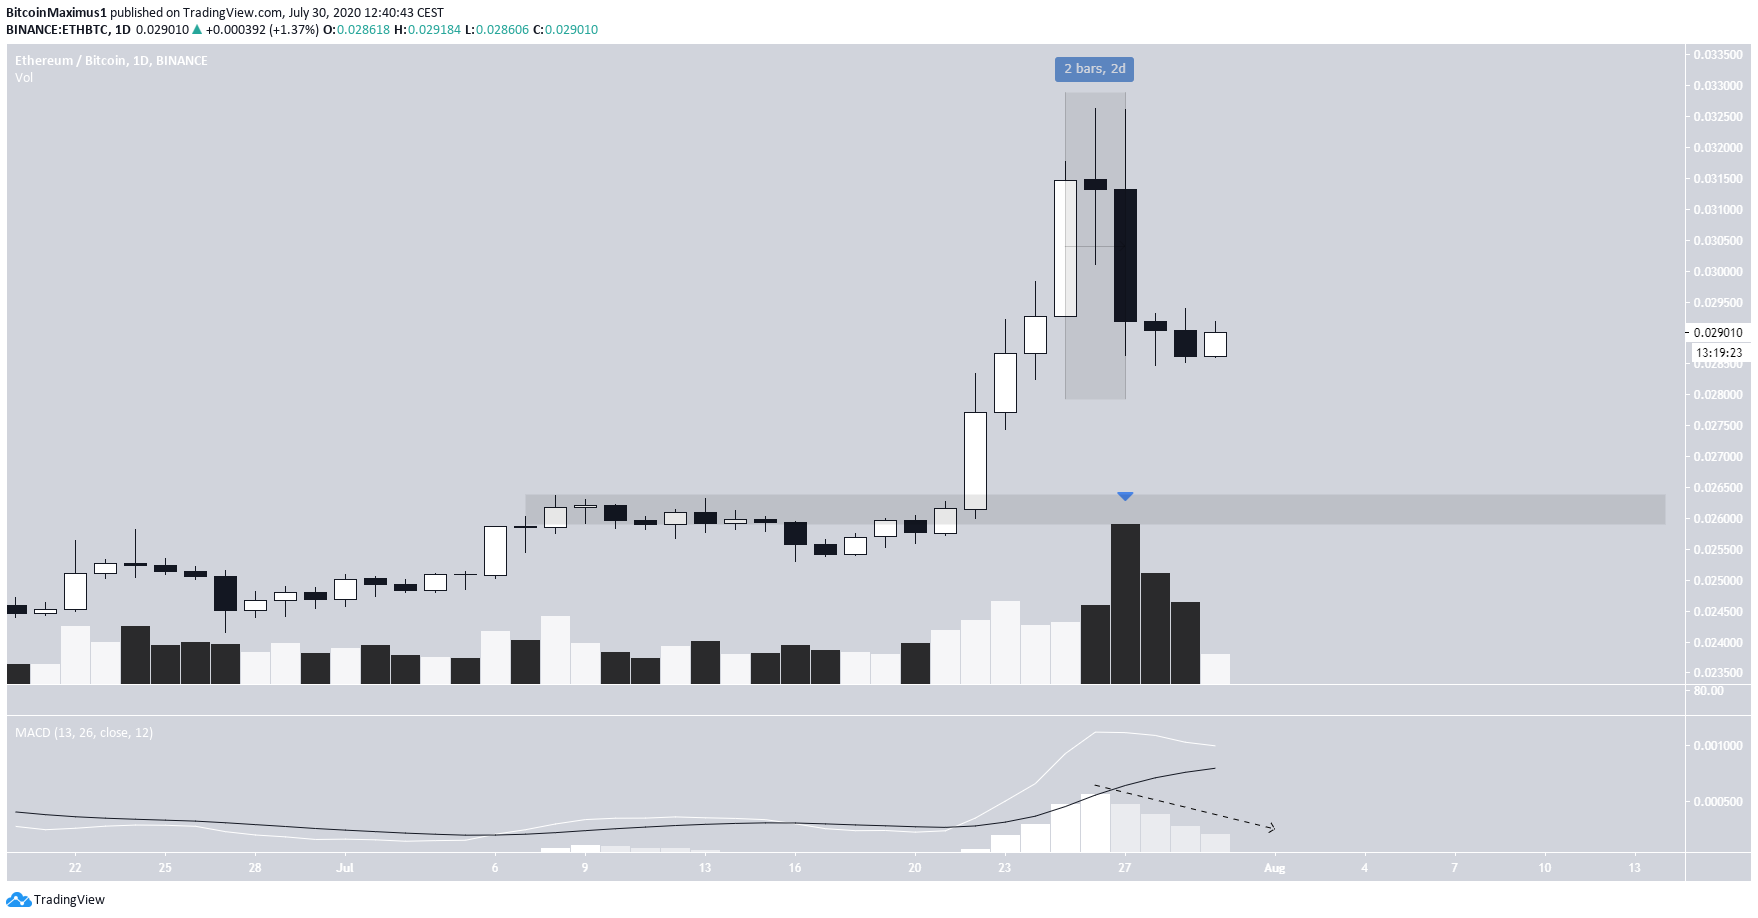
The ETH/BTC pair shows a more significant decline after the rally. The price has completed an evening star, a three candlestick pattern that is a bearish reversal. The third candlestick, which was a bearish engulfing one, took place on significant volume.
In addition, the MACD has been showing decreasing momentum for the fourth straight day, and a bearish cross is on the verge of happening.
If the price continues to decline, the closest support area is found at ฿0.0260, the previous breakout level.
To conclude, while Ethereum has likely begun a long-term bullish trend, a short-term retracement is expected before the price resumes its upward move.


