


The ethereum (eth) price reached a new all-time high of $1,475 on Jan. 25 but has declined slightly since.
Eth seems to have found short-term support and is likely to resume its upward movement soon.
All-Time High Price
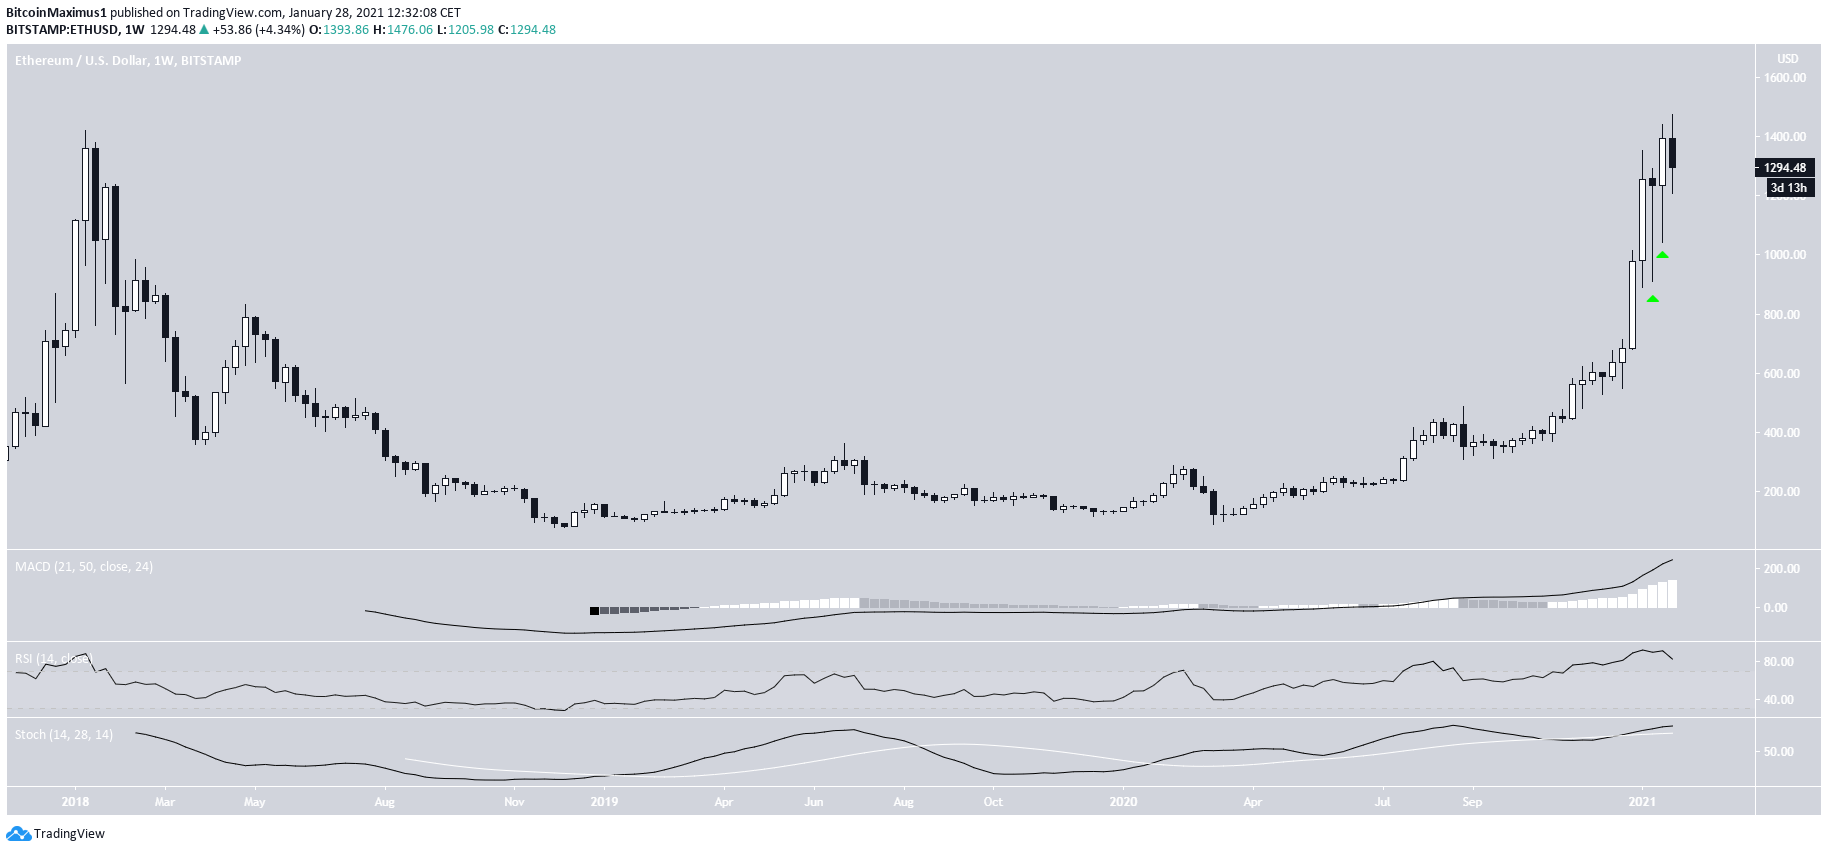
On Jan. 25, 2021, eth reached a new all-time high price of $1,475, just slightly above the previous one at $1,391.
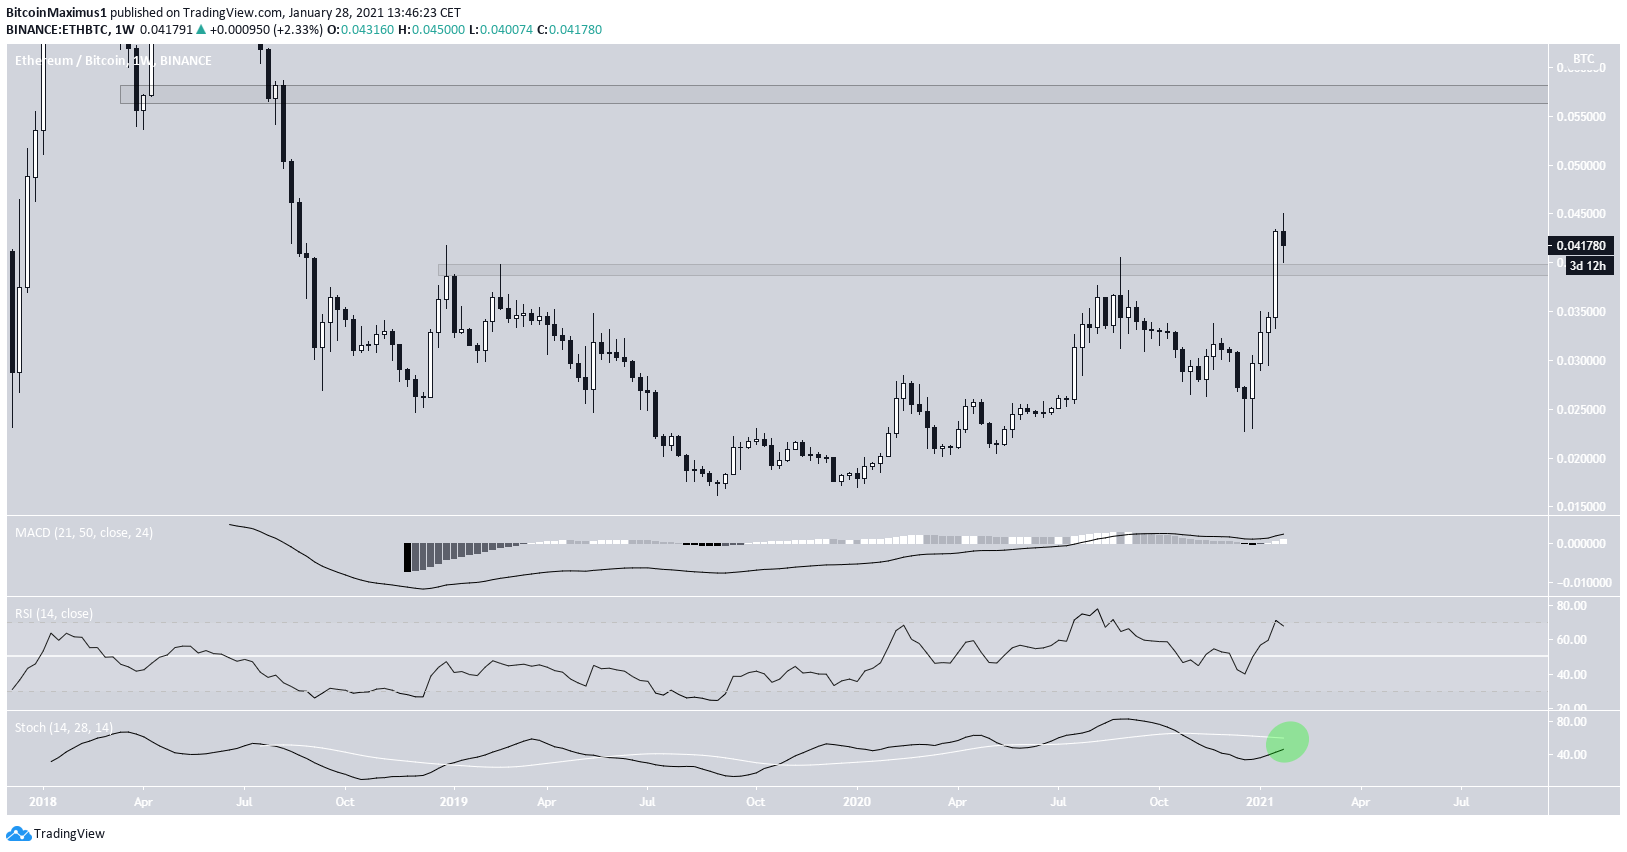
The weekly chart shows that even though the rally has become parabolic, there are no clear signs of weakness. All three of the: MACD, RSI, and the Stochastic Oscillator are bullish.
Furthermore, the most recent two weekly candlesticks have had long lower wicks, a sign of buying pressure. Therefore, despite the parabolic rate of increase, it’s likely that the trend is still bullish.
Daily Movement
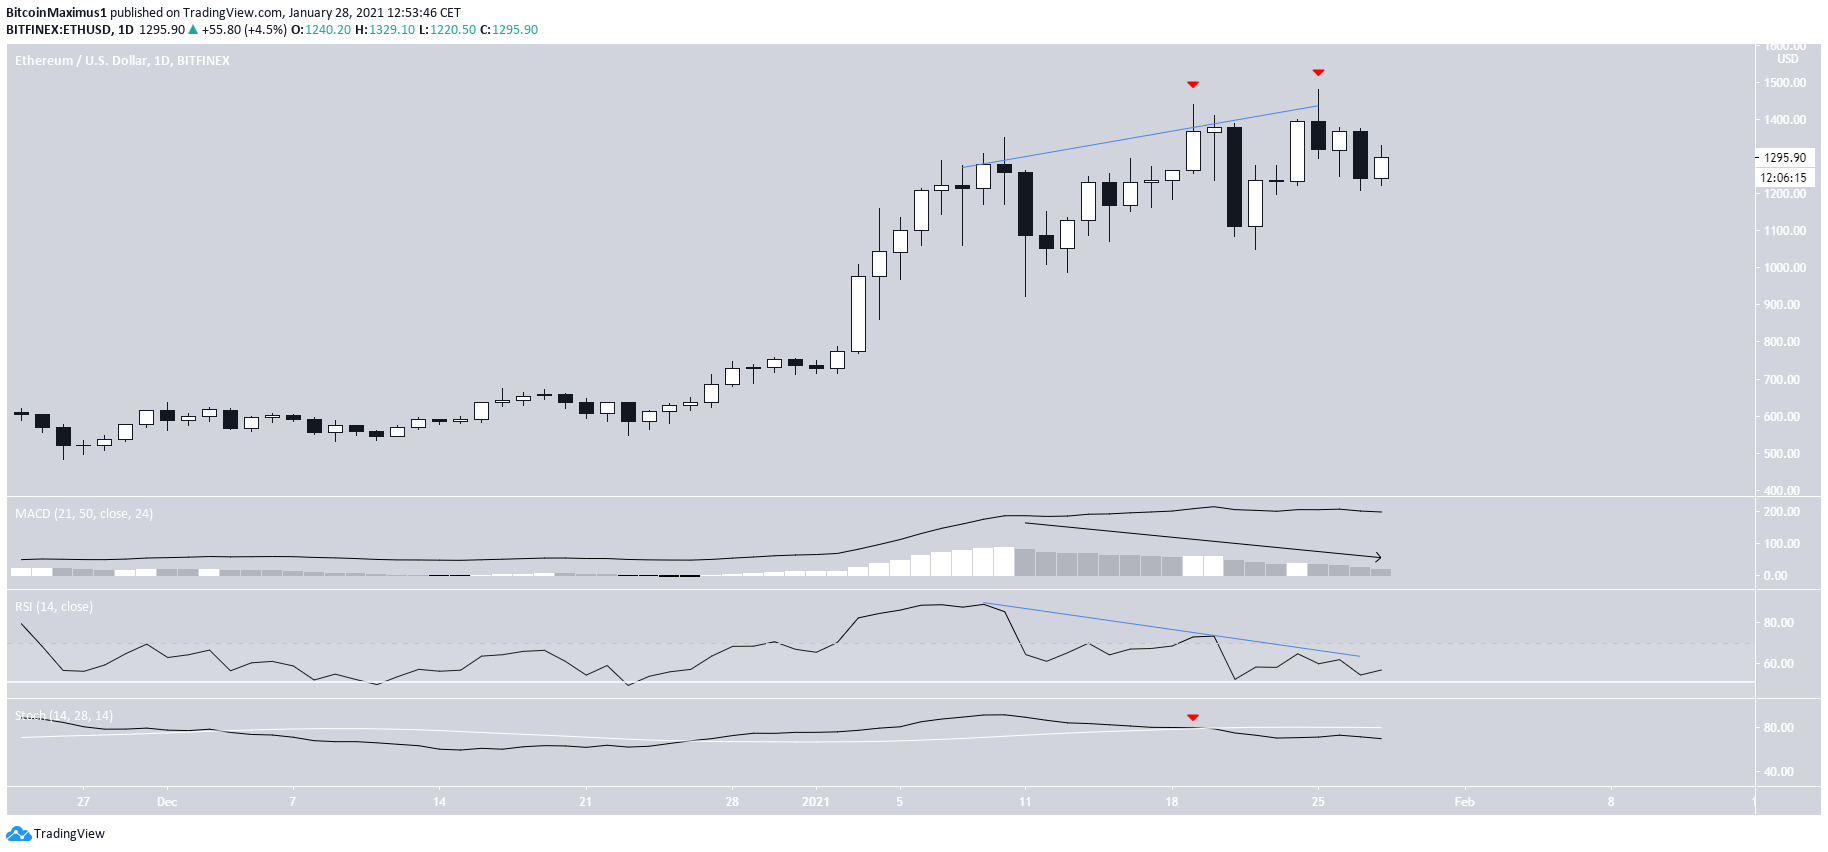
The daily chart shows a possible double top pattern, including a significant bearish divergence in the RSI and a shooting star candlestick.
Furthermore, the MACD is falling, and the Stochastic Oscillator has made a bearish cross, suggesting indicators on the daily time-frame are bearish.
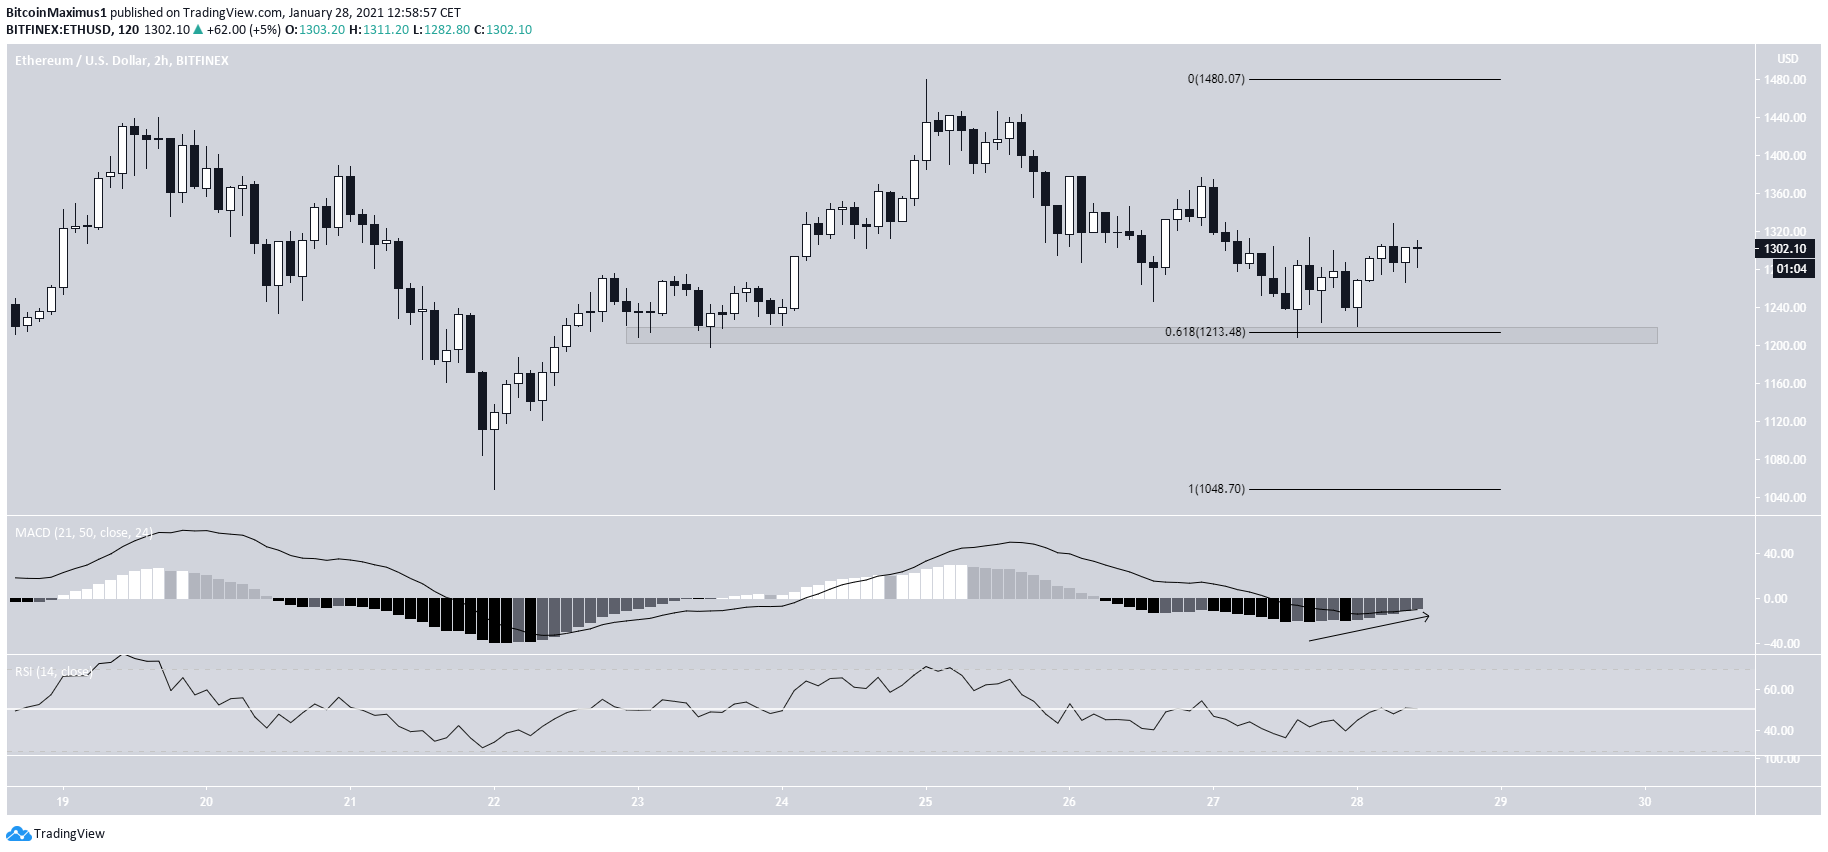
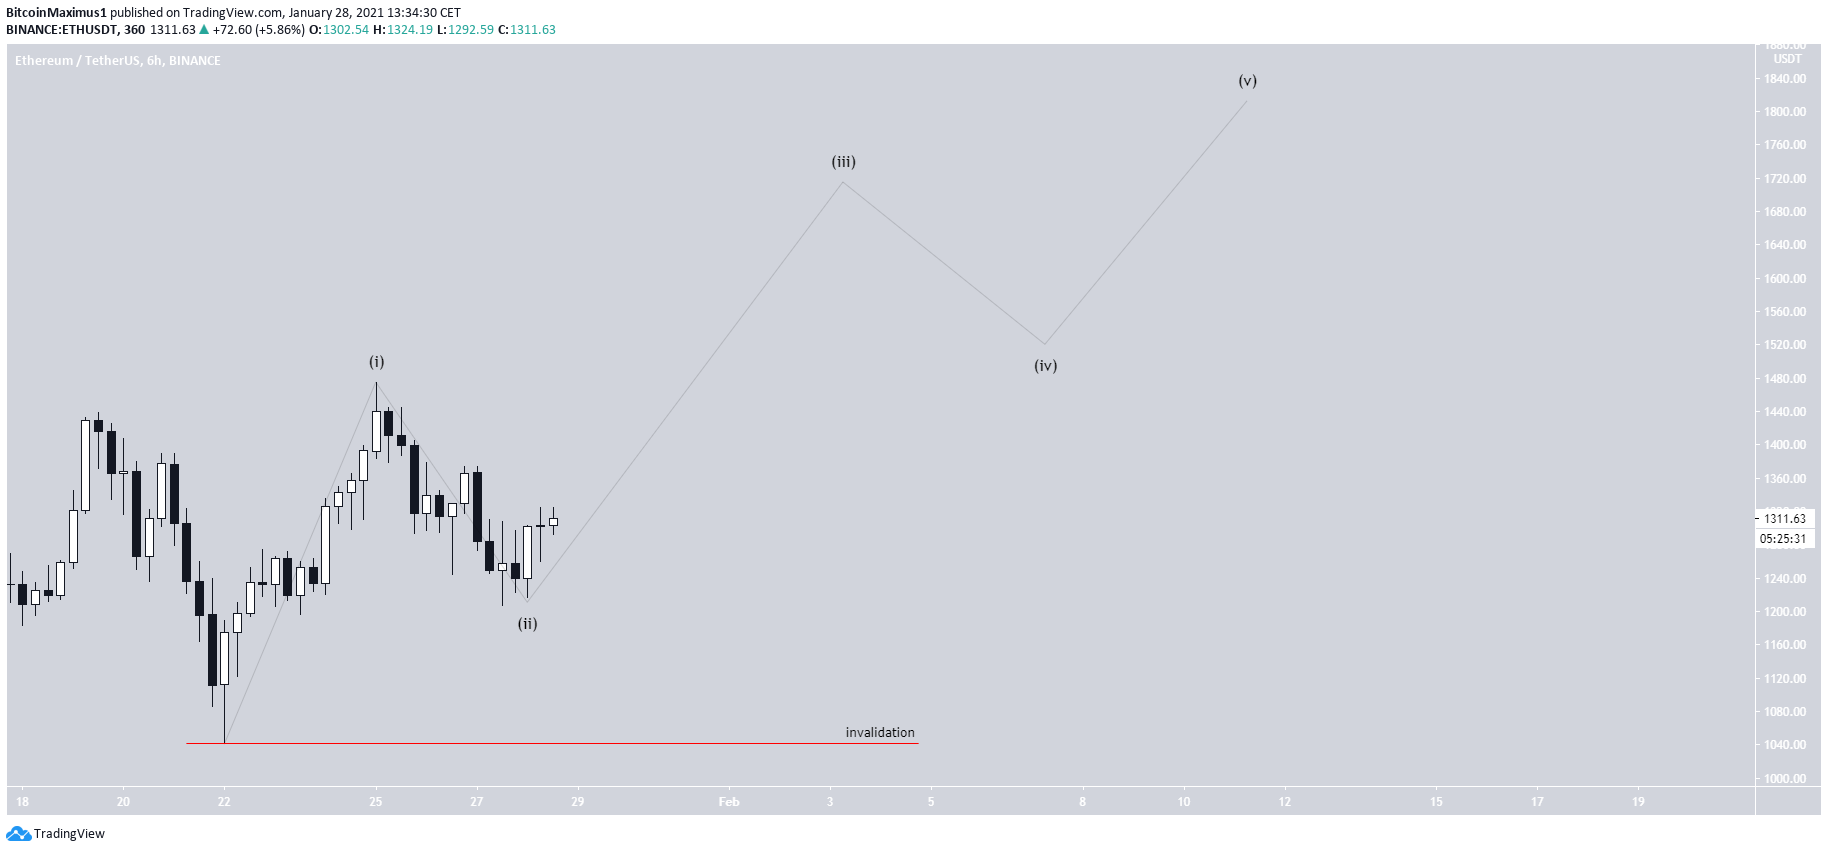
However, the shorter-term two-hour chart shows that a decline has already occurred due to the double top. The decline ended right at the 0.618 Fib retracement level, where eth bounced and is now moving upwards.
Short-term indicators have turned bullish, suggesting that the continuation of the upward move is likely.
Wave Count
Cryptocurrency trader @Incomesharks outlined a chart, stating that the price will reach $1,800 by the end of March.
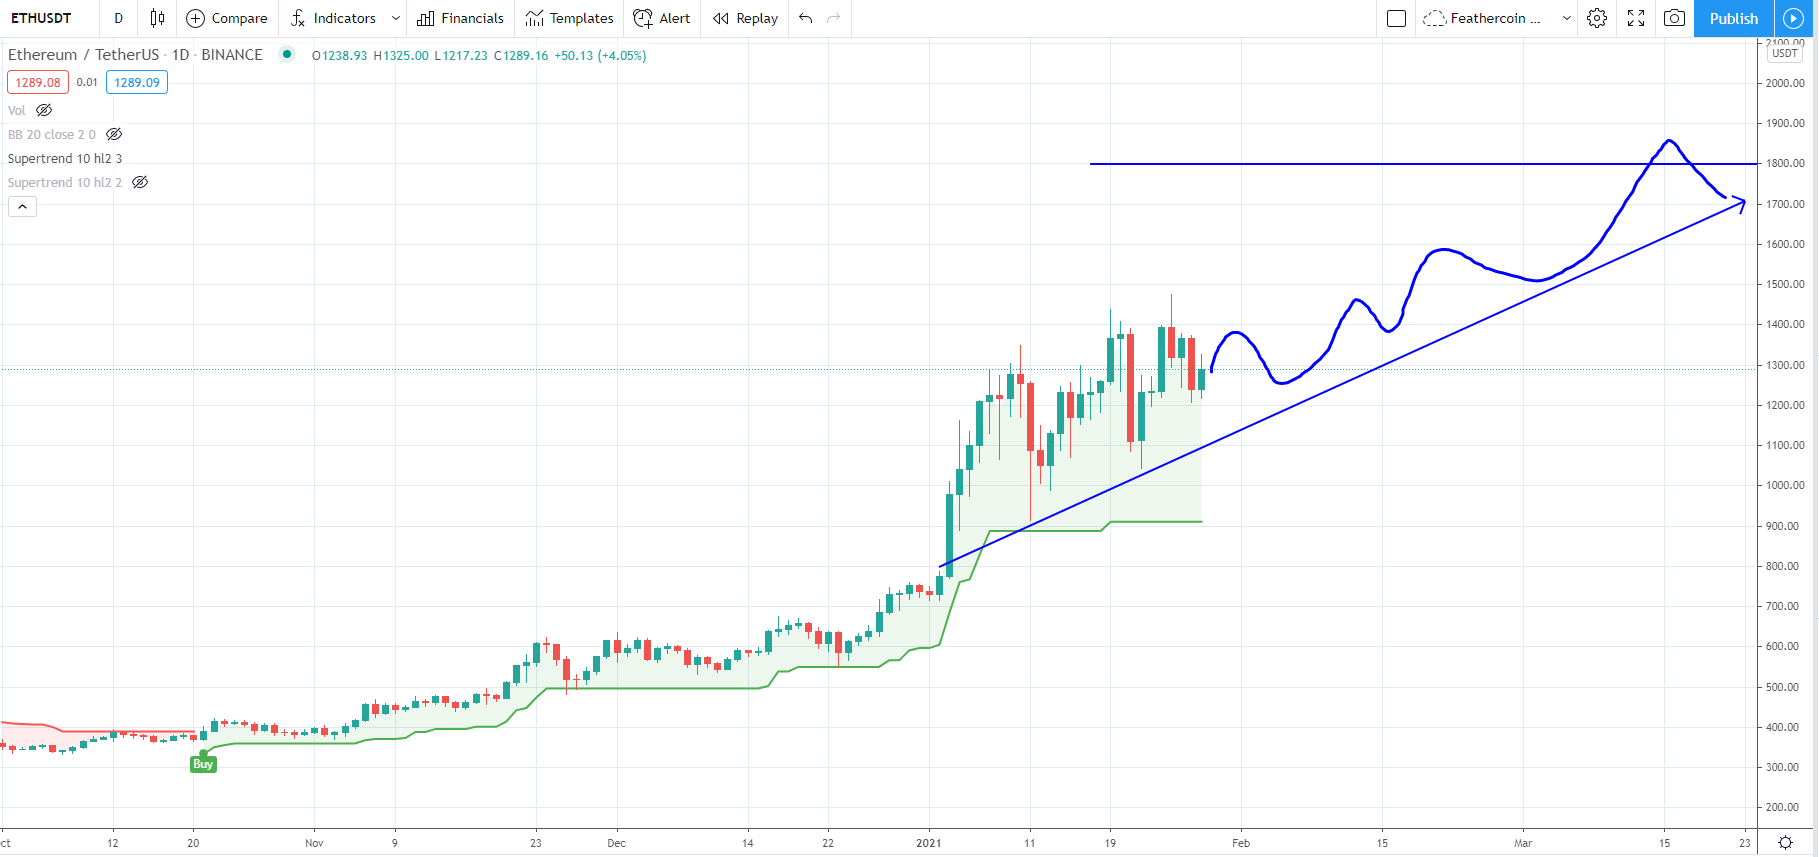
The most likely wave count suggests that it has completed wave four of a bullish impulse (white), which began with the March lows and has now begun wave five.
Wave four was a running flat corrective structure. A likely target for the top of wave five is between $1,760 and $1,787, the 4.61 Fib extension of wave one and the 0.618 Fib projection of the length of waves one and three. This also fits with the target provided in the tweet.
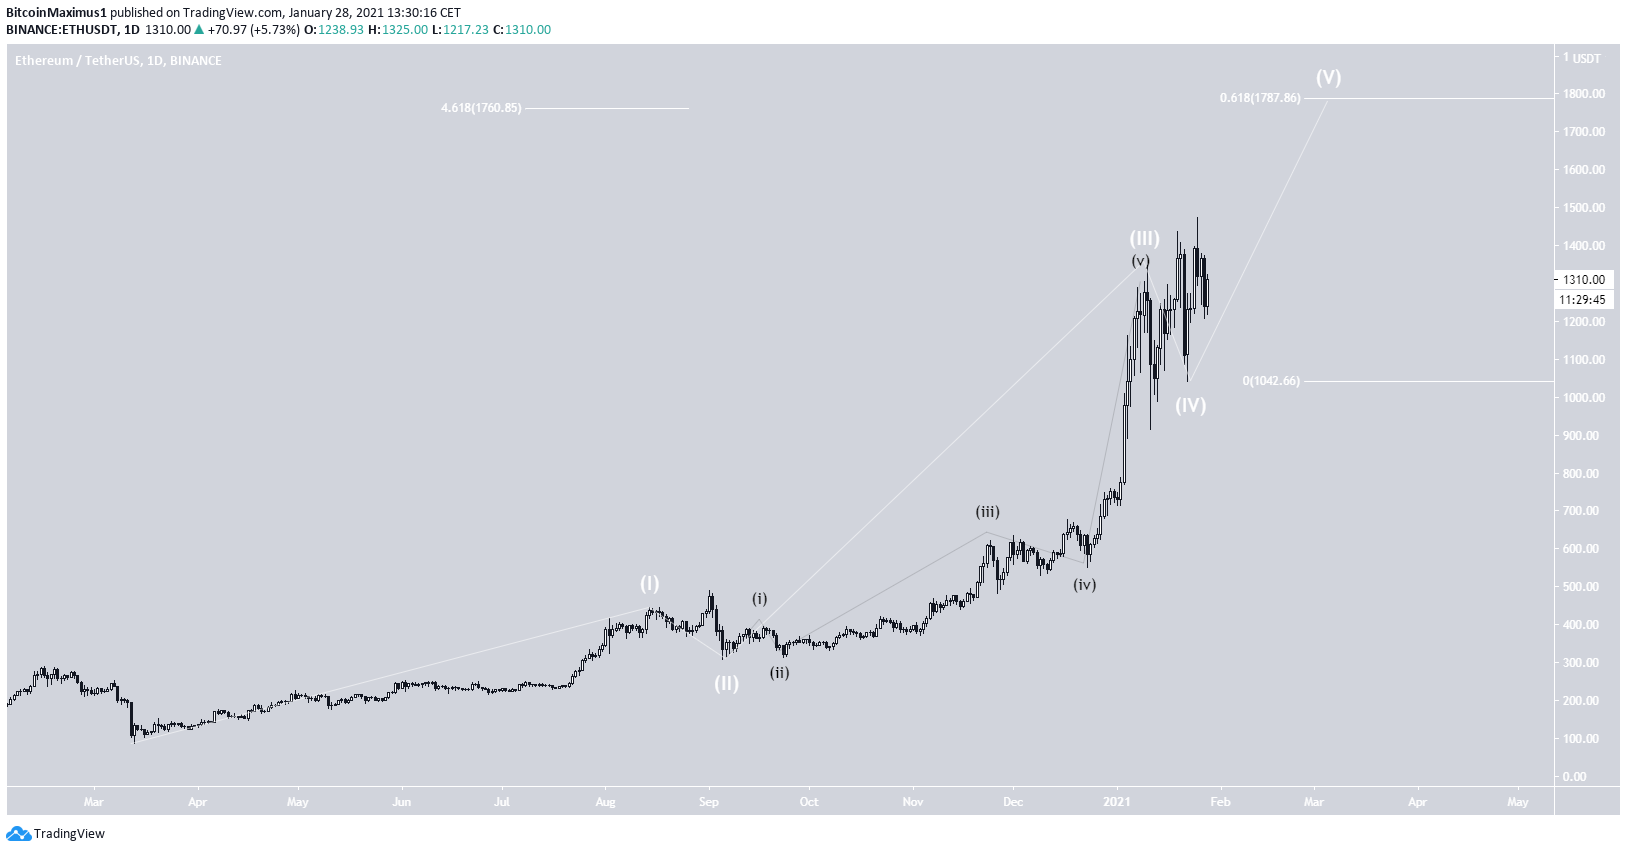
The sub-wave count for the final wave indicates that sub-waves one and two have been completed, and eth has now begun sub-wave three.
A fall below the sub-wave one low at $1,042 would invalidate this particular wave count.
ETH/BTC
The ETH/BTC chart is bullish in almost all time-frames. Eth has reclaimed the ₿0.0395 resistance area and is now gradually moving towards the next resistance at ₿0.057.
Technical indicators support the possibility of a continued upward move that would take eth to the next resistance area at ₿0.057
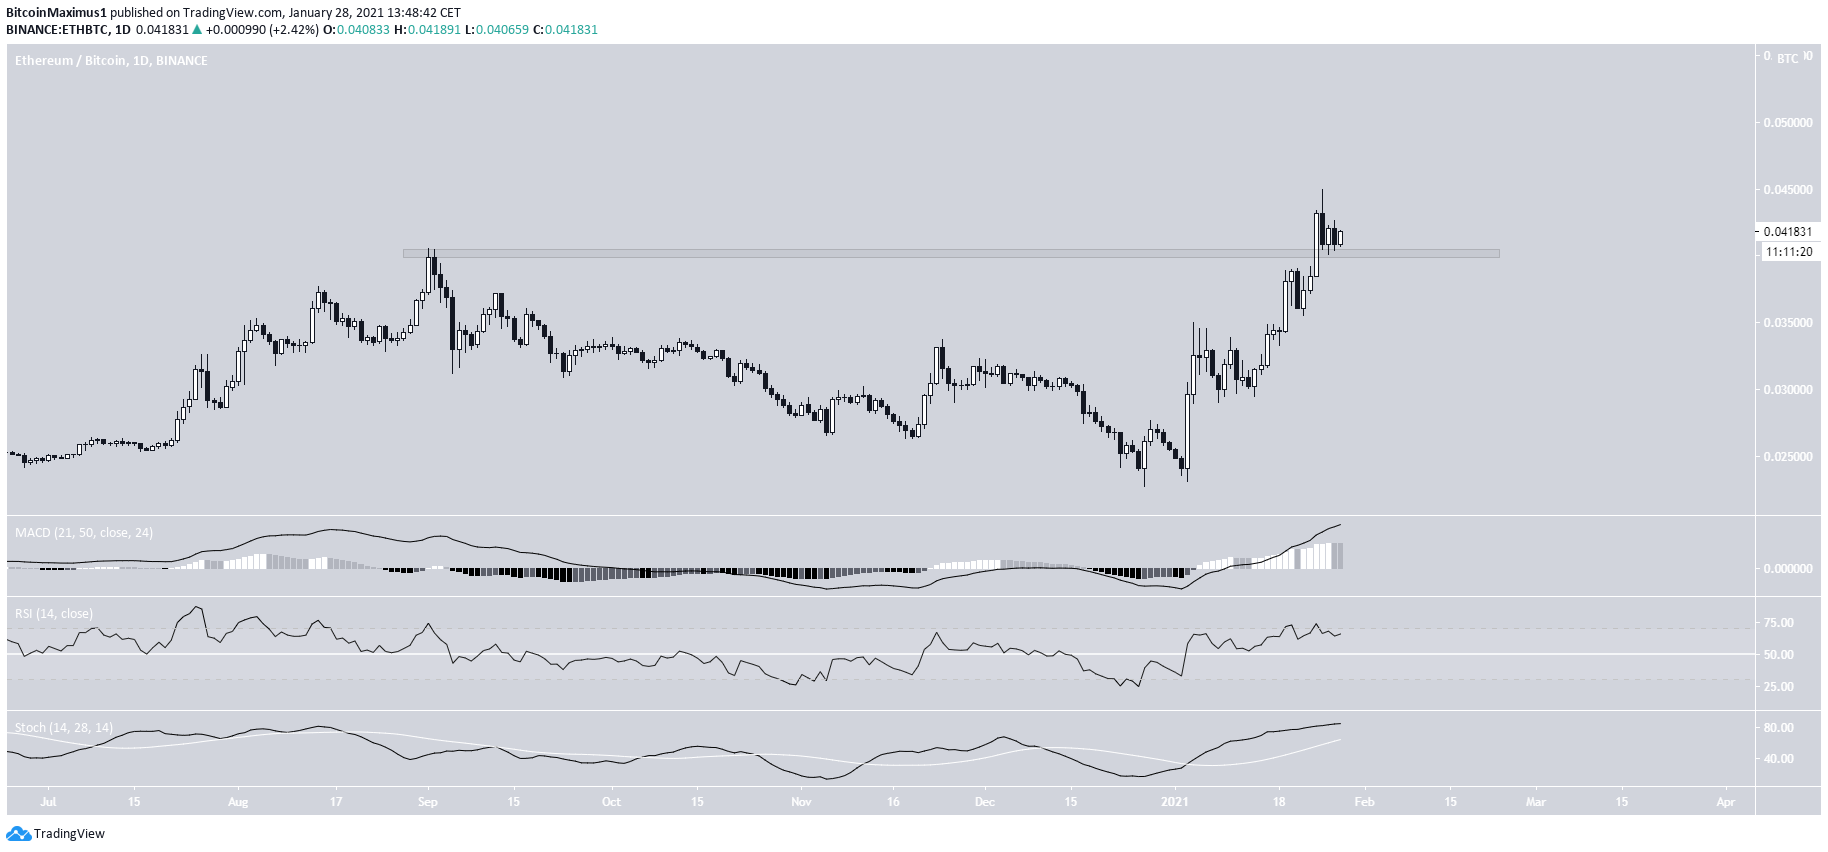
The daily chart also provides a similar picture, with eth just breaking out from and retesting the ₿0.0395 area. Technical indicators are similarly bullish.
Conclusion
To conclude, the chart for both eth/usd and eth/btc seem bullish. Eth/usd should increase towards $1,800 while eth/btc towards ₿0.057.
For BeInCrypto’s latest Bitcoin (BTC) analysis, click here


