


Ethereum is the second-largest cryptocurrency when ranked by its market capitalization. It made headlines on Monday when its co-founder was spotted in the company of several Chinese investors and internet moguls. This could have been the reason for a nearly 10 percent increase in the price of the altcoin.
However, despite this price spike, Ethereum has been on a downward trend for the prior 110 days.
Crypto trader @smartcontracter pointed out that the Ethereum four-hour chart looks bearish while outlining a possible downward path for the price.
i think @CredibleCrypto is onto something here, eth looks like shit.
ethbtc printed a nasty 4h candle aswell, eth might be the play of the day pic.twitter.com/q1e2DMG8oo
— Bluntz (@Bluntz_Capital) October 15, 2019
According to him, the price is ready to make a downward move towards $170.
While the short-term wave count seems correct, we want to look at the longer-term price action to decide the Ethereum price outlook and find a target for the end of the downward move.
Ethereum Wave Count
Looking at the price movement since Ethereum reached a low of $83 on December 7, 2018, we believe the ETH price has finished a five-wave upward move when it reached a high of $363 on June 26, 2019.
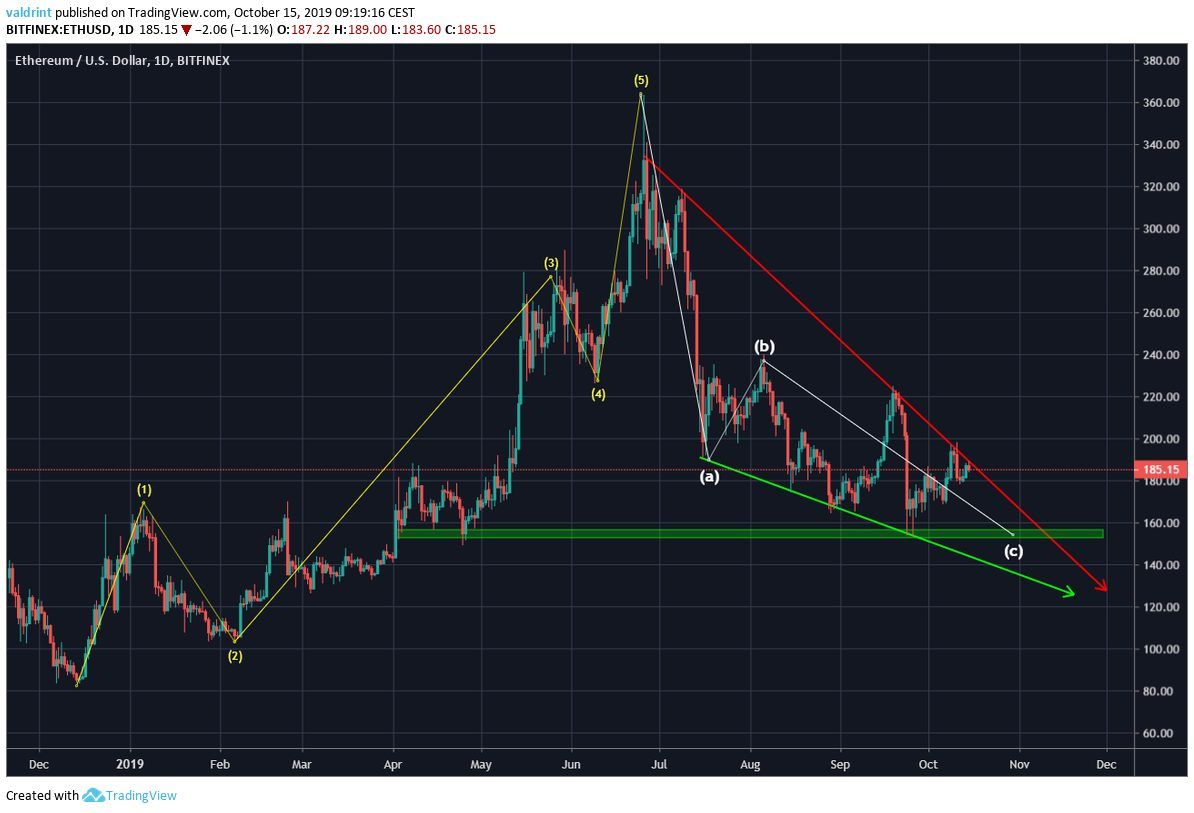
Since then, the Ethereum price has been trading inside of a descending wedge. The descending wedge is a bullish pattern, making a price breakout more likely. While inside its confines, ETH has either finished the final corrective C-wave or is very close to doing so.
However, it is also right at the resistance line of the pattern. Therefore, even though the wedge is a bullish pattern, we could definitely see an extension of the downward leg towards the support area if the price does not break out immediately.
Moving Averages
When we look at the daily moving averages (MAs), the possibility of a breakout is greatly reduced.
The 100- and 200-day MAs have just made a bearish cross and are providing close resistance to the price.
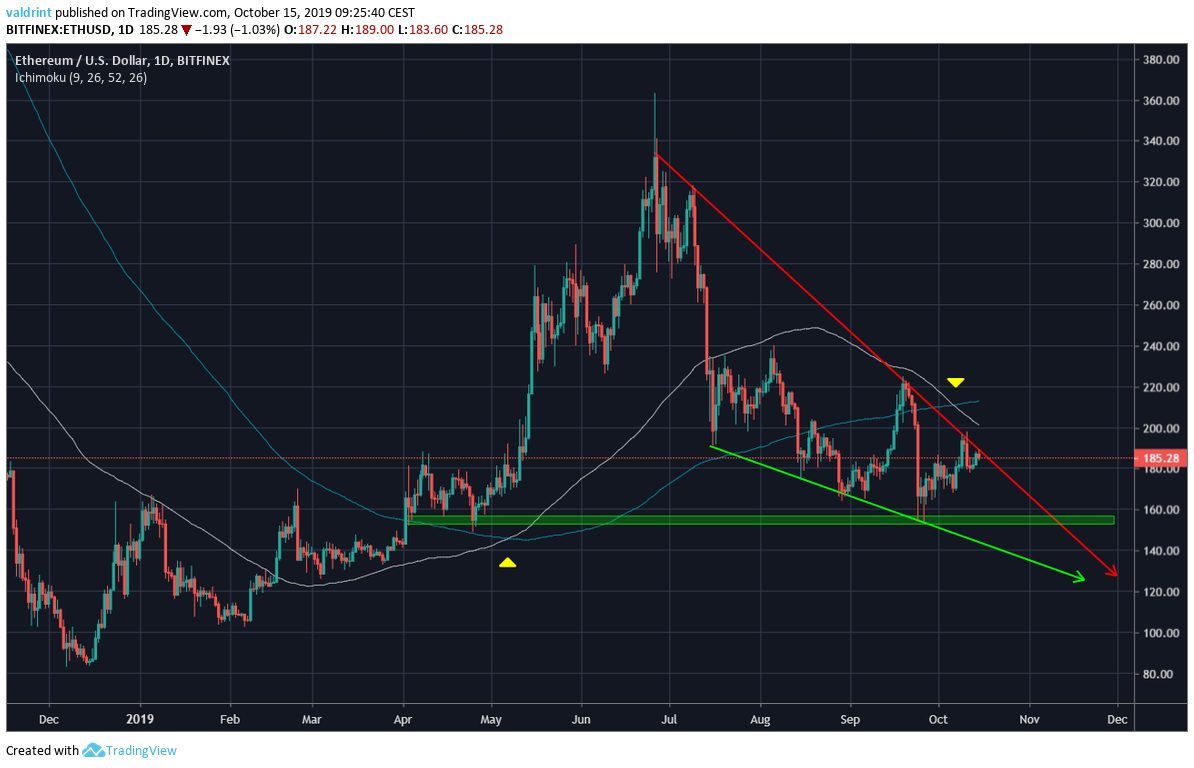
A bullish cross between the two MAs occurred in May and preceded an increase of more than 100 percent.
The current bearish cross could very well be a precursor to a similar decrease. However, due to the support area outlined near $160 and the projected end of the wedge, we do not believe this decrease will have the same magnitude.
What Will Happen?
Looking at the four-hour chart to which @smartcontracter alluded to, we can see a short-term ascending support line. Combining it with the descending resistance line from the wedge, we get a symmetrical triangle which is projected to end in two days.
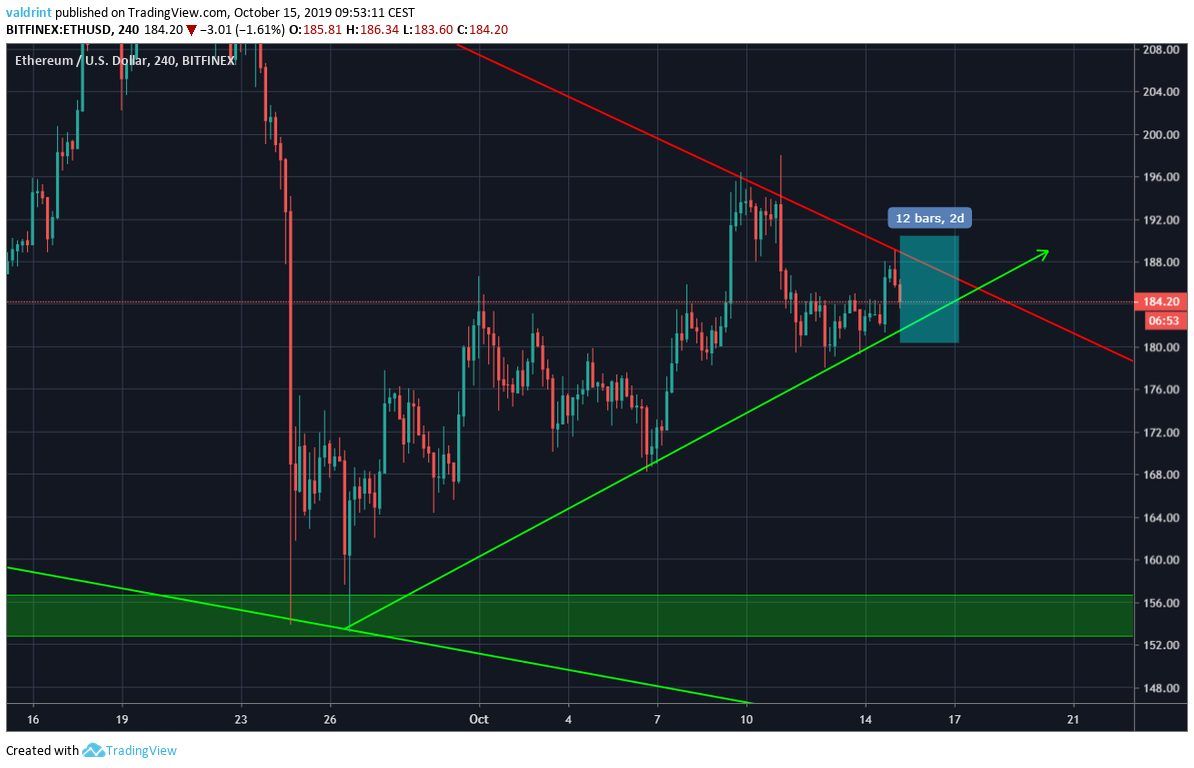
A decisive move should occur by that time.
Based on our long-term analysis, we agree with the statement made by @smartcontracter that the price is likely to initiate a downward move.
Do you think Ethereum will break out or will it decrease towards the support area? Let us know in the comments below.
[Disclaimer: This article is not trading advice and should not be construed as such. Always consult a trained financial professional before investing in cryptocurrencies, as the market is particularly volatile.]


