


The cryptocurrency market has been increasing throughout 2019. This increase has been more pronounced in the Bitcoin price rather than altcoins, like Ethereum — causing the BTC dominance rate to increase.
Bitcoin’s market dominance rate has been higher than 50 percent throughout most of the assets price history, excluding a period in 2017/2018. Its price initiated a rapid increase on October 25 but has been decreasing since then. On the contrary, several altcoins have followed the October 25 increase with more bullish action. This has caused many to call for the beginning of “altseason”.
The Bitcoin dominance rate is currently at a significant support area and a break below it could trigger a rapid downward move.
Cryptocurrency trader @paddystash stated that the chart for the Bitcoin dominance rate is “looking awful.” A flip of the current support area would likely indicate a rapid decrease.
https://twitter.com/paddystash/status/1196135942802857984
Also, he states that the Ethereum price will increase over its current resistance — aiding in the initiation of altseason.
Let’s analyze these claims individually and see how likely they are to transpire.
Bitcoin Dominance Trend
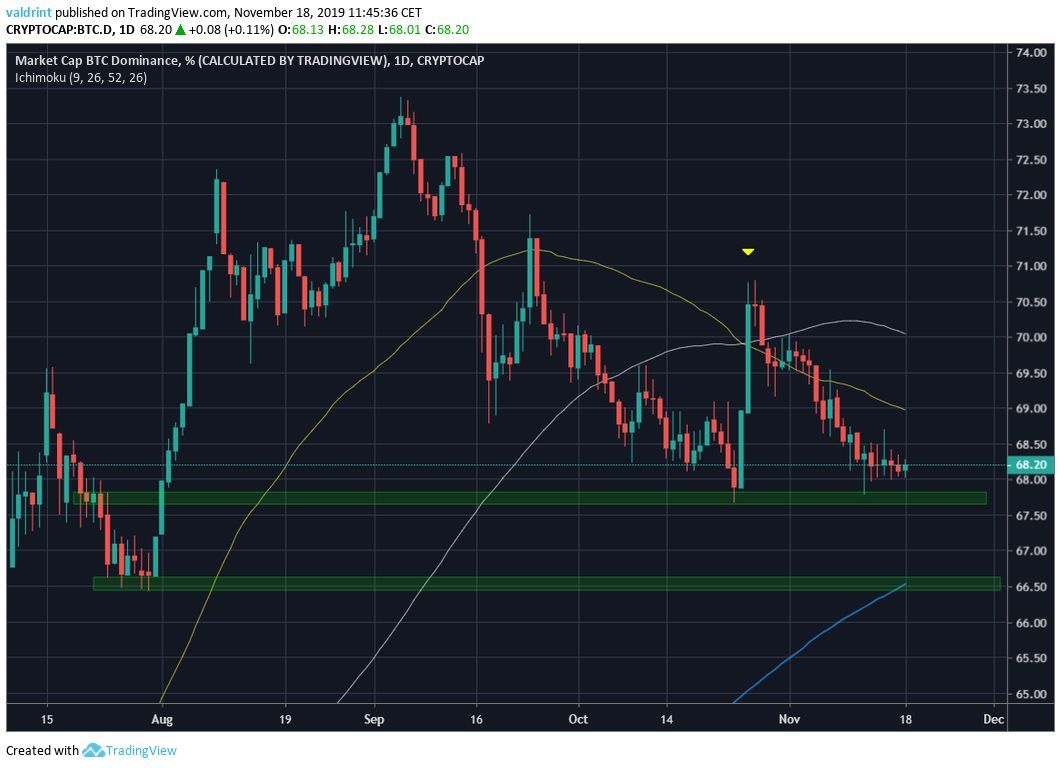
Looking at the moving averages (MA), we can see that the trend has begun to turn downward. The 50- and 100-day MAs have made a bearish cross and are offering resistance to the rate.
On October 25, the Bitcoin dominance rate bounced at the current 68 percent support area. A decrease below it would likely take us to 66.5 percent — where the 200-day MA is currently residing.
Reversal
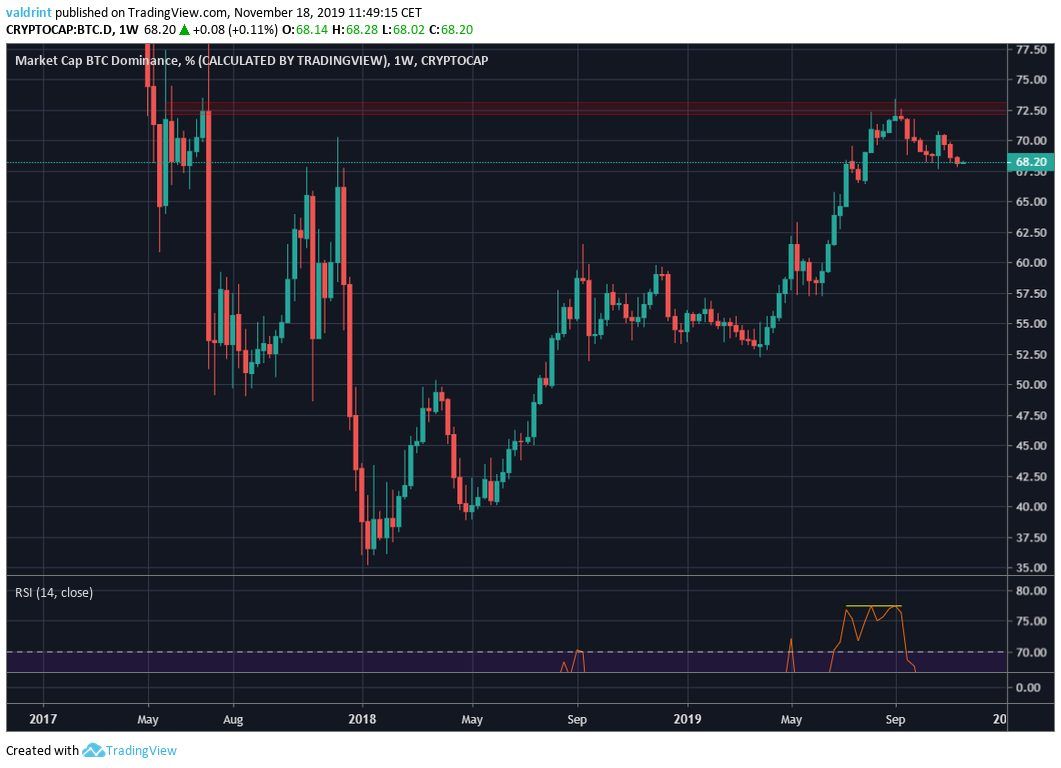
After reaching the strong resistance area at 72.5 percent, the Bitcoin dominance rate began to decrease. The resistance area has been in place since 2017. Also, the weekly RSI has begun to generate a bearish divergence. At such an oversold level, this divergence has never previously been present in the dominance rate.
This occurrence supports the hypothesis of further downward growth and does not dispute the findings of the daily chart.
 Ethereum Resistance
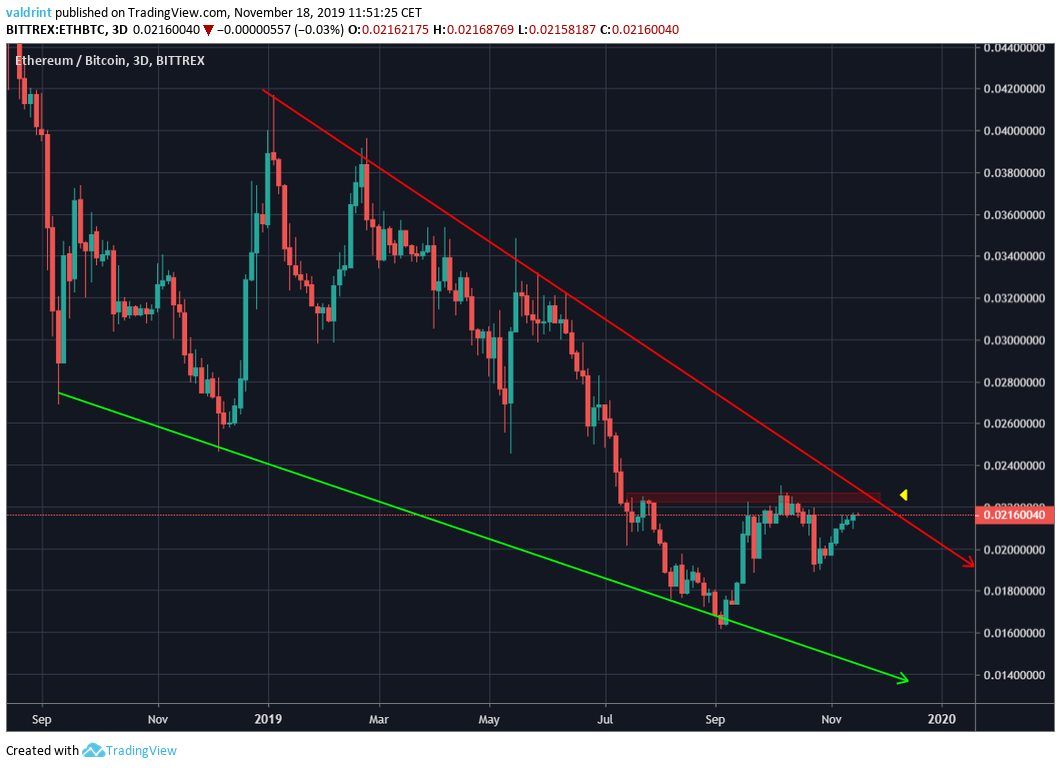
The Ethereum price is trading inside of a long-term descending wedge that has been in place since September 2018. The price has reached the resistance line of the wedge.
A breakout could definitely initiate a rapid increase and cause the Bitcoin dominance to fall. However, the price movement for the past two weeks has been devoid of any significant volatility.
Disclaimer: This article is not trading advice and should not be construed as such. Always consult a trained financial professional before investing in cryptocurrencies, as the market is particularly volatile.
Did you know you can trade sign-up to trade Bitcoin and many leading altcoins with a multiplier of up to 100x on a safe and secure exchange with the lowest fees — with only an email address? Well, now you do! Click here to get started on StormGain!


