


Ethereum (ETH) price is showing signs of weakening strength as polls open across most of the US.
Despite a 24% surge in trading volume over the past 24 hours and a modest 1% price uptick, technical indicators suggest a potential downturn. Here’s a closer look at the factors behind this analysis.
Ethereum to Remain “Under”
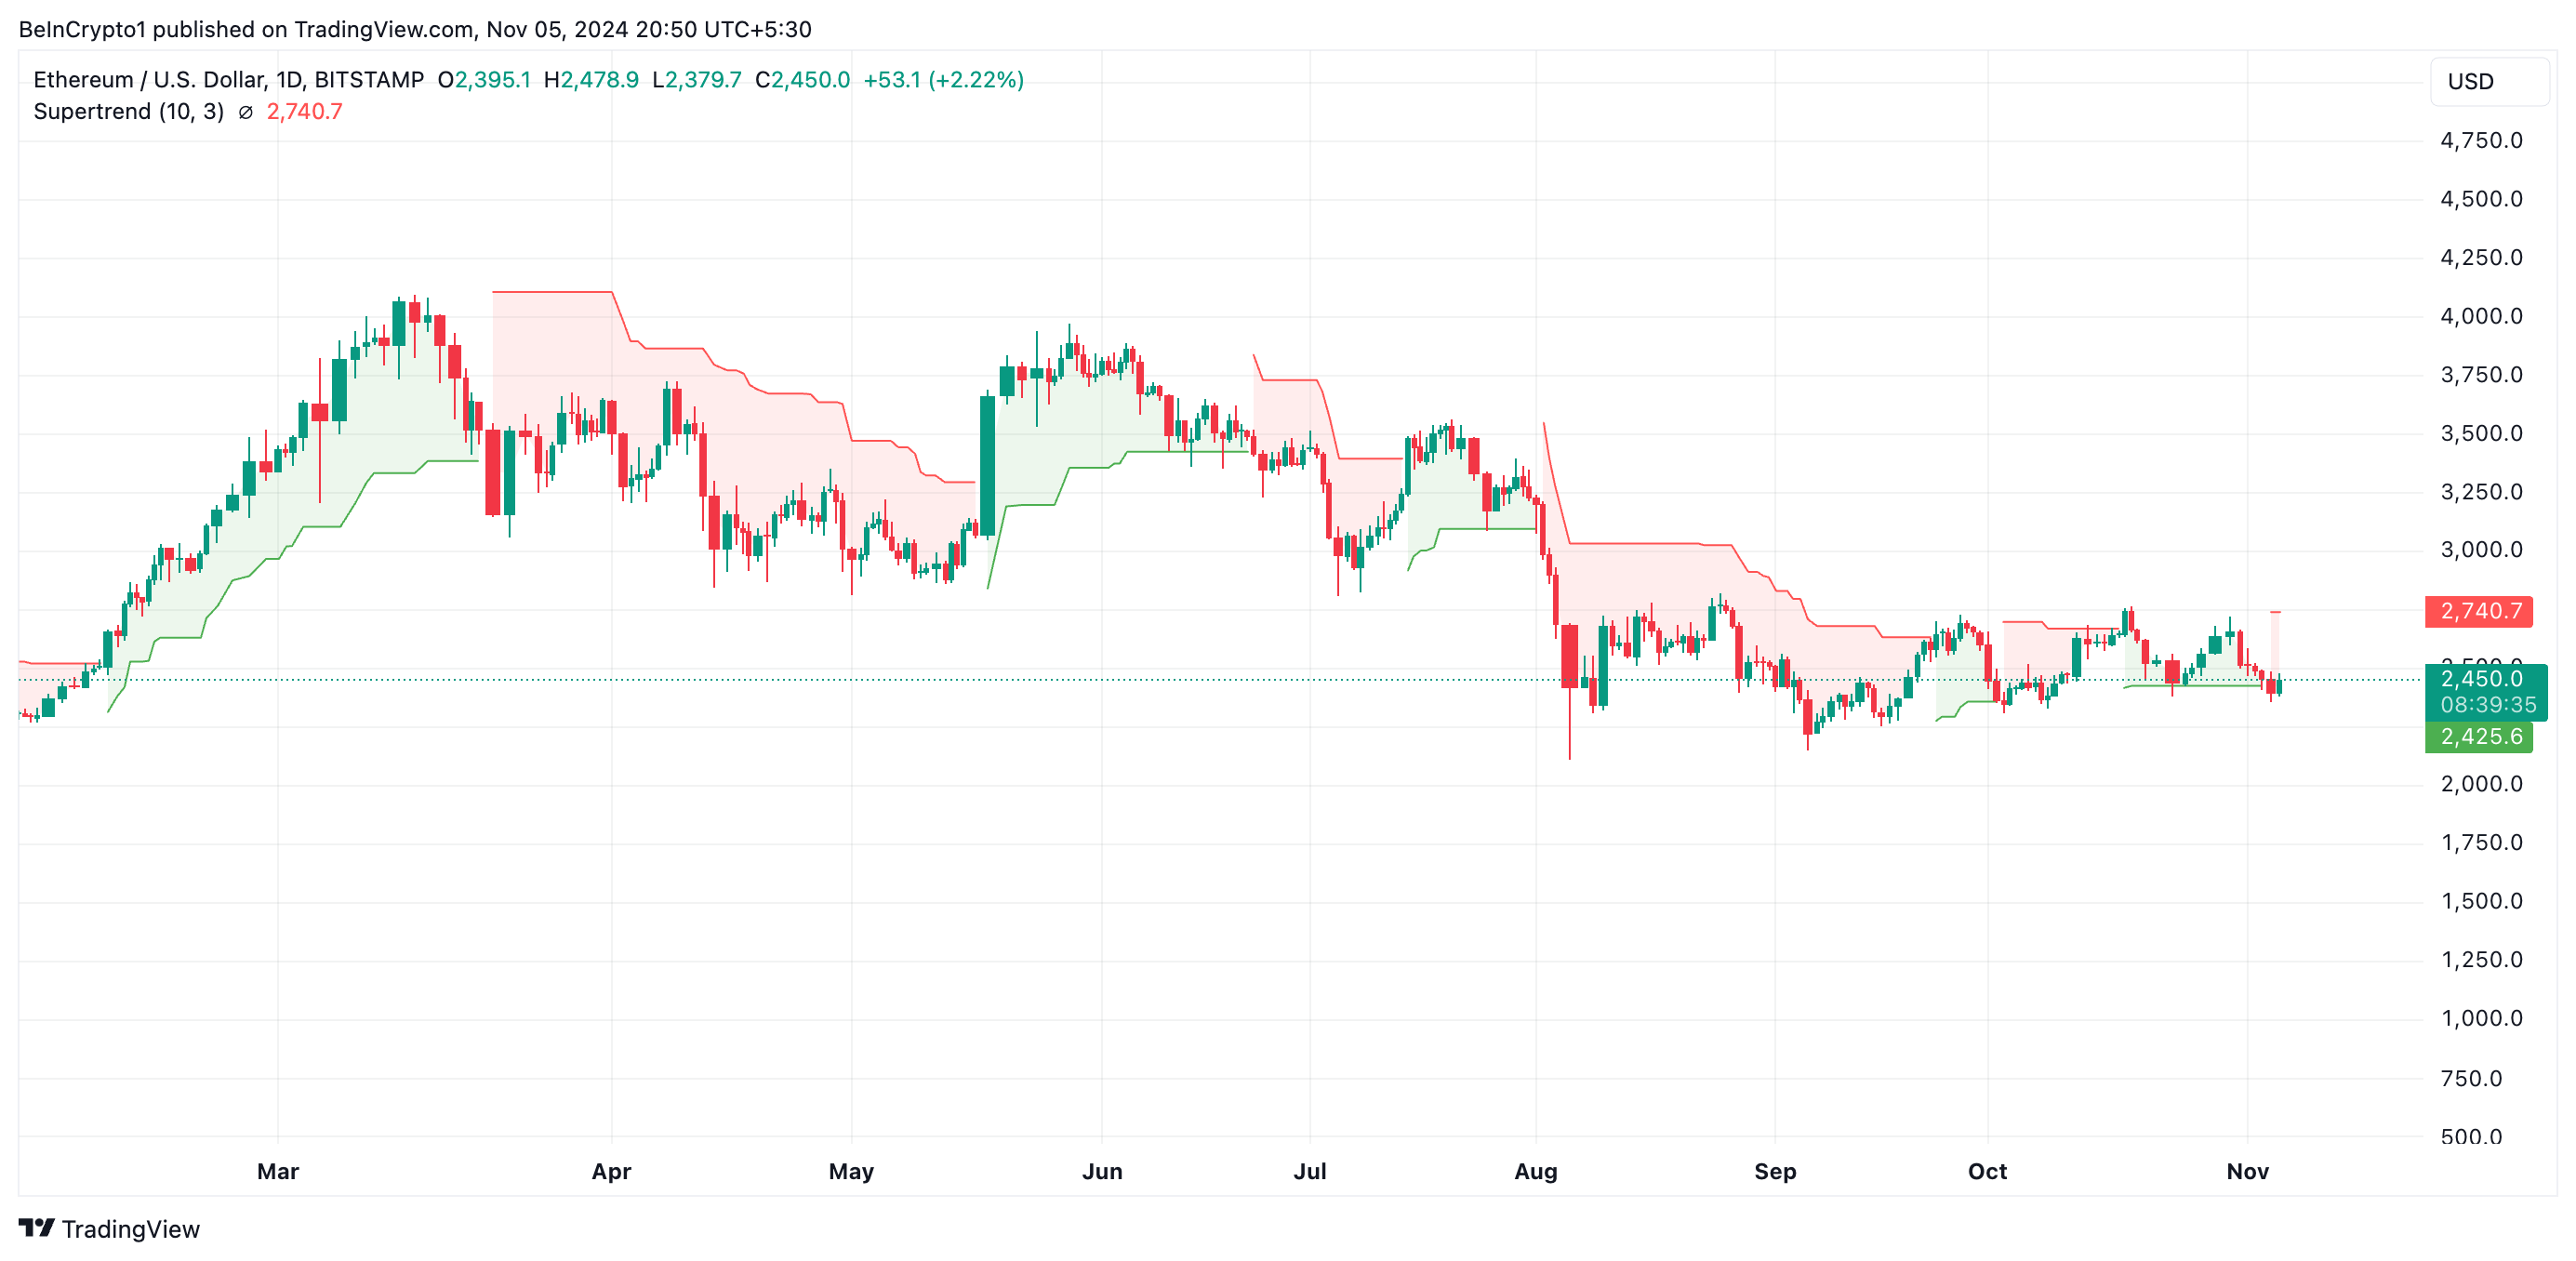
Readings from the altcoin’s Super Trend indicator reflect Ethereum’s weak price action. At press time, its red line rests above Ethereum’s price, confirming the potential downward trend.
This indicator helps traders identify the prevailing market trend and potential entry or exit points. It detects changes in price direction and determines support and resistance levels, often signaling when to buy or sell an asset. When the Super Trend line moves above the price and turns red, it signals a bearish trend, often considered a sell signal.
On the ETH/USD one-day chart, Ethereum’s Super Trend line is above the coin’s price at $2740, forming a resistance level that may be difficult to breach if new demand fails to enter the market. When the Super Trend line moves above the price, it acts as a resistance level. This is because the line indicates a potential “ceiling” where the price might face resistance if it attempts to rise.
Read more: Ethereum ETF Explained: What It Is and How It Works
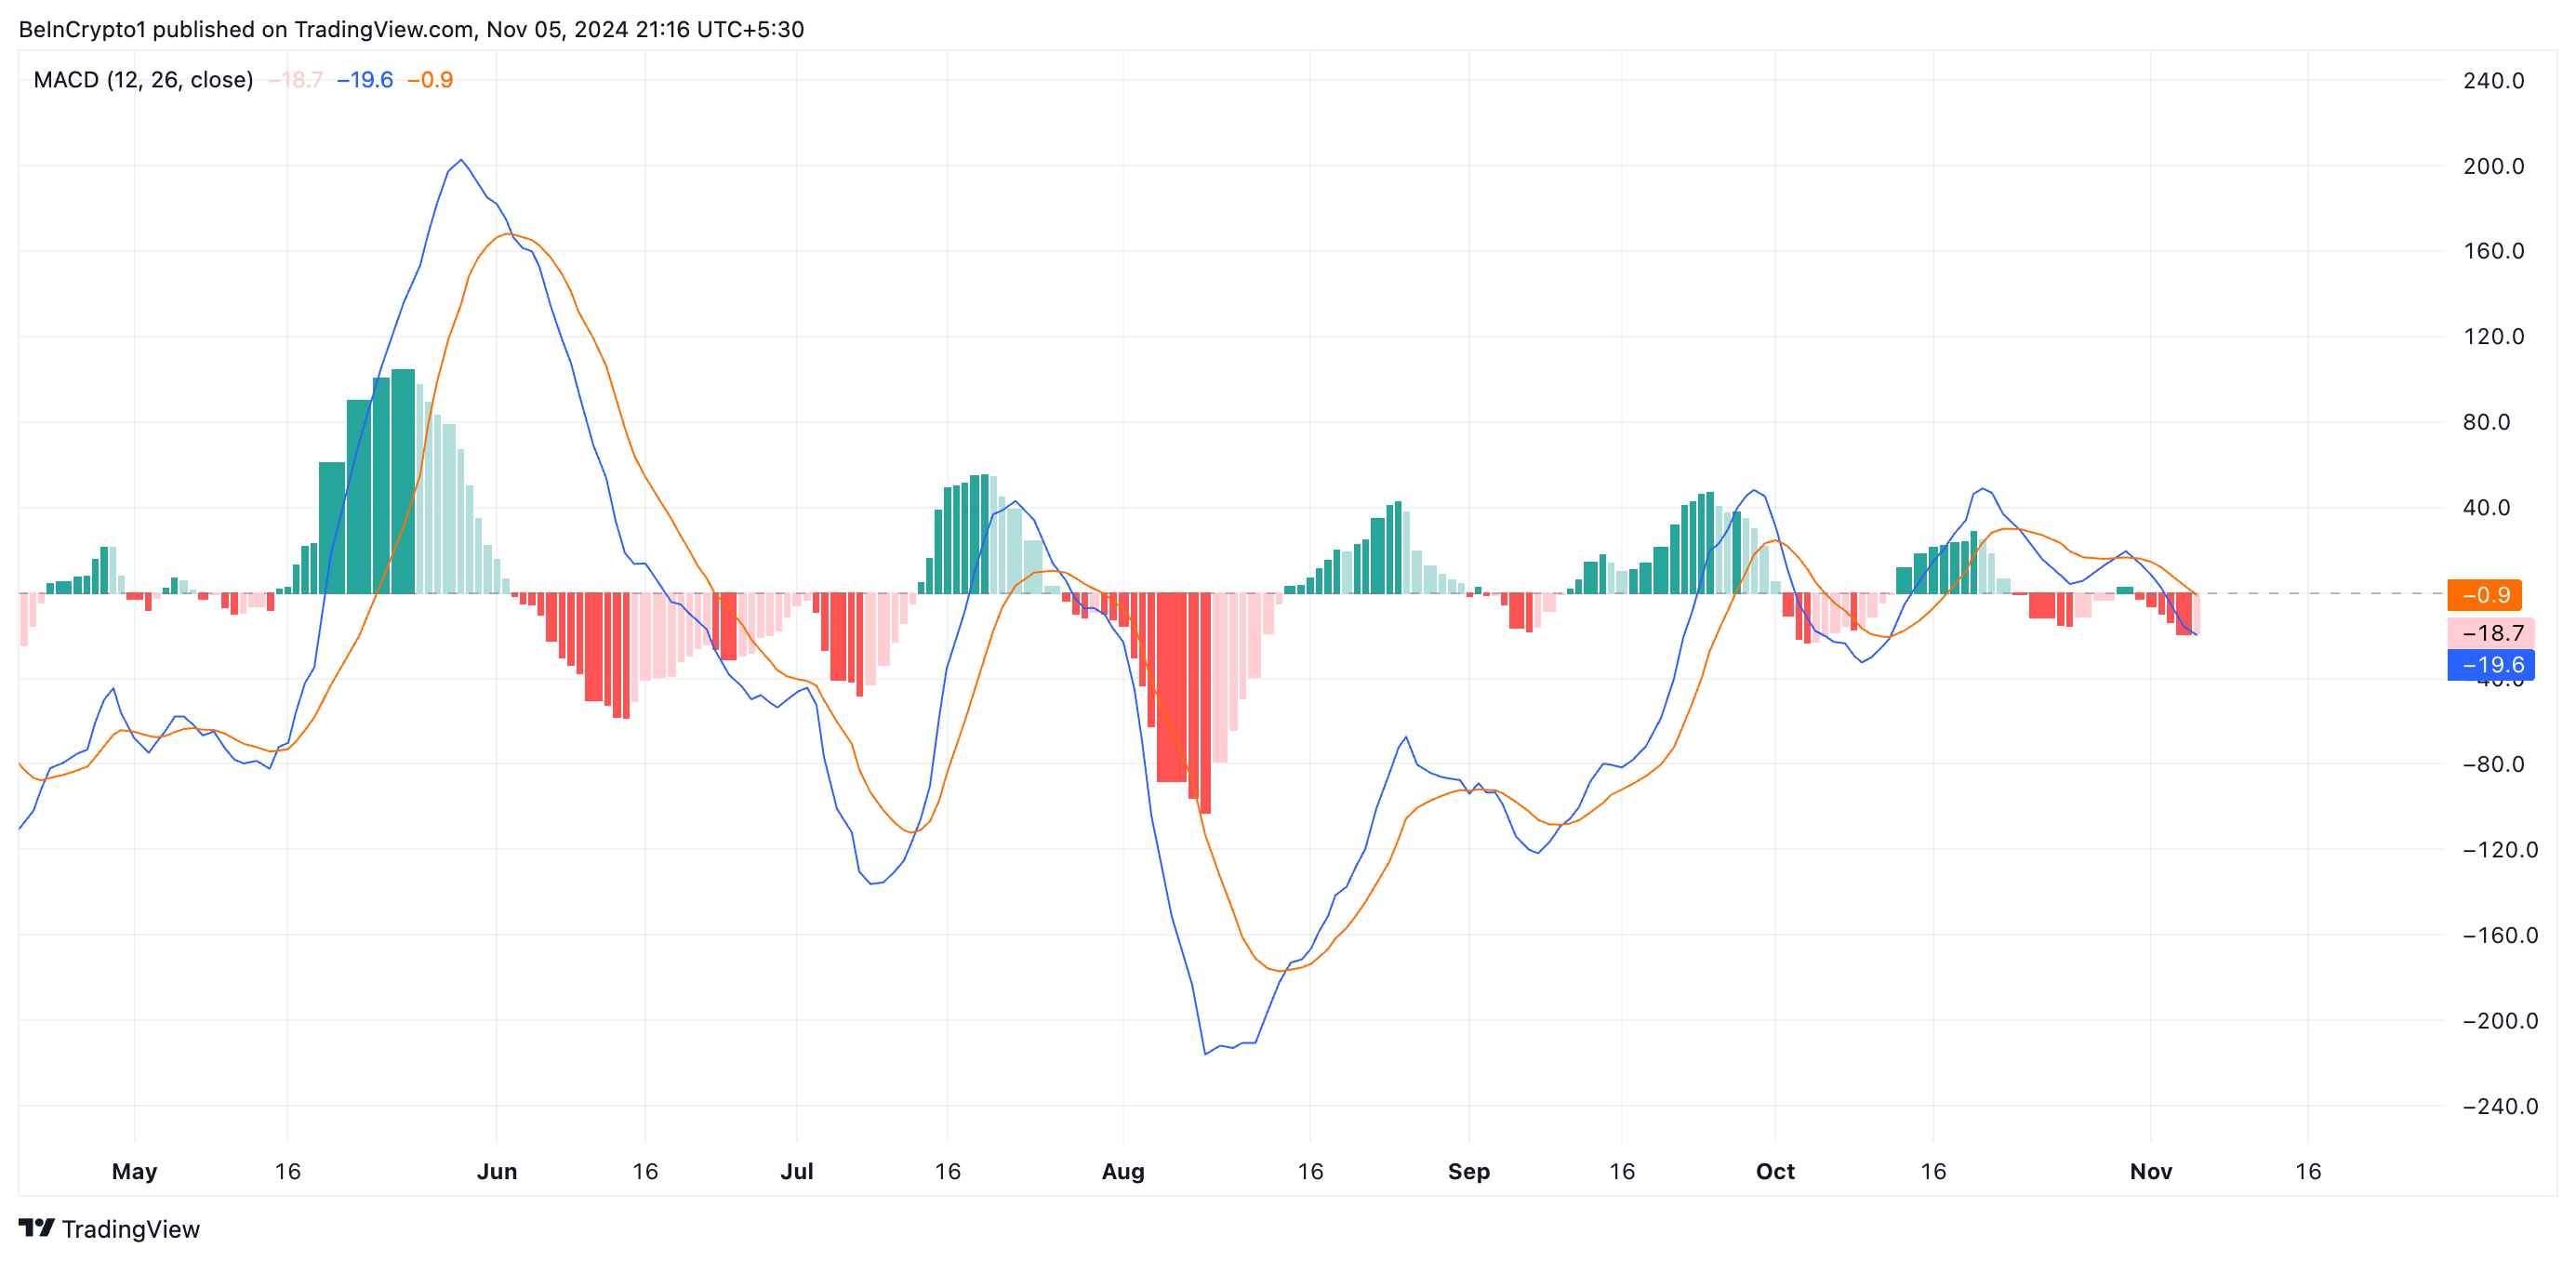
Moreover, the setup of ETH’s moving average convergence/divergence (MACD) indicator — which tracks its trend direction, shifts, and potential price reversal points — supports this bearish outlook. As of this writing, ETH’s MACD line (blue) rests below its signal line (orange) and zero line.
This bearish signal suggests that ETH’s short-term momentum is weakening. Traders often interpret this as a signal to exit long positions and take short ones.
ETH Price Prediction: August 5 Low Is Possible
If buying pressure weakens, Ethereum’s price could fall toward its August 5 low of $2,112, marking a 13% drop from its current value. Conversely, a surge in demand could propel the coin to test resistance at $2,508.
Read more: Ethereum (ETH) Price Prediction 2024/2025/2030
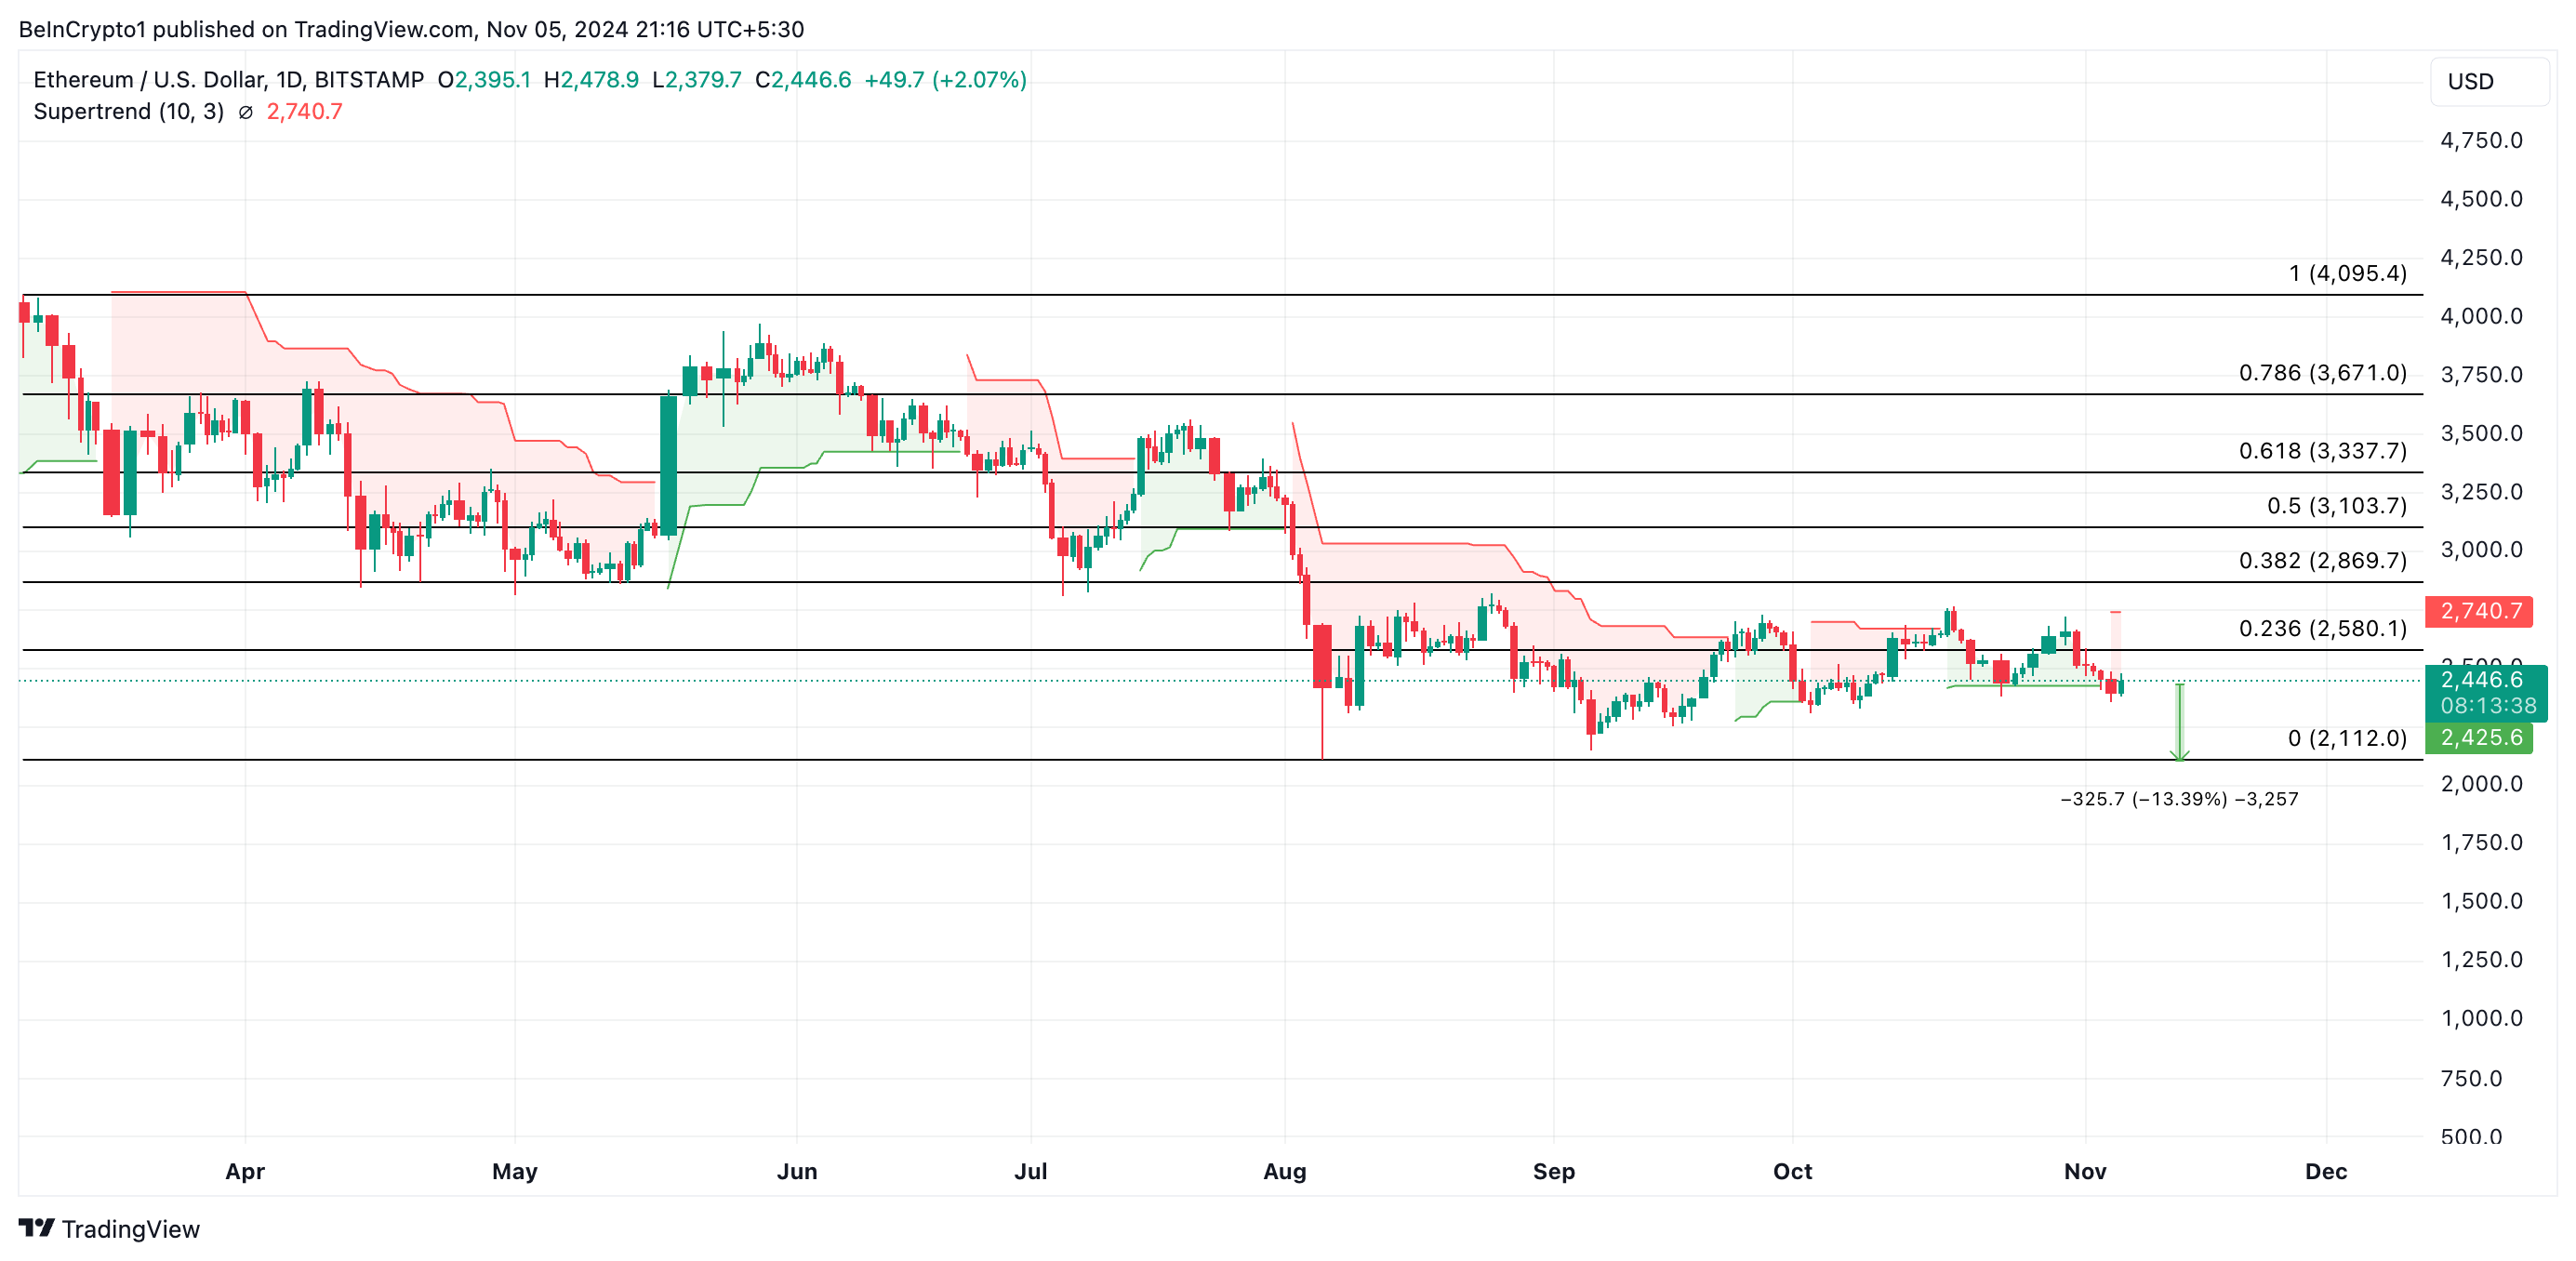
A successful breakthrough at this level would set the next target at the Super Trend line resistance of $2,740. Clearing this mark with strong momentum could position Ethereum for a climb toward $2,869 — a level not seen since August.



