


Ethereum’s metrics have recently seen an interesting uptick since loans issued on Ethereum have been increasing throughout the year. Many people are suggesting that this is a result of the anticipation for Ethereum 2.0, which will mark the transition to proof-of-stake.
A recent statistic shown by @defipulse shows that almost $3 million ETH is currently represented as debt. This could be explained as a rush to accumulate at least 32 ETH before the launch of Ethereum 2.0.
Ethereum has been preparing for the “Istanbul” hard fork, which is scheduled for December of this year. Istanbul represents the latest fork before the transition to Ethereum 2.0 — which will likely launch next year.
Cryptocurrency trader @RJ_Killmex stated that November has been the beginning of the upward/downward movement for the Ethereum price in 2017 and 2018, respectively.
https://twitter.com/RJ_Killmex/status/1194692693160595464
The current movement in November 2019 is outlined. Let’s take a closer look at price movement and technical indicators to see if we can predict its future movement.
Ethereum Price Support
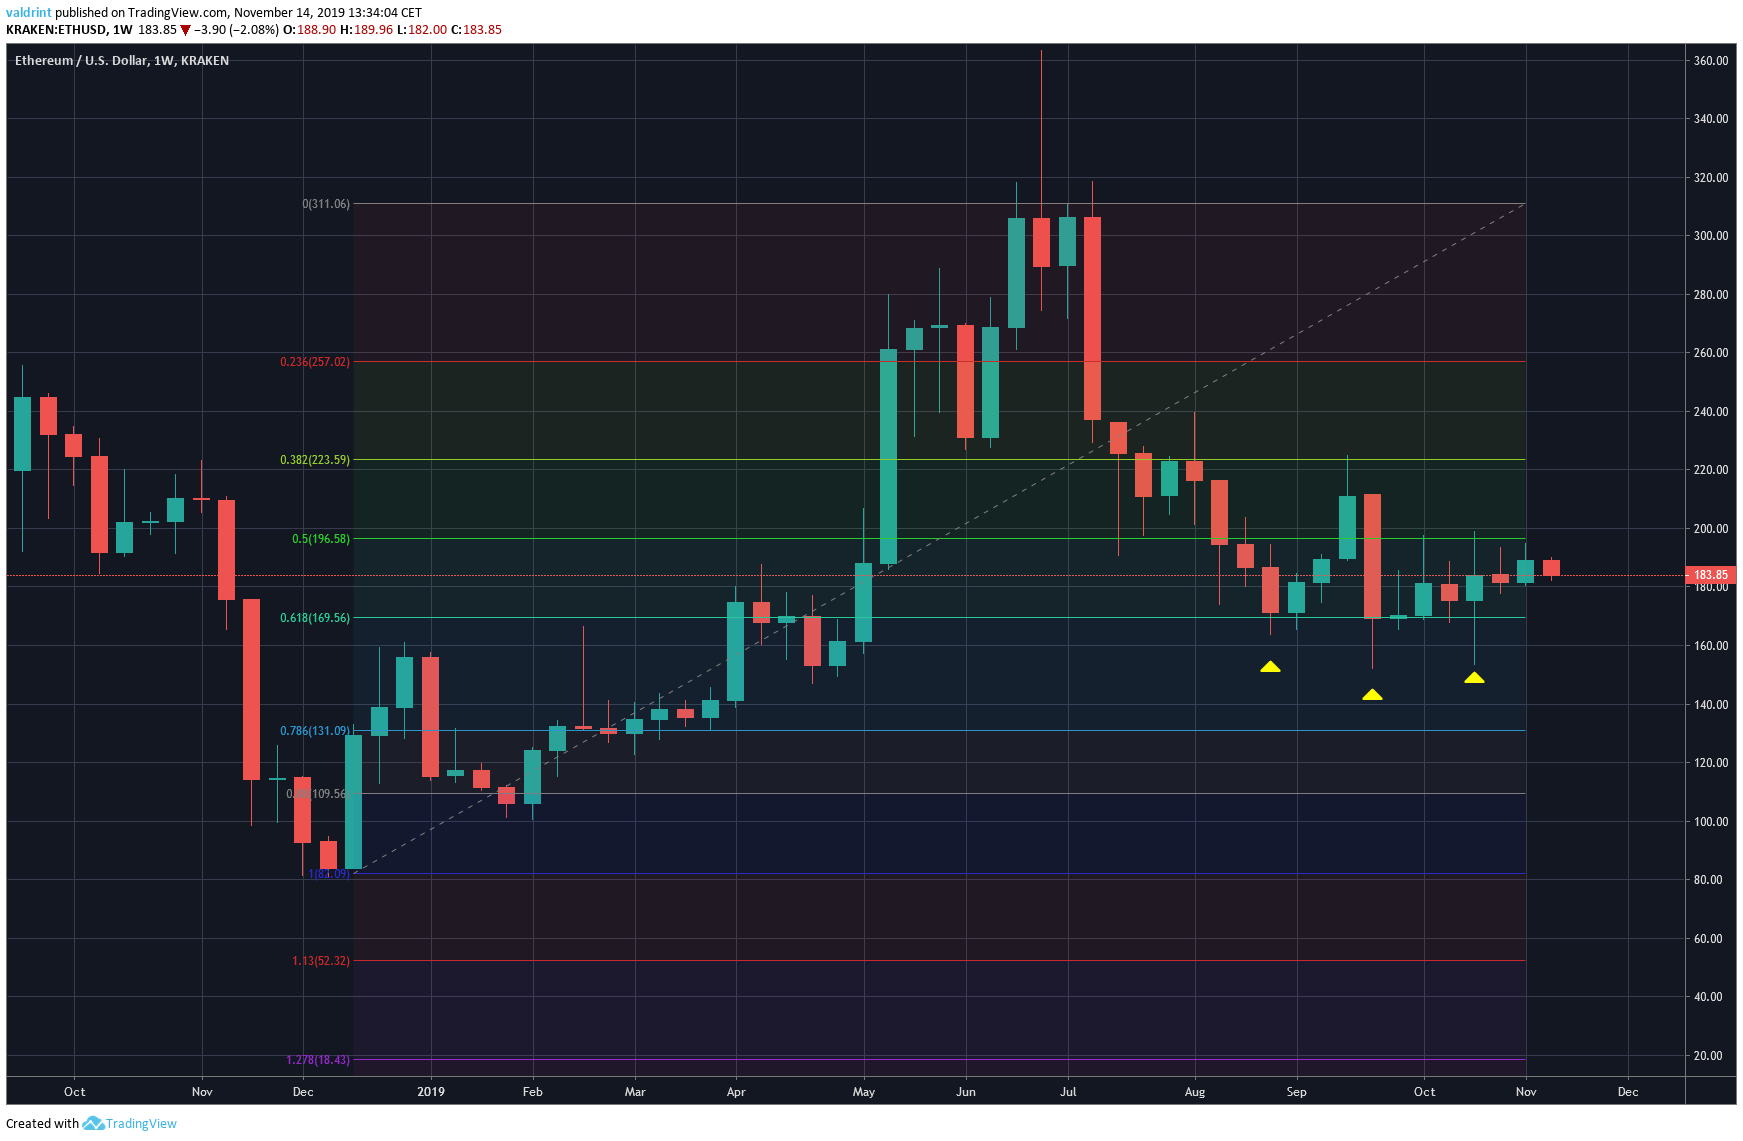
The Ethereum price began an upward move in December 2018. It reached a high of $363 before decreasing to around $157.
Currently, it has found support above the 0.618 Fib level. While it reached values below it several times, it only created long lower wicks before eventually moving upward.
However, every bullish candle has been contained within the body of the massive bearish candle near the end of September. A price close above $220 would be required for the uptrend to be validated.
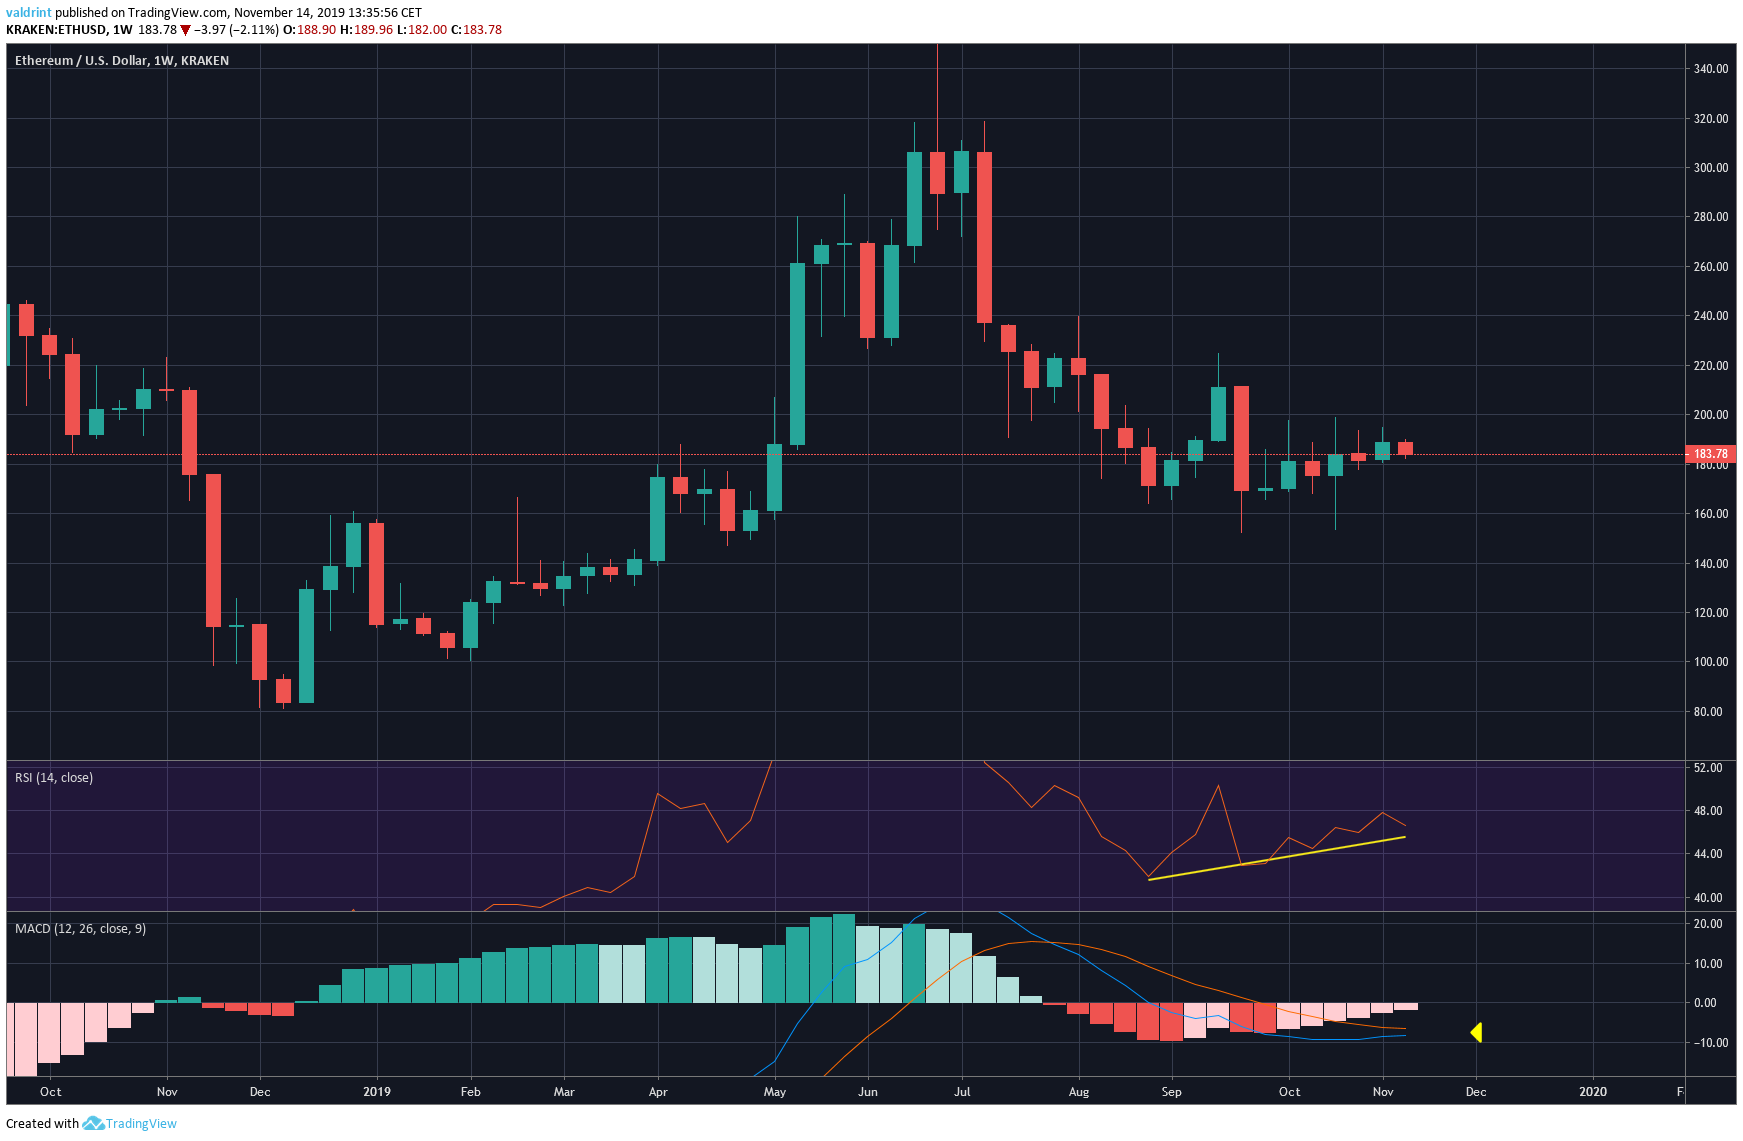
Looking at the RSI, we can see a strong bullish divergence in the weekly RSI.
Additionally, the weekly MACD has made a bullish cross. The previous time this happened was in December 2018 — being a catalyst for the current upward move.
Future Movement
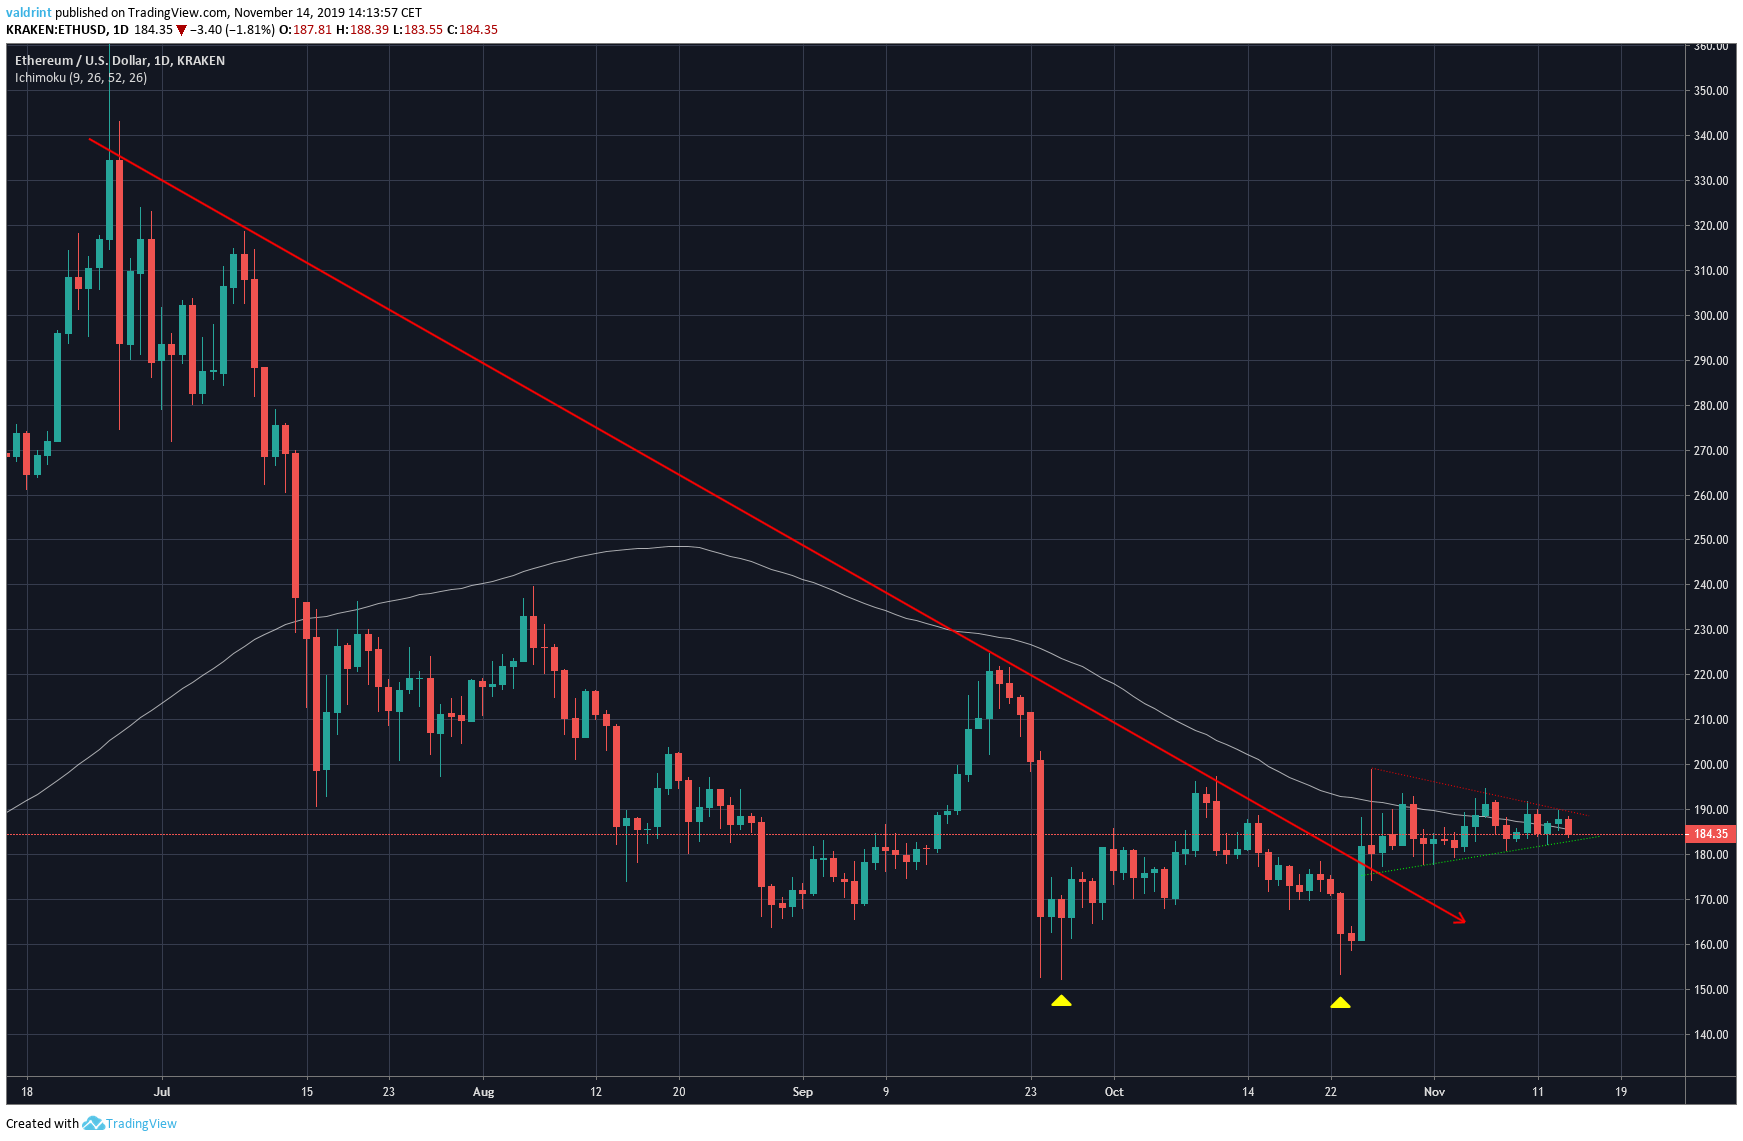
The Ethereum price made a double bottom at $156 on September 21 and October 23, before breaking out above the long-term descending resistance line.
Afterward, it has made a likely bullish pennant and is struggling to break out above the 100-day moving average(MA). If it does, it is likely to confirm the existence of the uptrend and reach new highs.
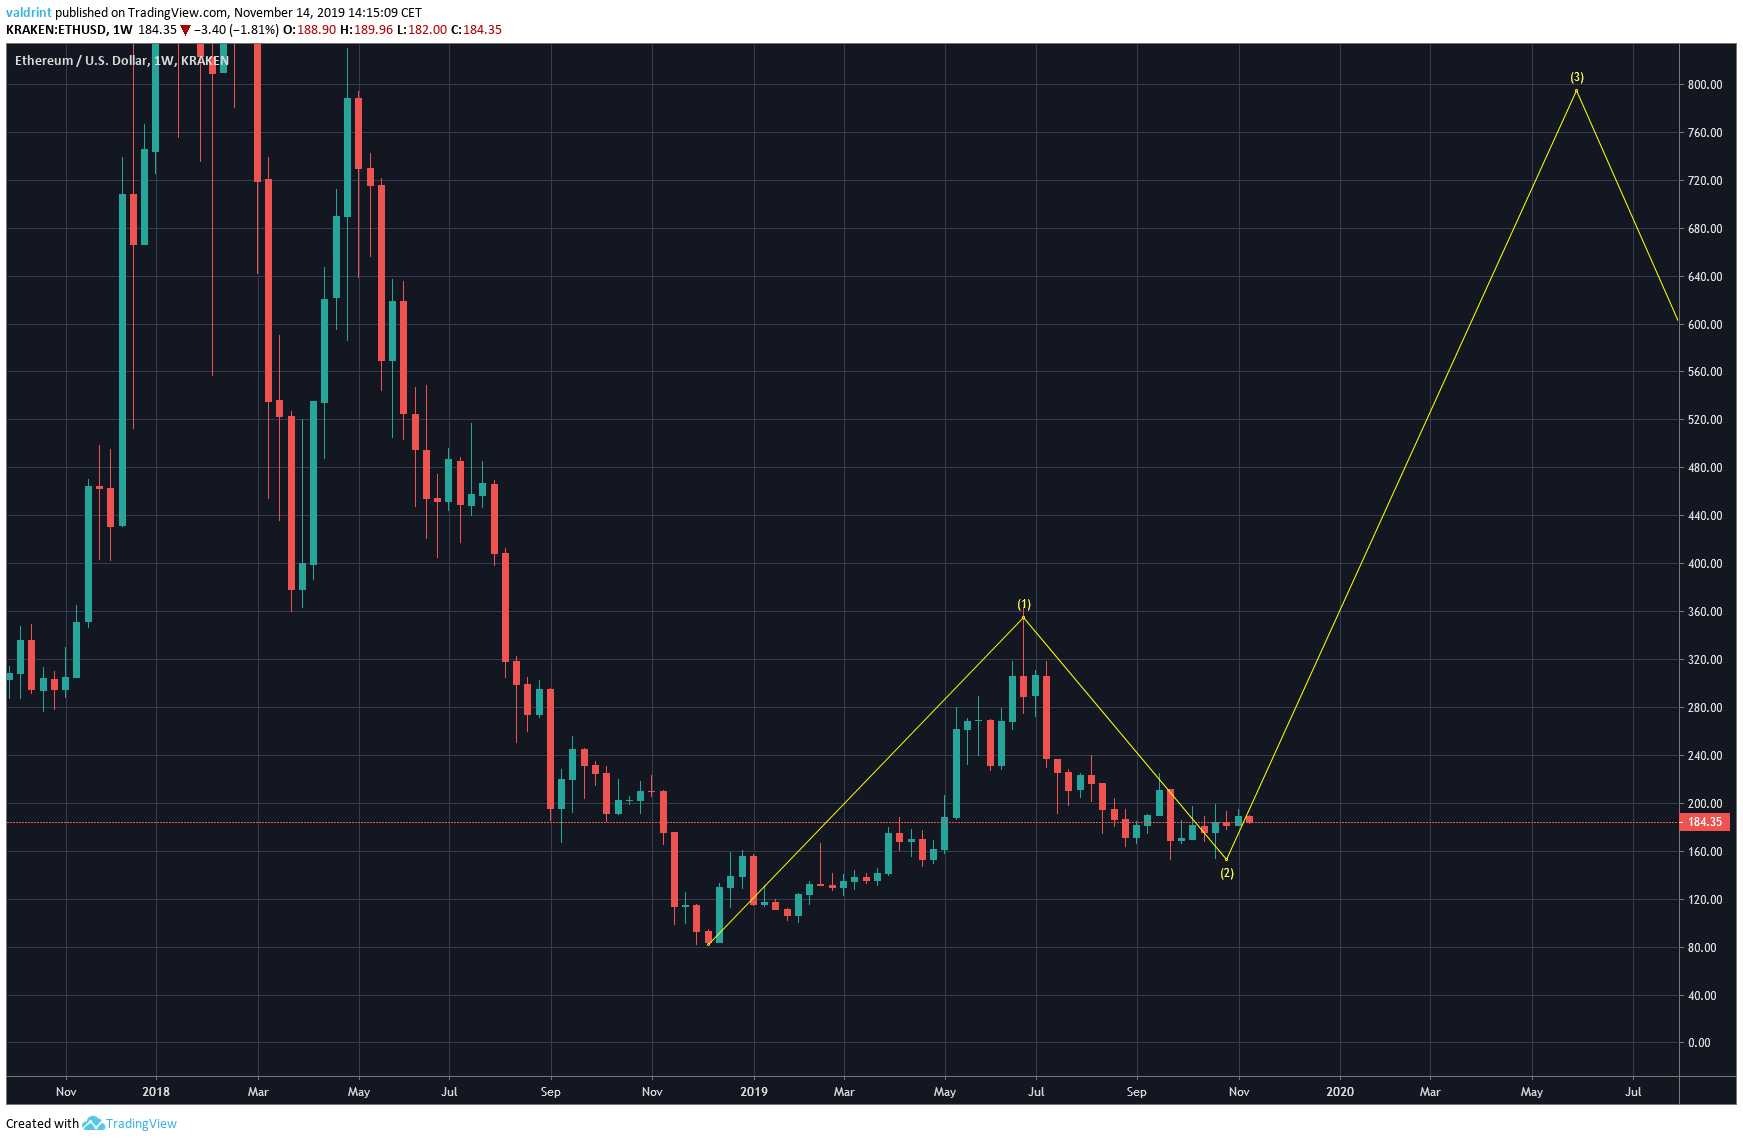
In this scenario, we would have just finished the second wave — and the third wave would likely take us to a high above $500.
Disclaimer: This article is not trading advice and should not be construed as such. Always consult a trained financial professional before investing in cryptocurrencies, as the market is particularly volatile.
Did you know you can trade sign-up to trade Bitcoin and many leading altcoins with a multiplier of up to 100x on a safe and secure exchange with the lowest fees — with only an email address? Well, now you do! Click here to get started on StormGain!


