


The Ethereum (ETH) price has increased significantly since March and is currently approaching a long-term resistance level.
Ethereum is expected to be successful in breaking out and may begin moving towards the resistance levels outlined below.
ETH Long-Term Resistance
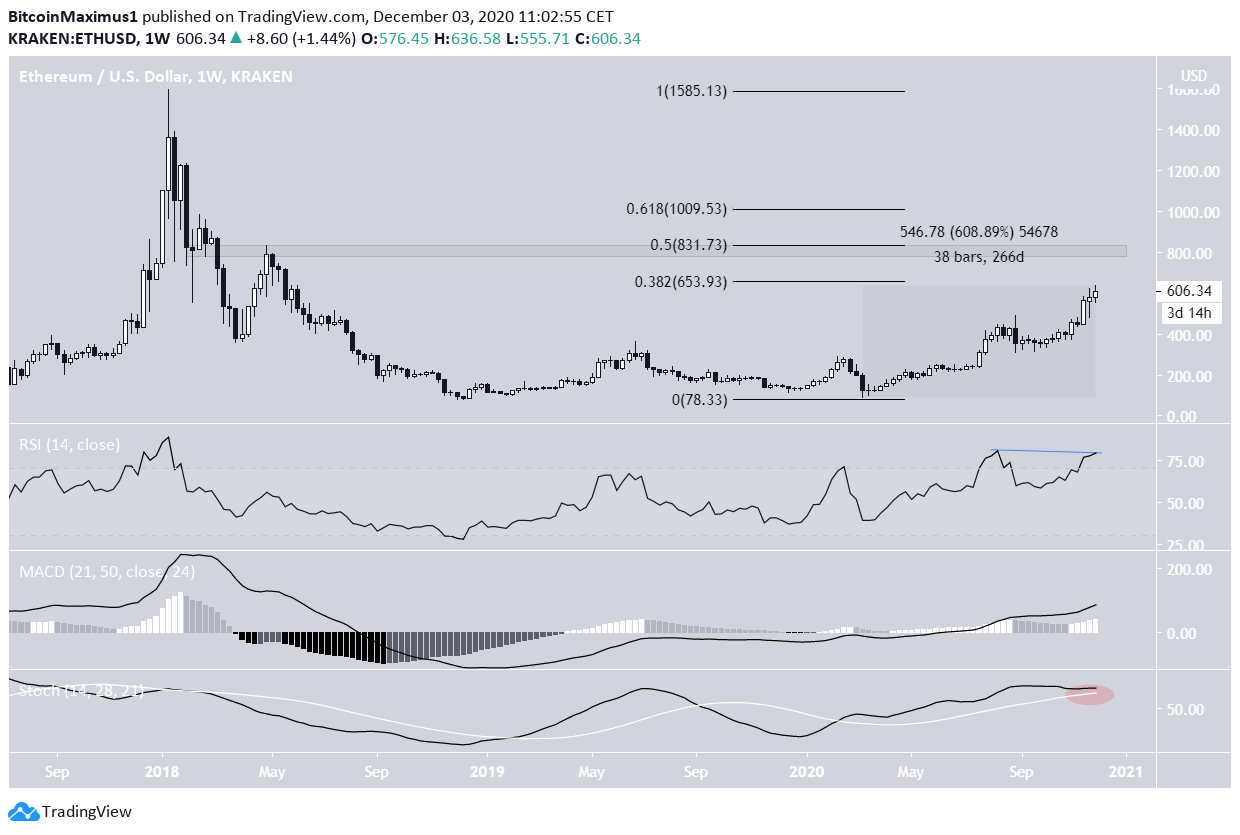
The Ethereum price has been moving upwards since the beginning of March, already having increased by 608%.
Currently, ETH is approaching the first significant Fib resistance level (0.382) measuring from the all-time high price in 2018, which is found at $653.
However, the strongest resistance area is found at $830. This is the 0.5 Fib retracement level and also a horizontal resistance area. A breakout above it would likely take ETH toward the all-time high.
Technical indicators give mixed readings. On one hand, the weekly RSI provides a bearish outlook, since it has generated bearish divergence inside its overbought territory. On the other, the MACD is bullish and is still moving upwards without any trace of divergences.
The Stochastic oscillator has a neutral slope.
Therefore, a look at lower time-frames is required in order to try and determine where the price is heading next.
Double Top Pattern
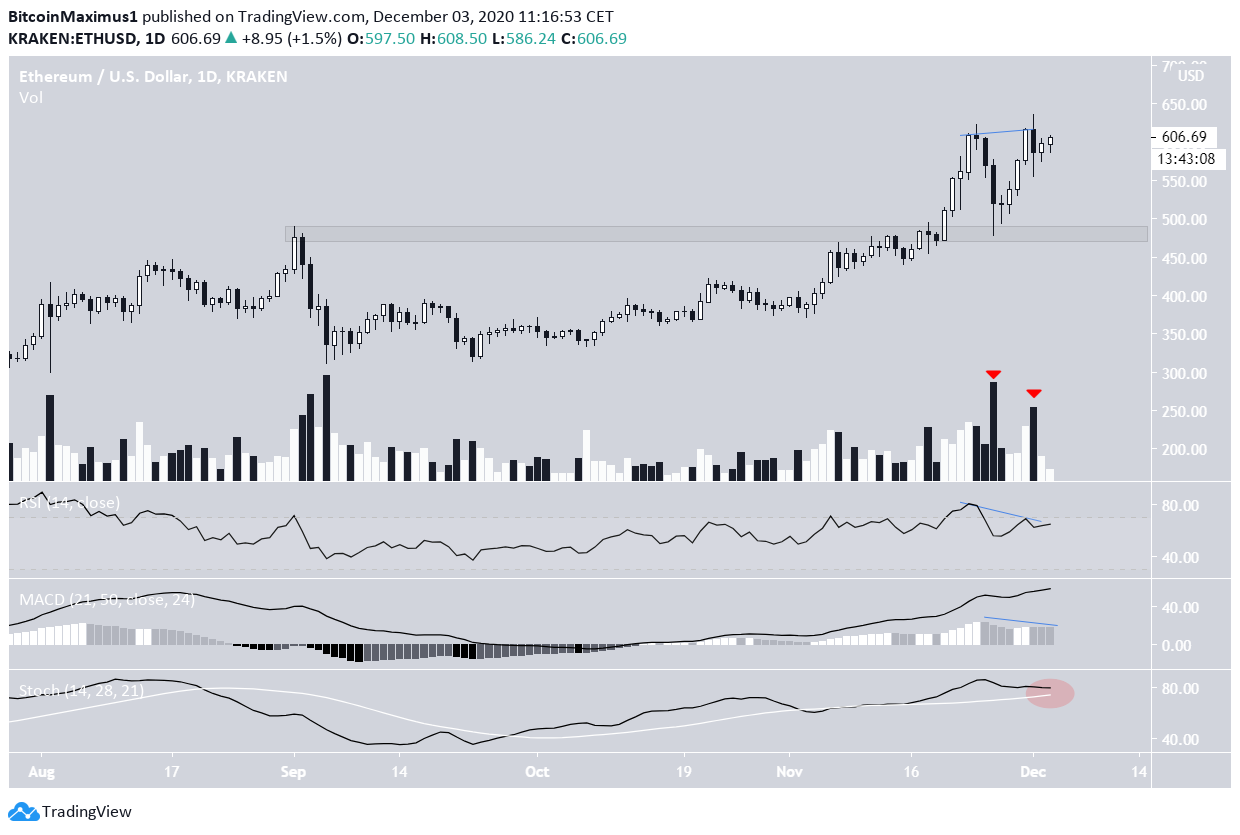
The daily chart for ETH shows a possible double top pattern near $610, which has been combined with bearish divergences in the RSI and MACD. In addition, volume was the highest during the two bearish candlesticks which created the pattern.
If the price decreases, the closest support area would be found at $180.
Future Movement
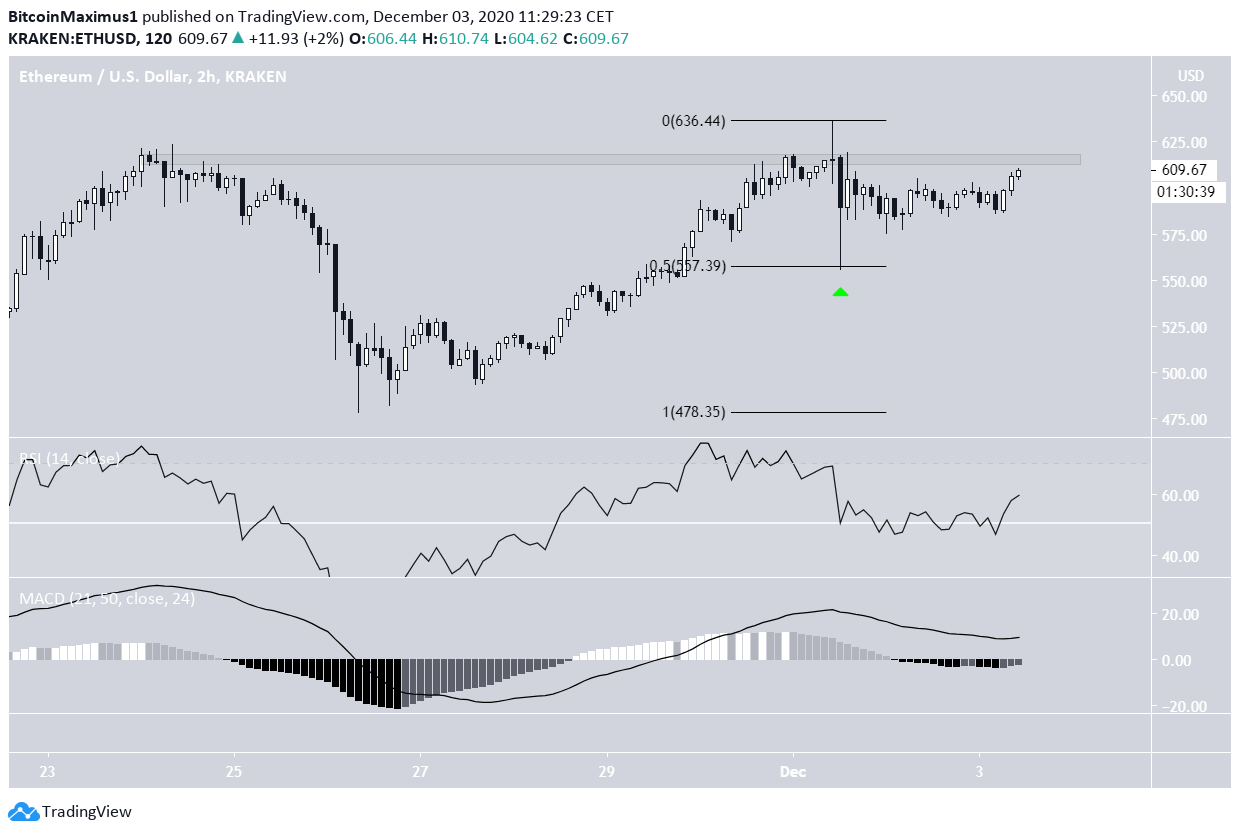
The two-hour chart shows that a decrease has already occurred as a result of the double top, and it was bought as soon as the price reached the 0.5 Fib retracement level.
Both the MACD and RSI are moving upwards, supporting the possibility of a breakout.
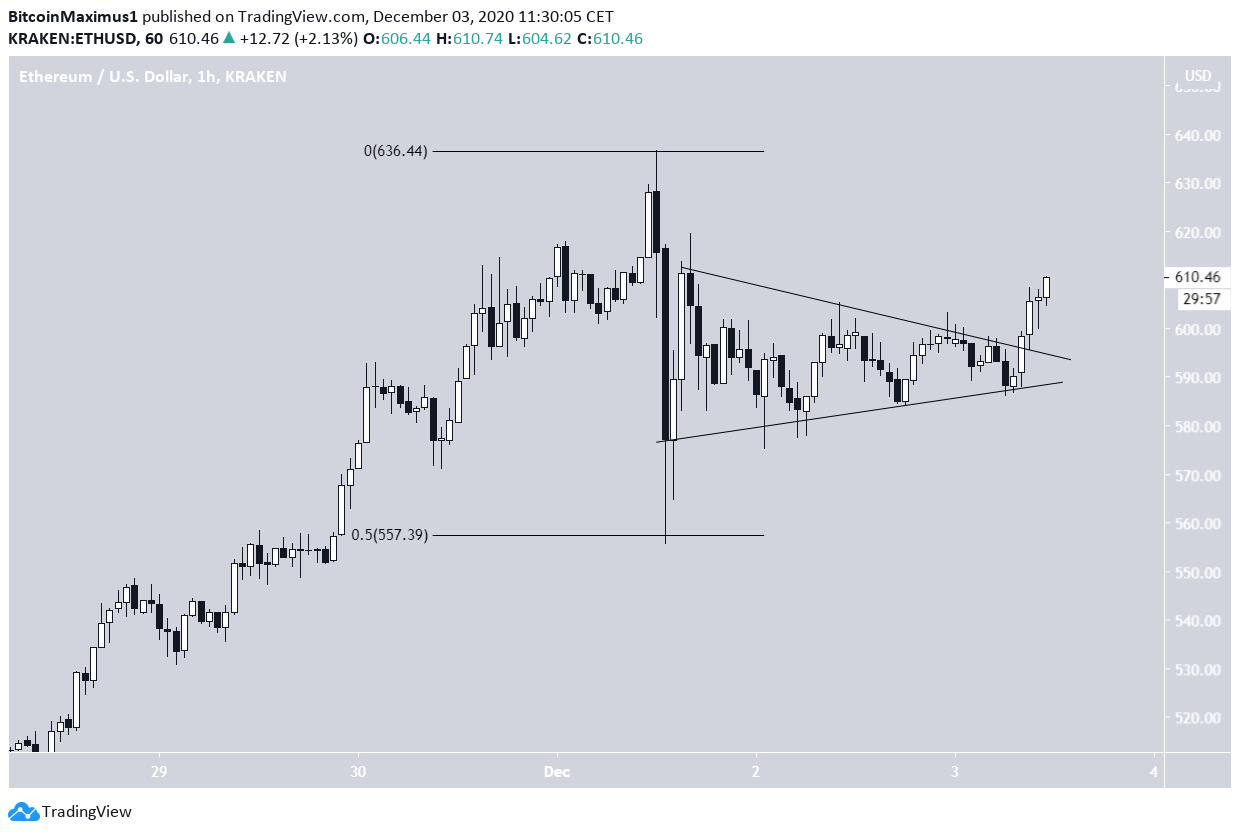
Furthermore, an even closer look shows a breakout from a symmetrical triangle, which is expected to be the catalyst for the upward movement.
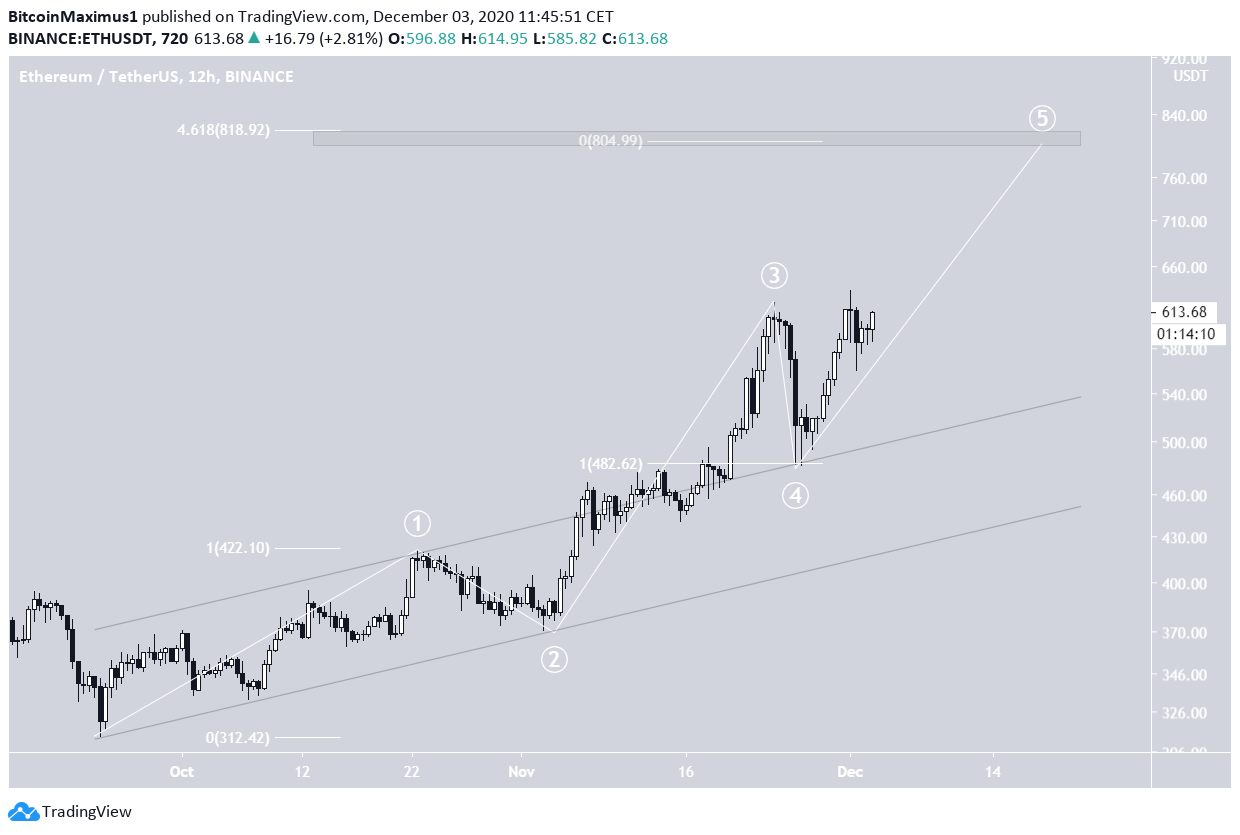
Wave Count
Cryptocurrency trader @Mesawine1 outlined an ETH wave count and predicted that the price will break out towards $800.
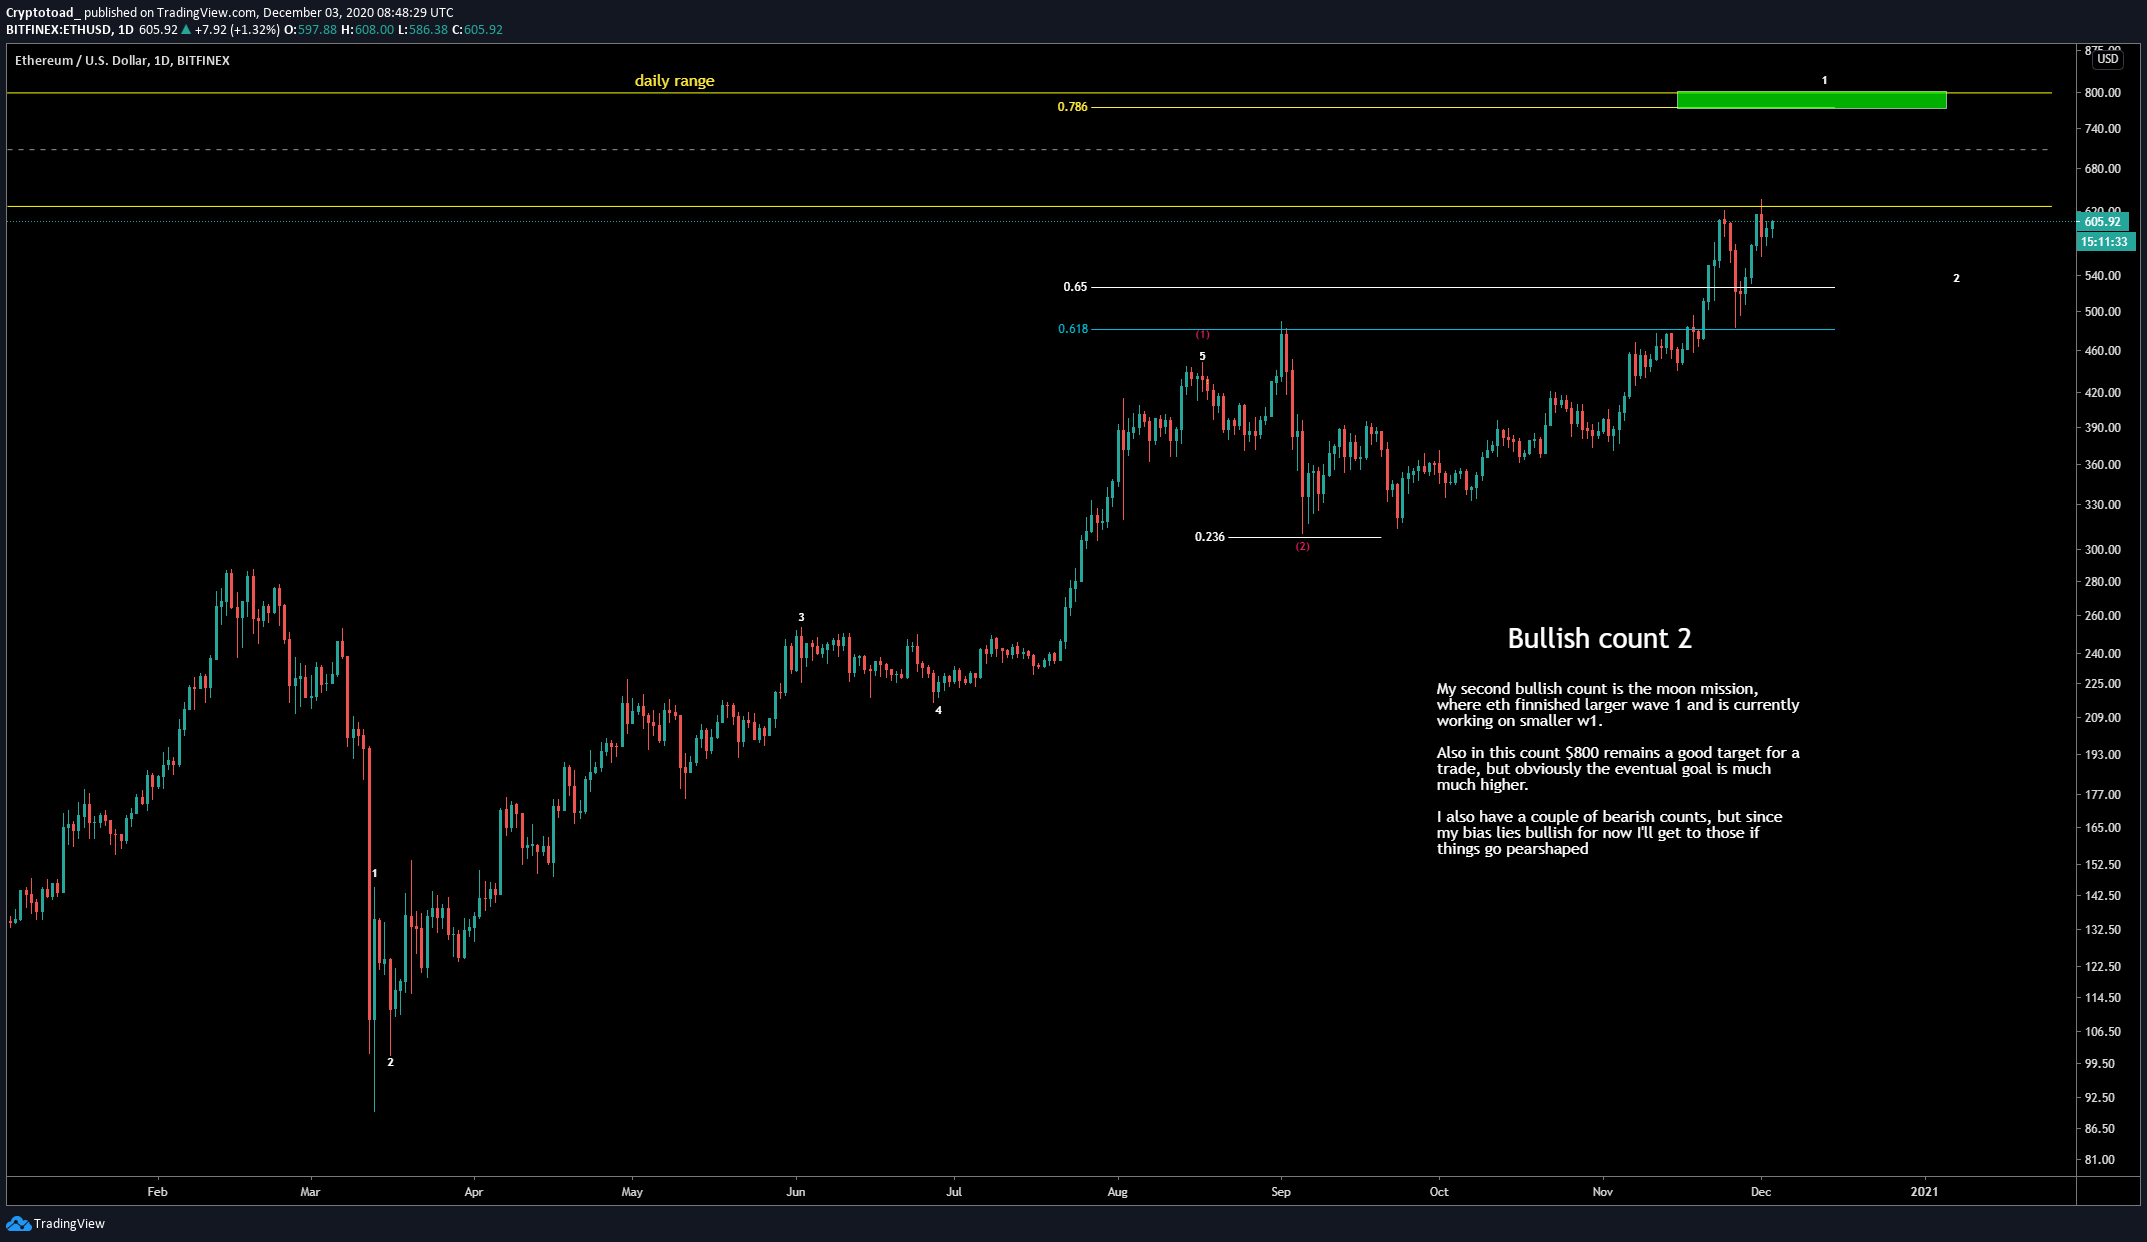
While the longer-term count is not entirely clear, ETH seems to have begun a bullish impulse on Sept. 23 (shown in white below), and is currently in wave 5.
The possible fourth wave pullback after the breakout from the channel supports this possibility.
A likely target for the top of the fifth wave would be found between $805-$818, the projection of waves 1-3 to the bottom of wave 4 and the 4.61 Fib extension of wave 1. In addition, this level fits with the long-term resistance area outlined in the first section.
A decrease below the wave 4 low at $485 would invalidate this particular wave count.
Conclusion
Ethereum is expected to break out above the current resistance area and continue increasing, possibly reaching a high between $805-$830.
For BeInCrypto’s latest Bitcoin analysis, click here!
Disclaimer: Cryptocurrency trading carries a high level of risk and may not be suitable for all investors. The views expressed in this article do not reflect those of BeInCrypto


