


![Ethereum Selloff Could Precede a Price Dump [Premium Analysis]](/_mfes/post/_next/image/?url=https%3A%2F%2Fassets.beincrypto.com%2Fimg%2Fc9mttIsDwqiVdVKWzjn3oCI6ZuI%3D%2Fsmart%2Fb9ea641de76444e7a2a90c54a61a4a1a&w=1920&q=75)
The Ethereum price has decreased by 14 percent since December 16. While a short-term upward bounce is expected, the price could eventually fall to ₿0.0016.
On December 25, over 204,000 ETH was moved to different exchanges, leading many to speculate that this was either done by Vitalik Buterin or another Ethereum developer. From this amount, 90,000 was sent to Kraken. It was revealed that the man behind this transfer was Jeff Wilcke, Ethereum’s co-founder. It is still unclear who is behind the other transfers.
While the Ethereum price has been consolidating over the past week, a selloff of this magnitude could cause a dump in the cryptocurrency’s price.
Cryptocurrency trader @CryptoNTez stated that the Ethereum price has broken down below a significant support level and has validated it as resistance afterward. He predicts further downside for the future ETH price with a target of ₿0.0016.
update on $ETH
Retested and flipped into resistance the ~.0175 that we were tracking…
Looking like we will get some more downside prior anything else…
UCTS Sell signals across the board
RSI still at oversold..Targets at chart, happy christmas!#ETH pic.twitter.com/IaeCmjp61A
— Nico (@CryptoNTez) December 25, 2019
Where will the Ethereum price go from here? Keep reading below if you are interested in finding out.
Important Areas for Ethereum
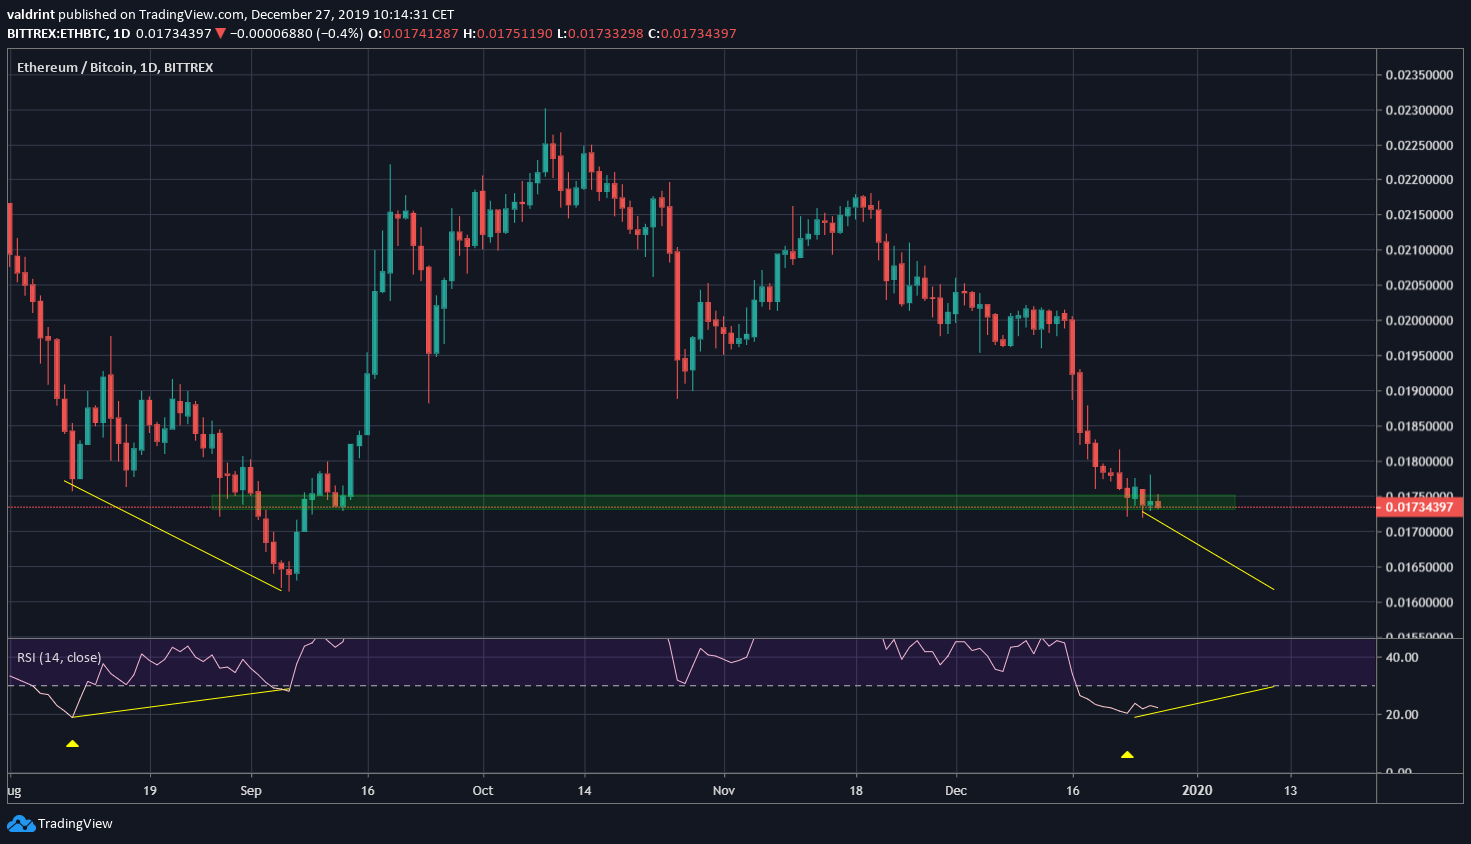
The Ethereum price still seems to be inside the ₿0.0017-₿0.00175 support area, where it has been for the past four days.
The RSI is deep into oversold levels at 20. It was almost at an identical level on August 9, when the price was at ₿0.00175. What followed afterward was a lower low combined with a higher RSI, creating a bullish divergence.
If the same were to occur, the price would drop to ₿0.0016, as outlined in the tweet — possibly creating a bullish divergence once more. Afterward, an upward move should follow.
Descending Wedge
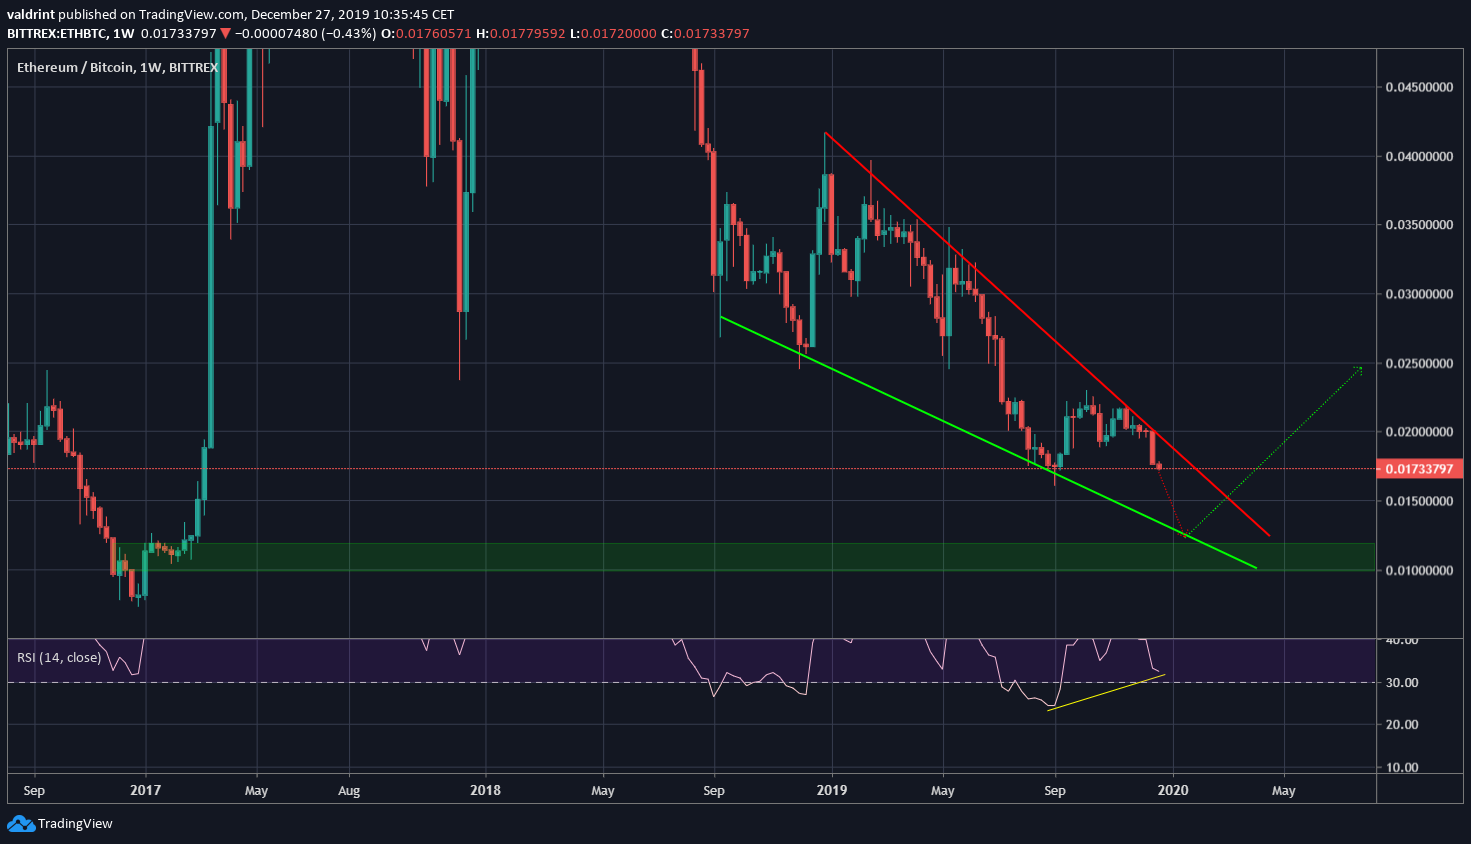
In the longer-term, the Ethereum price has been trading inside a descending wedge since September 2018. Recently, it was rejected by the resistance line and has been decreasing since.
There is a bullish divergence in the weekly RSI, which was briefly at its lowest levels since 2016. There are two scenarios which seem likely here:
- A drop to the ₿0.0016 support of September, creating a double bottom combined with bullish divergence. The daily RSI and previous patterns support this development.
- A decrease towards ₿0.0012, near the descending support line of the wedge.
Since we think the double bottom will occur, the presence of reversal signs at that level will determine if the price will continue to decrease further or initiate a reversal.
Short-Term Movement
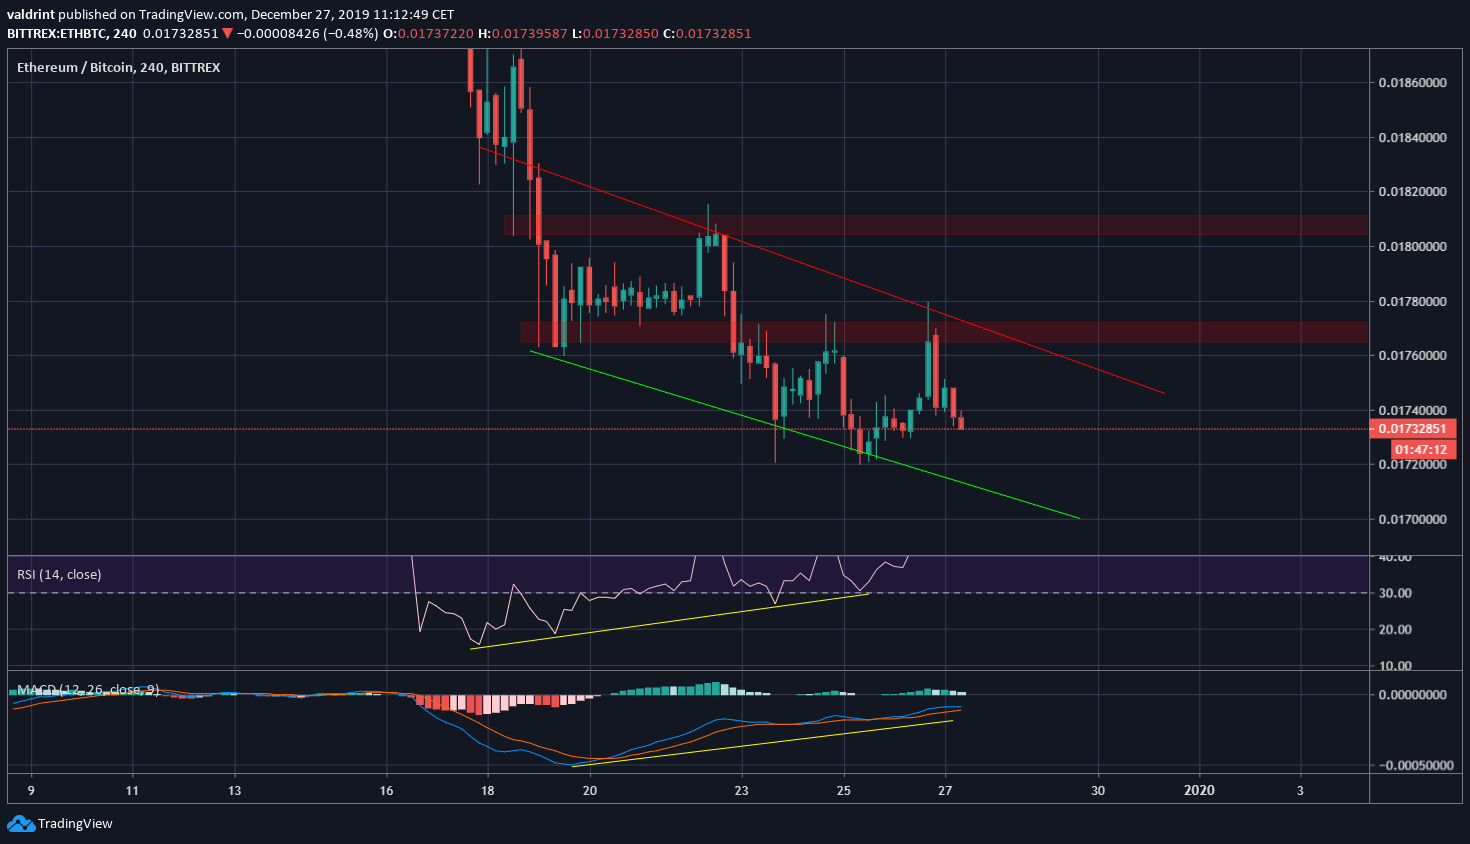
In the short-term, the Ethereum price has been trading inside of a descending channel. There is a strong bullish divergence in both the RSI & MACD. This makes us think that the price will break out. If it does, the next resistance areas are found at ₿0.00177 and ₿0.00181. The price should reach at least one of them before continuing its downtrend towards ₿0.0016.
To conclude, the Ethereum price is expected to decrease until it reaches at least ₿0.0016. A short-term increase could ensue before the price resumes its downtrend.
