
Ethereum price is up about 3.4% in the past 24 hours, continuing a rebound signal that first appeared on technical charts yesterday.
But this recovery may be more than a simple bounce. A deeper look shows a quiet positioning shift that many traders might have missed. Ethereum whales have been aggressively accumulating during the recent crash, even as leverage collapsed and fear dominated the market.
Ethereum Whales Added 9 Million ETH Even as Price Crashed and Leverage Collapsed
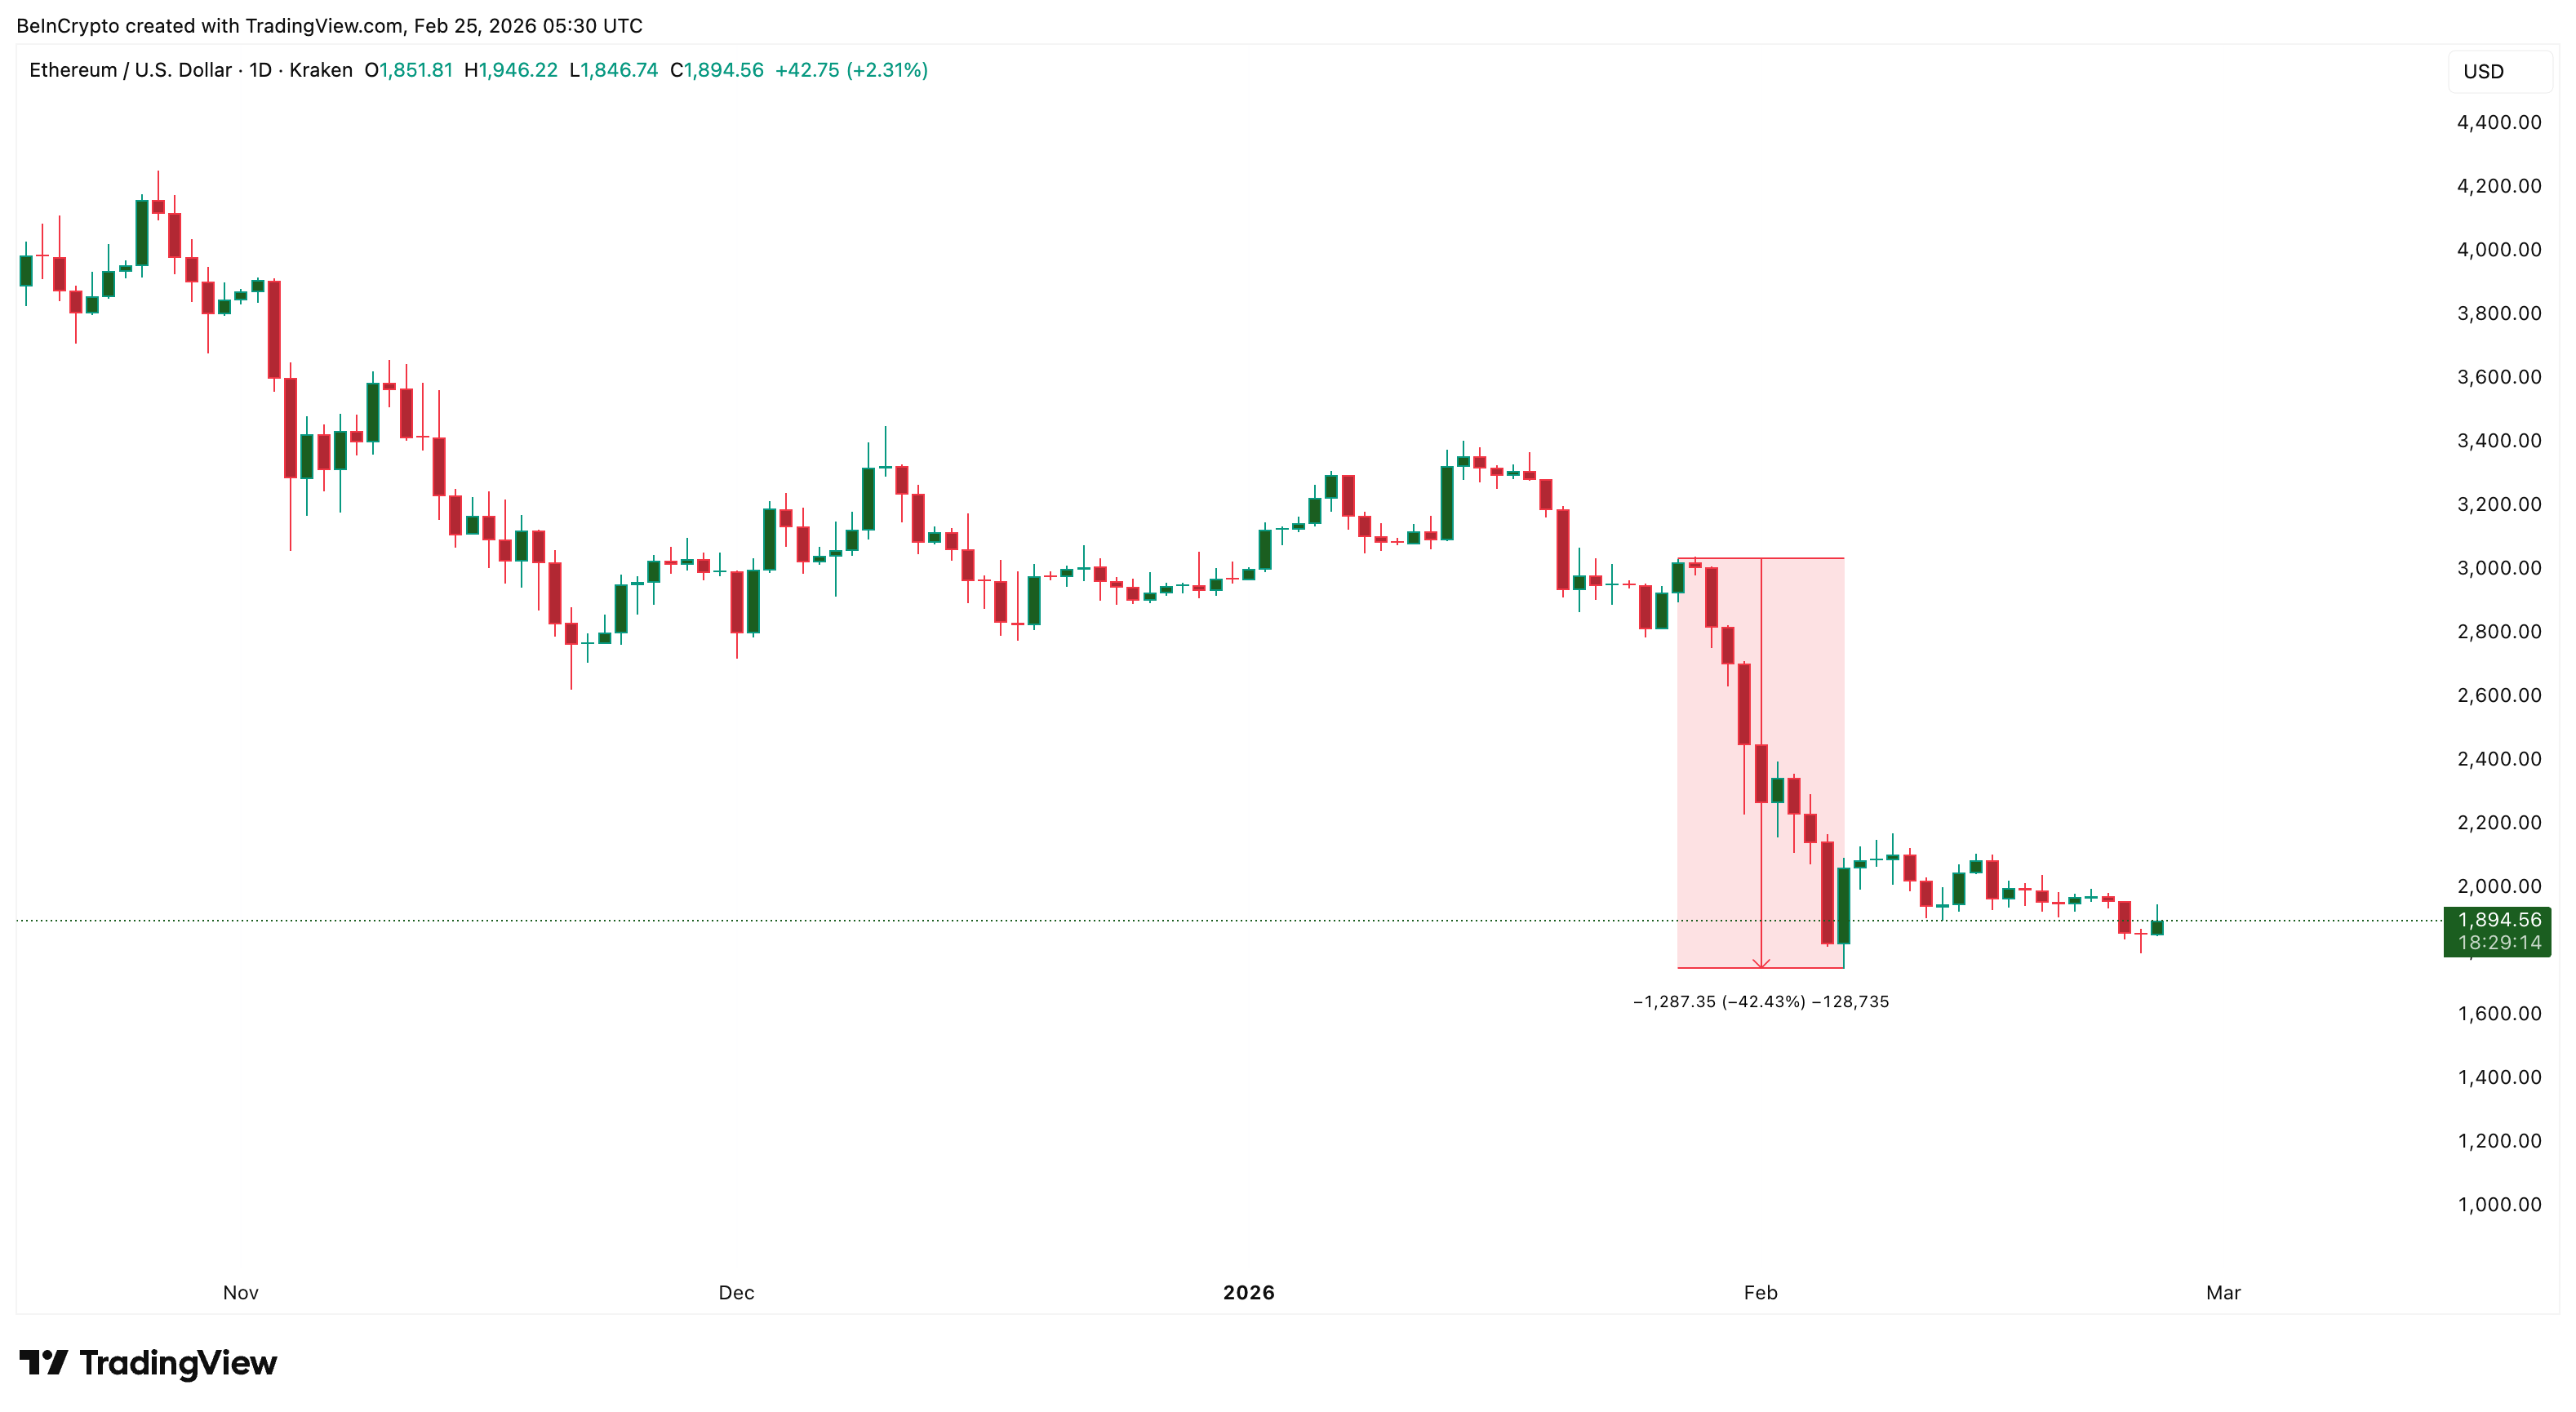
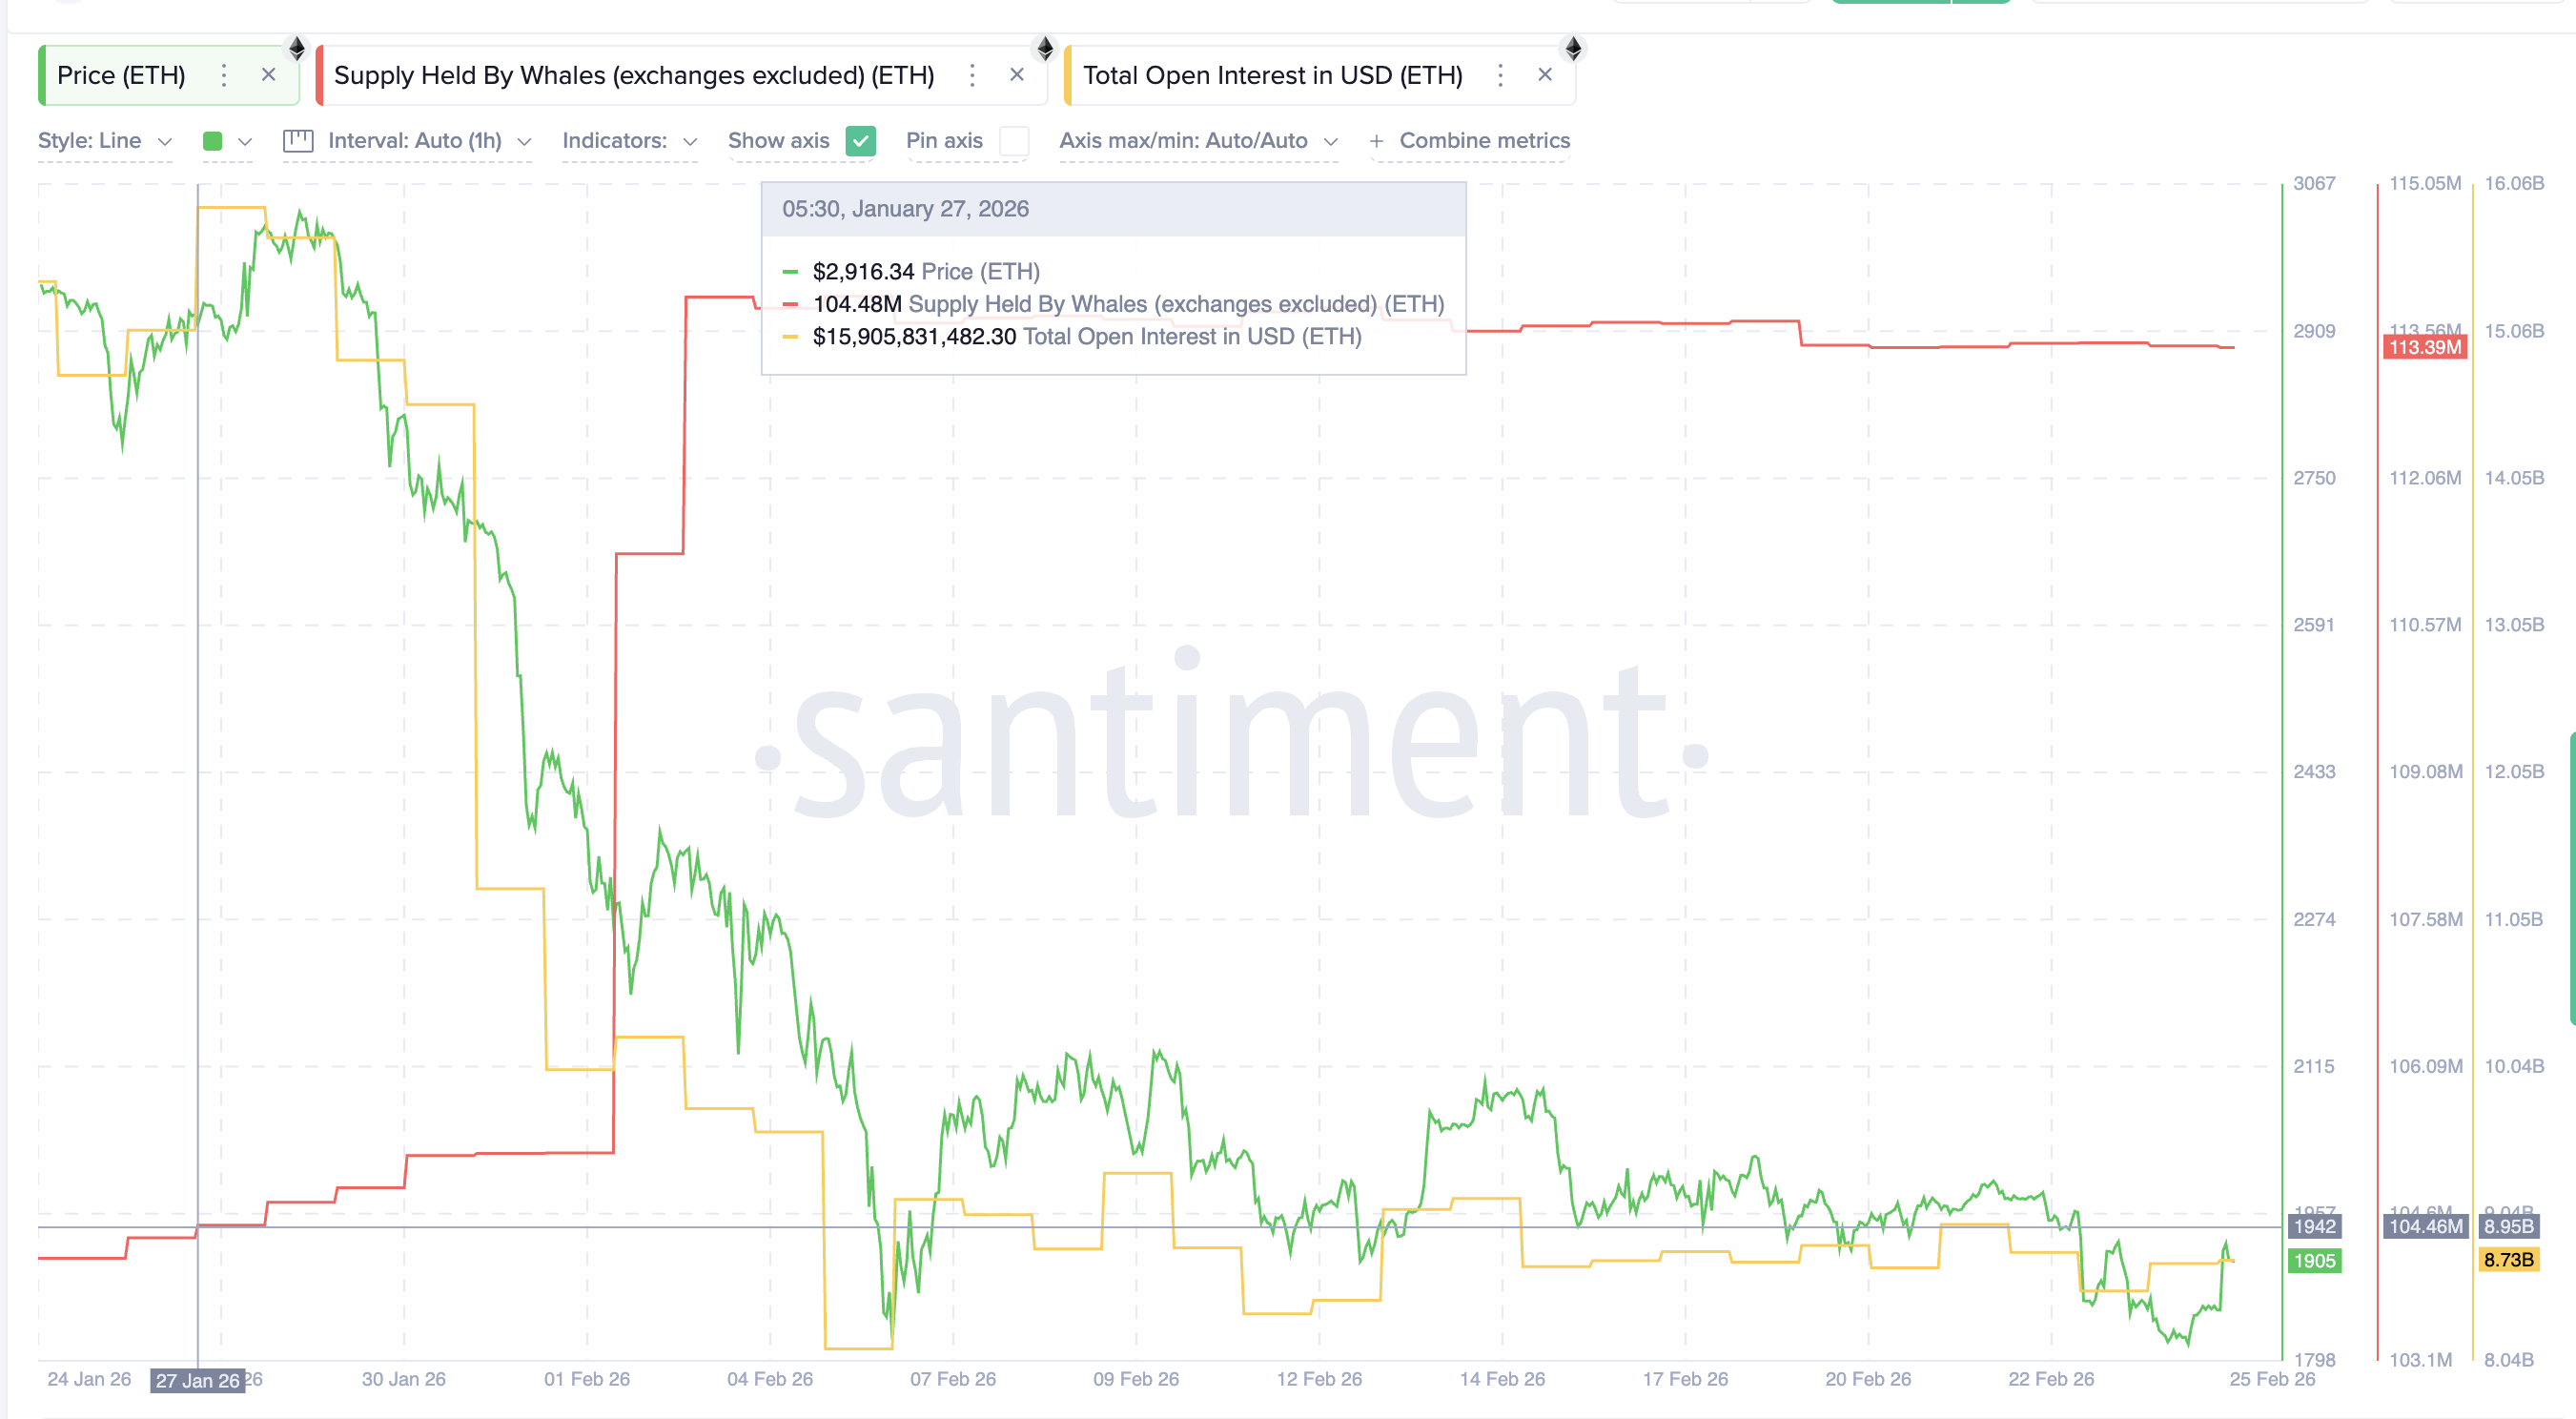
Ethereum’s recent crash wiped out both price and leverage. Between January 27 and February 6, the Ethereum price fell about 43%. During the same period, total open interest fell from $15.9 billion and is currently holding around $8.73 billion. Open interest measures total leveraged futures positions, so this $7.17 billion drop confirms a massive leverage flush.
Want more token insights like this? Sign up for Editor Harsh Notariya’s Daily Crypto Newsletter here.
A leverage flush happens when leveraged traders are forced out of positions, usually during sharp price drops. This removes speculative pressure from the market.
But while traders were force exiting, whales were doing the opposite.
Large Ethereum holders increased their holdings from 104.48 million ETH on January 27 to 113.39 million ETH now, barring a few smaller dumps in between. This means whales net added 8.91 million ETH during the crash. At an estimated average price near $2,100 during this period, that equals roughly $18.7 billion worth of accumulation.
This shows whales were not panic-selling. Instead, they were absorbing supply during forced liquidations. This type of behavior usually signals long-term positioning rather than short-term trading.
Long-Term Holders and Exchange Flows Now Align With Whale Accumulation
Whales alone do not confirm a structural shift. Long-term ETH holders must also show conviction.
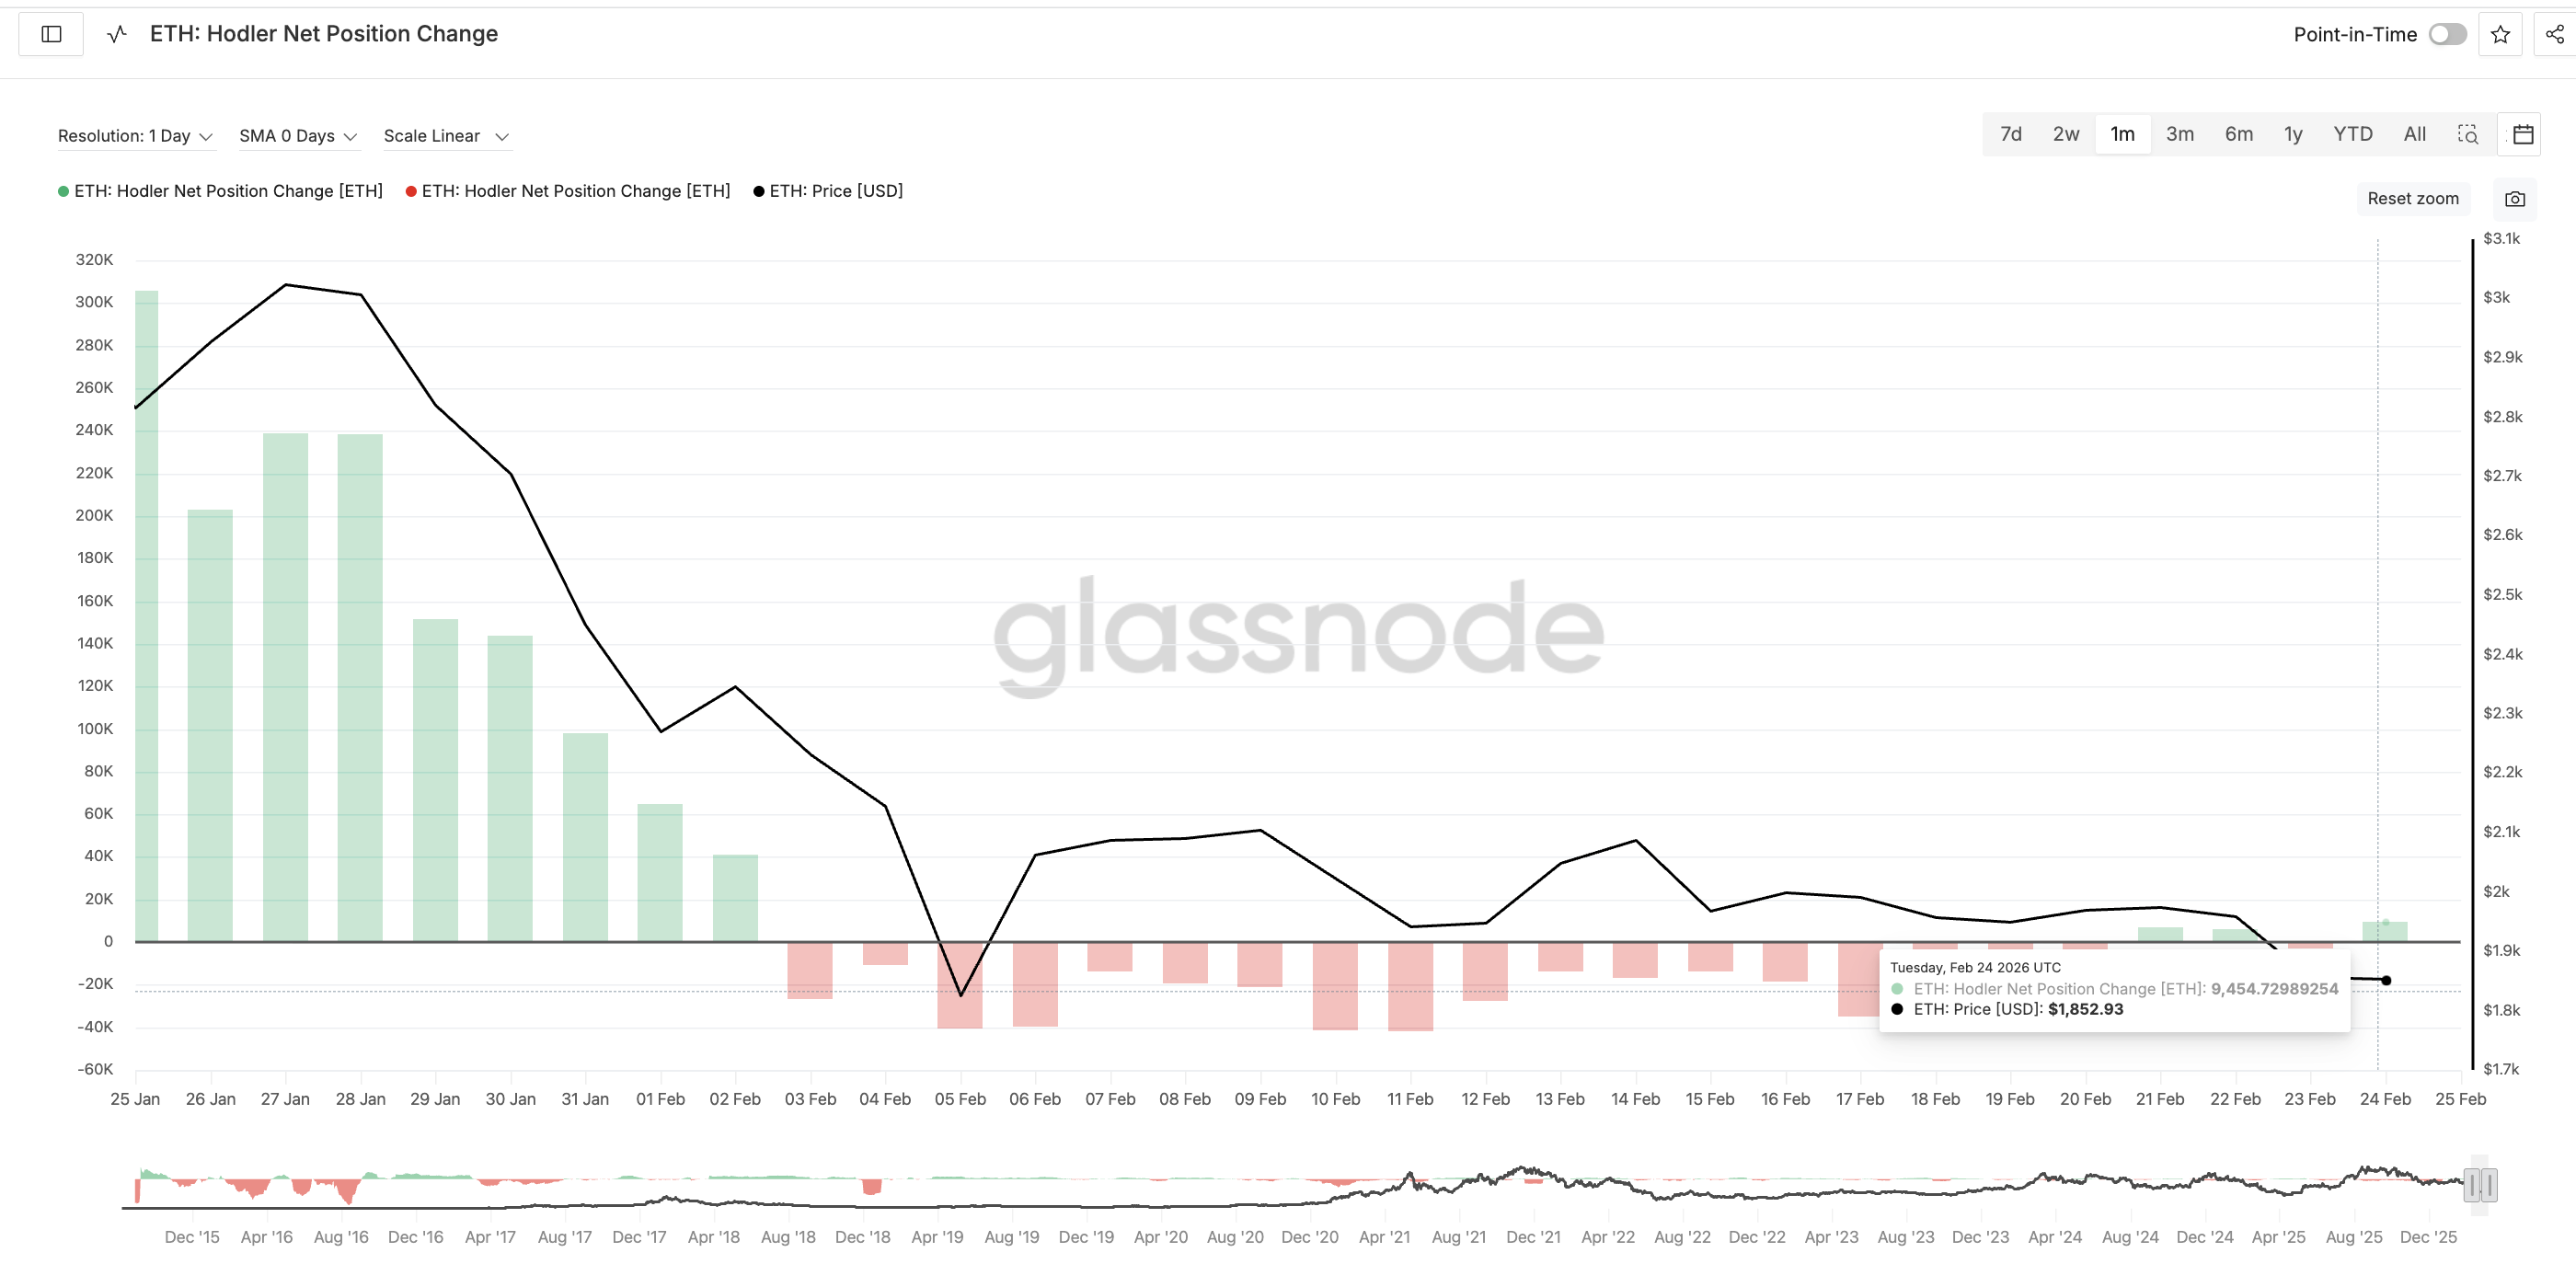
Initially, long-term holders showed uncertainty. The HODLer Net Position Change metric stayed negative through most of early February, showing selling pressure even among experienced investors. The price dip seems to have scared them off eventually,
But this behavior has recently changed.
On February 21, long-term holders began accumulating again. By February 24, they added 9,454 ETH in a single day. This shift suggests long-term investors are starting to align with whale accumulation after weeks of hesitation. Exchange flow data adds another important layer.
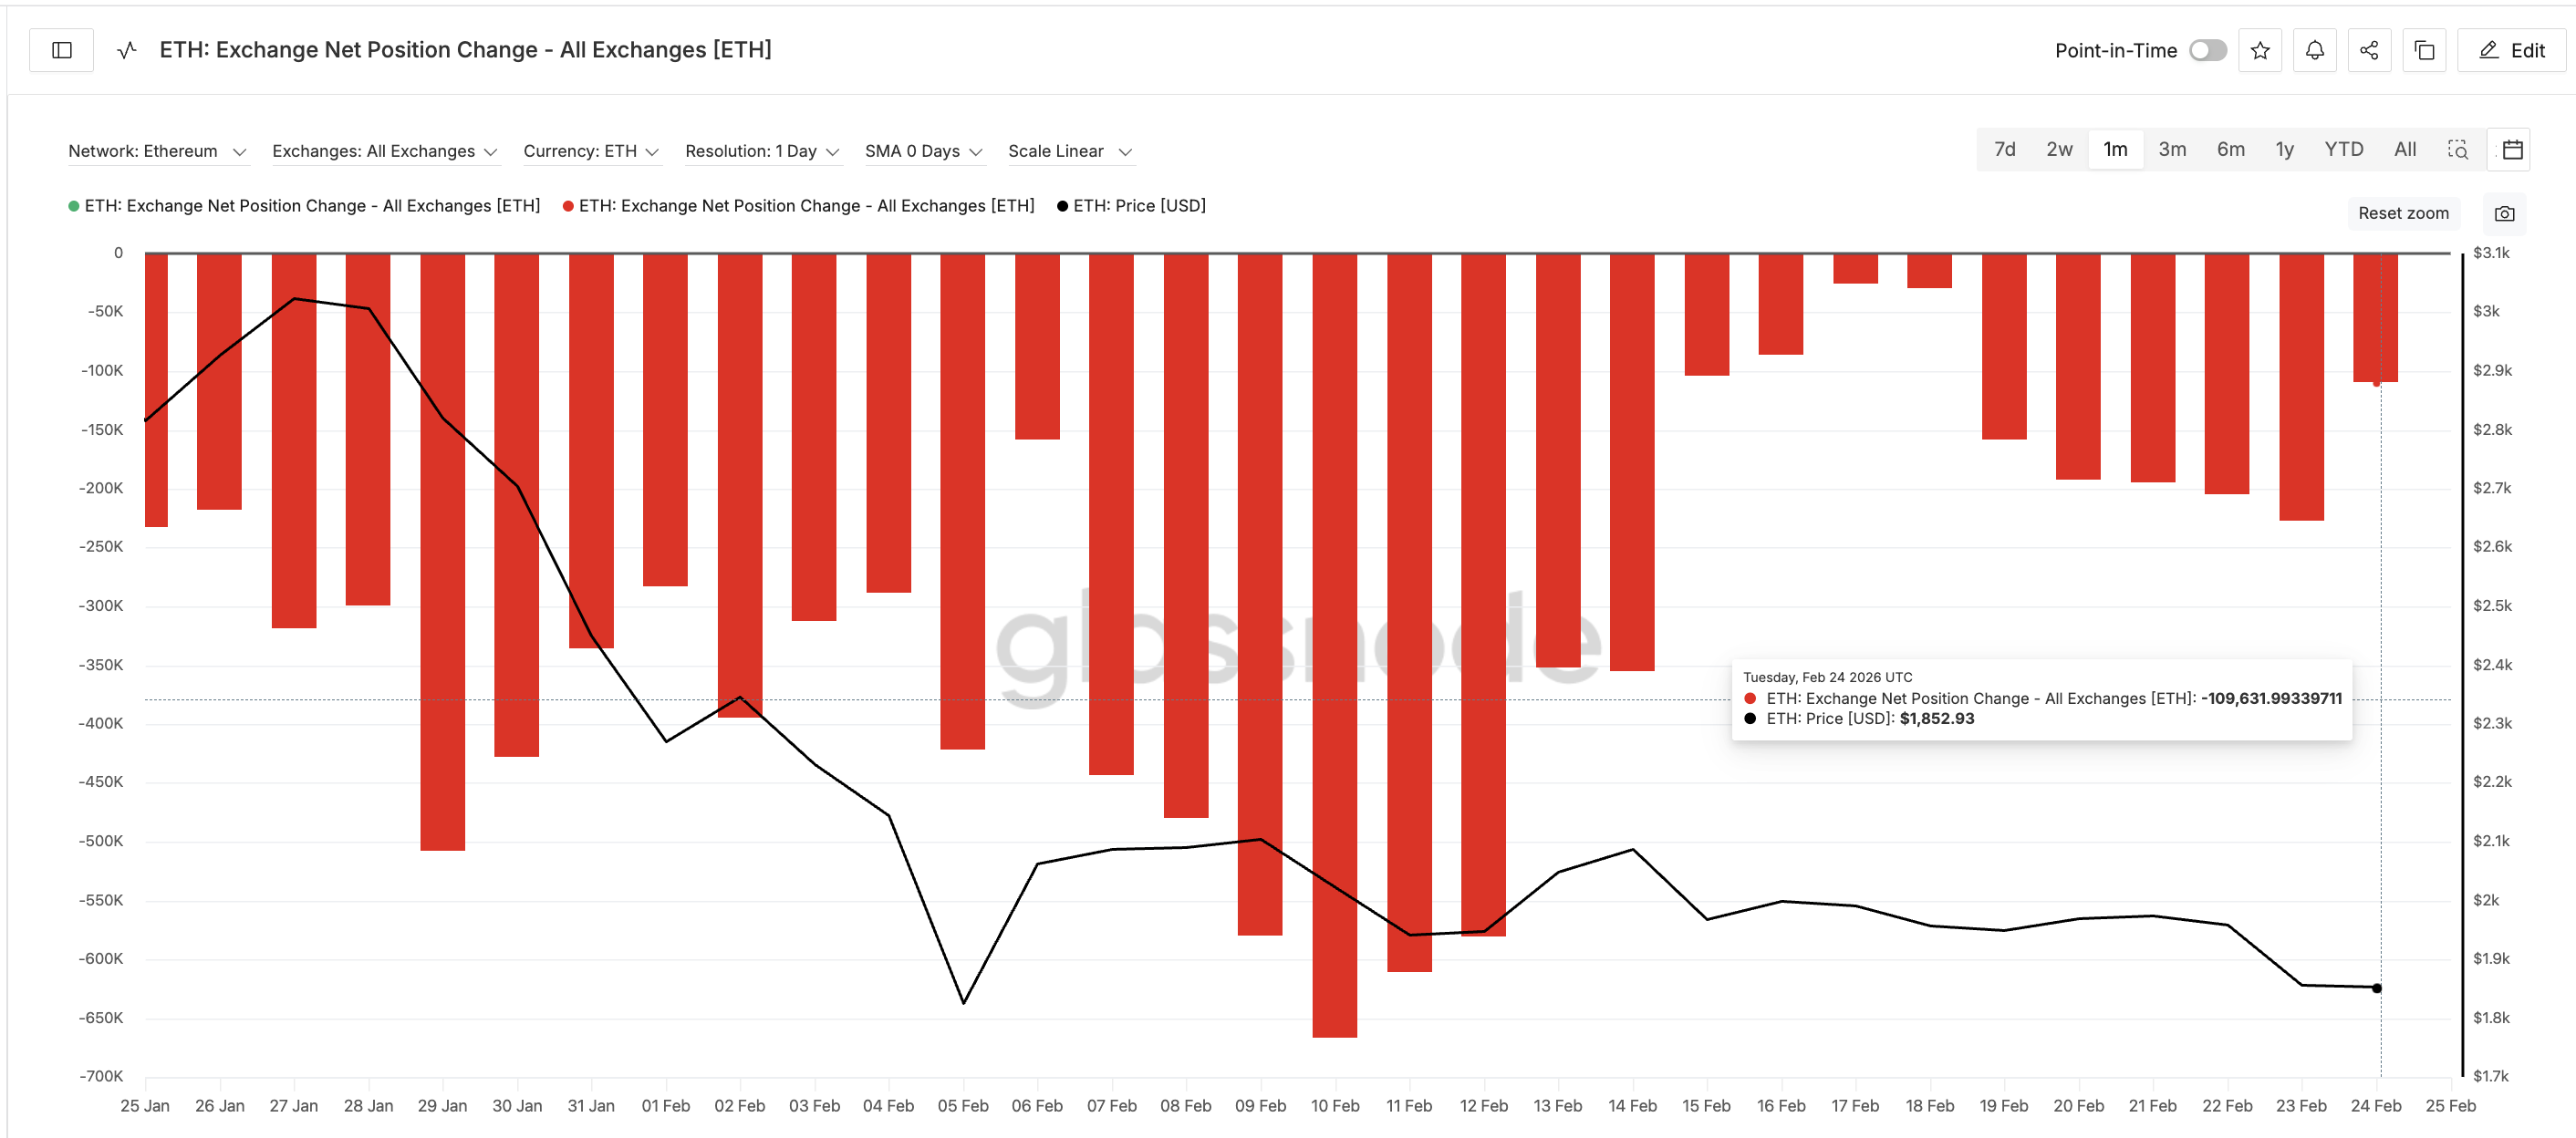
Exchange Net Position Change remained negative throughout the crash. Negative values mean coins are leaving exchanges rather than entering them. This shows investors were moving ETH into private wallets instead of preparing to sell.
For example, exchange outflows reached 227,300 ETH on February 23. Although outflows have slowed to 109,631 ETH on the next day, the trend still shows net accumulation rather than panic selling.
And also, the reduced outflows can be good news. Here is how:
Short-term holders also appear to be exiting.
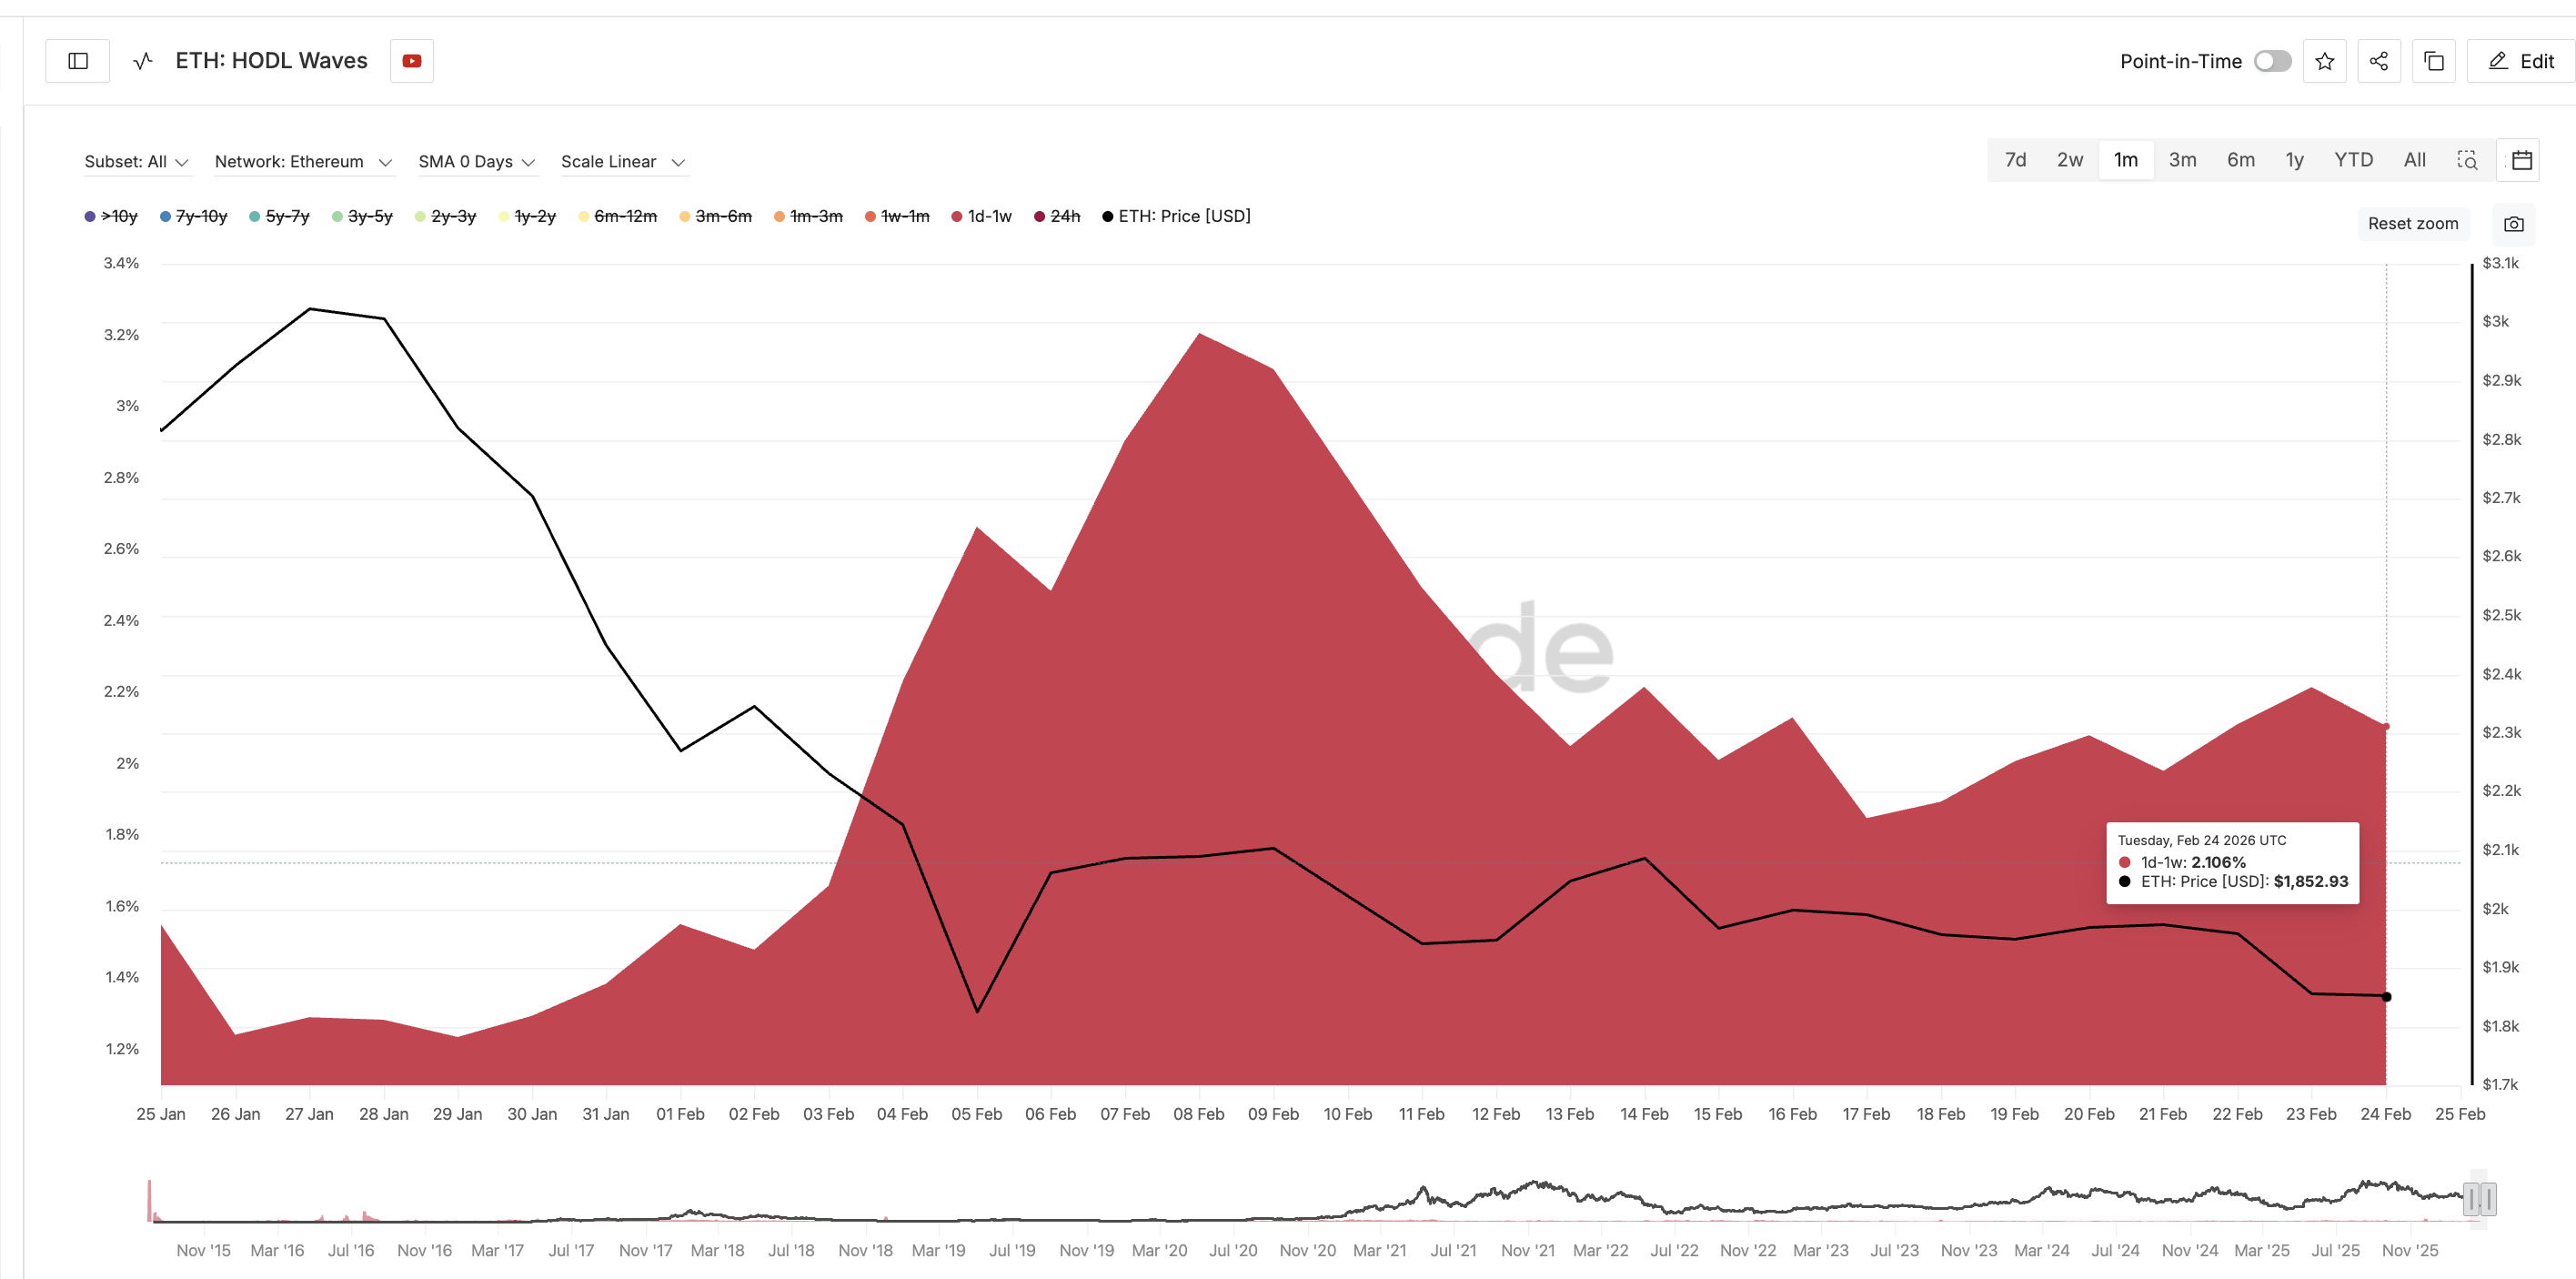
The share of Ethereum supply held by short-term holders, defined as those holding for less than one week, dropped from 3.2% in early February to 2.1% now. This trend was revealed using the HODL Waves metric, which segregates cohorts by time held.
This confirms speculative traders have been flushed out of the market. That could also explain the lower outflow number.
When weak hands exit and strong hands accumulate, markets often move toward structural bottoms. This supports the bullish market shift thesis discussed earlier.
Ethereum Price Now Tests Structural Reversal Zone After Whale Accumulation
Ethereum’s price structure is now beginning to reflect these accumulation signals. The Relative Strength Index (RSI), which measures momentum, is showing a bullish divergence. Between November 21 and February 24, the Ethereum price formed a lower low, but the RSI formed a higher low.
This signals that selling pressure is weakening even though the price has not fully recovered, a technical bullish sign we mentioned earlier in the intro.
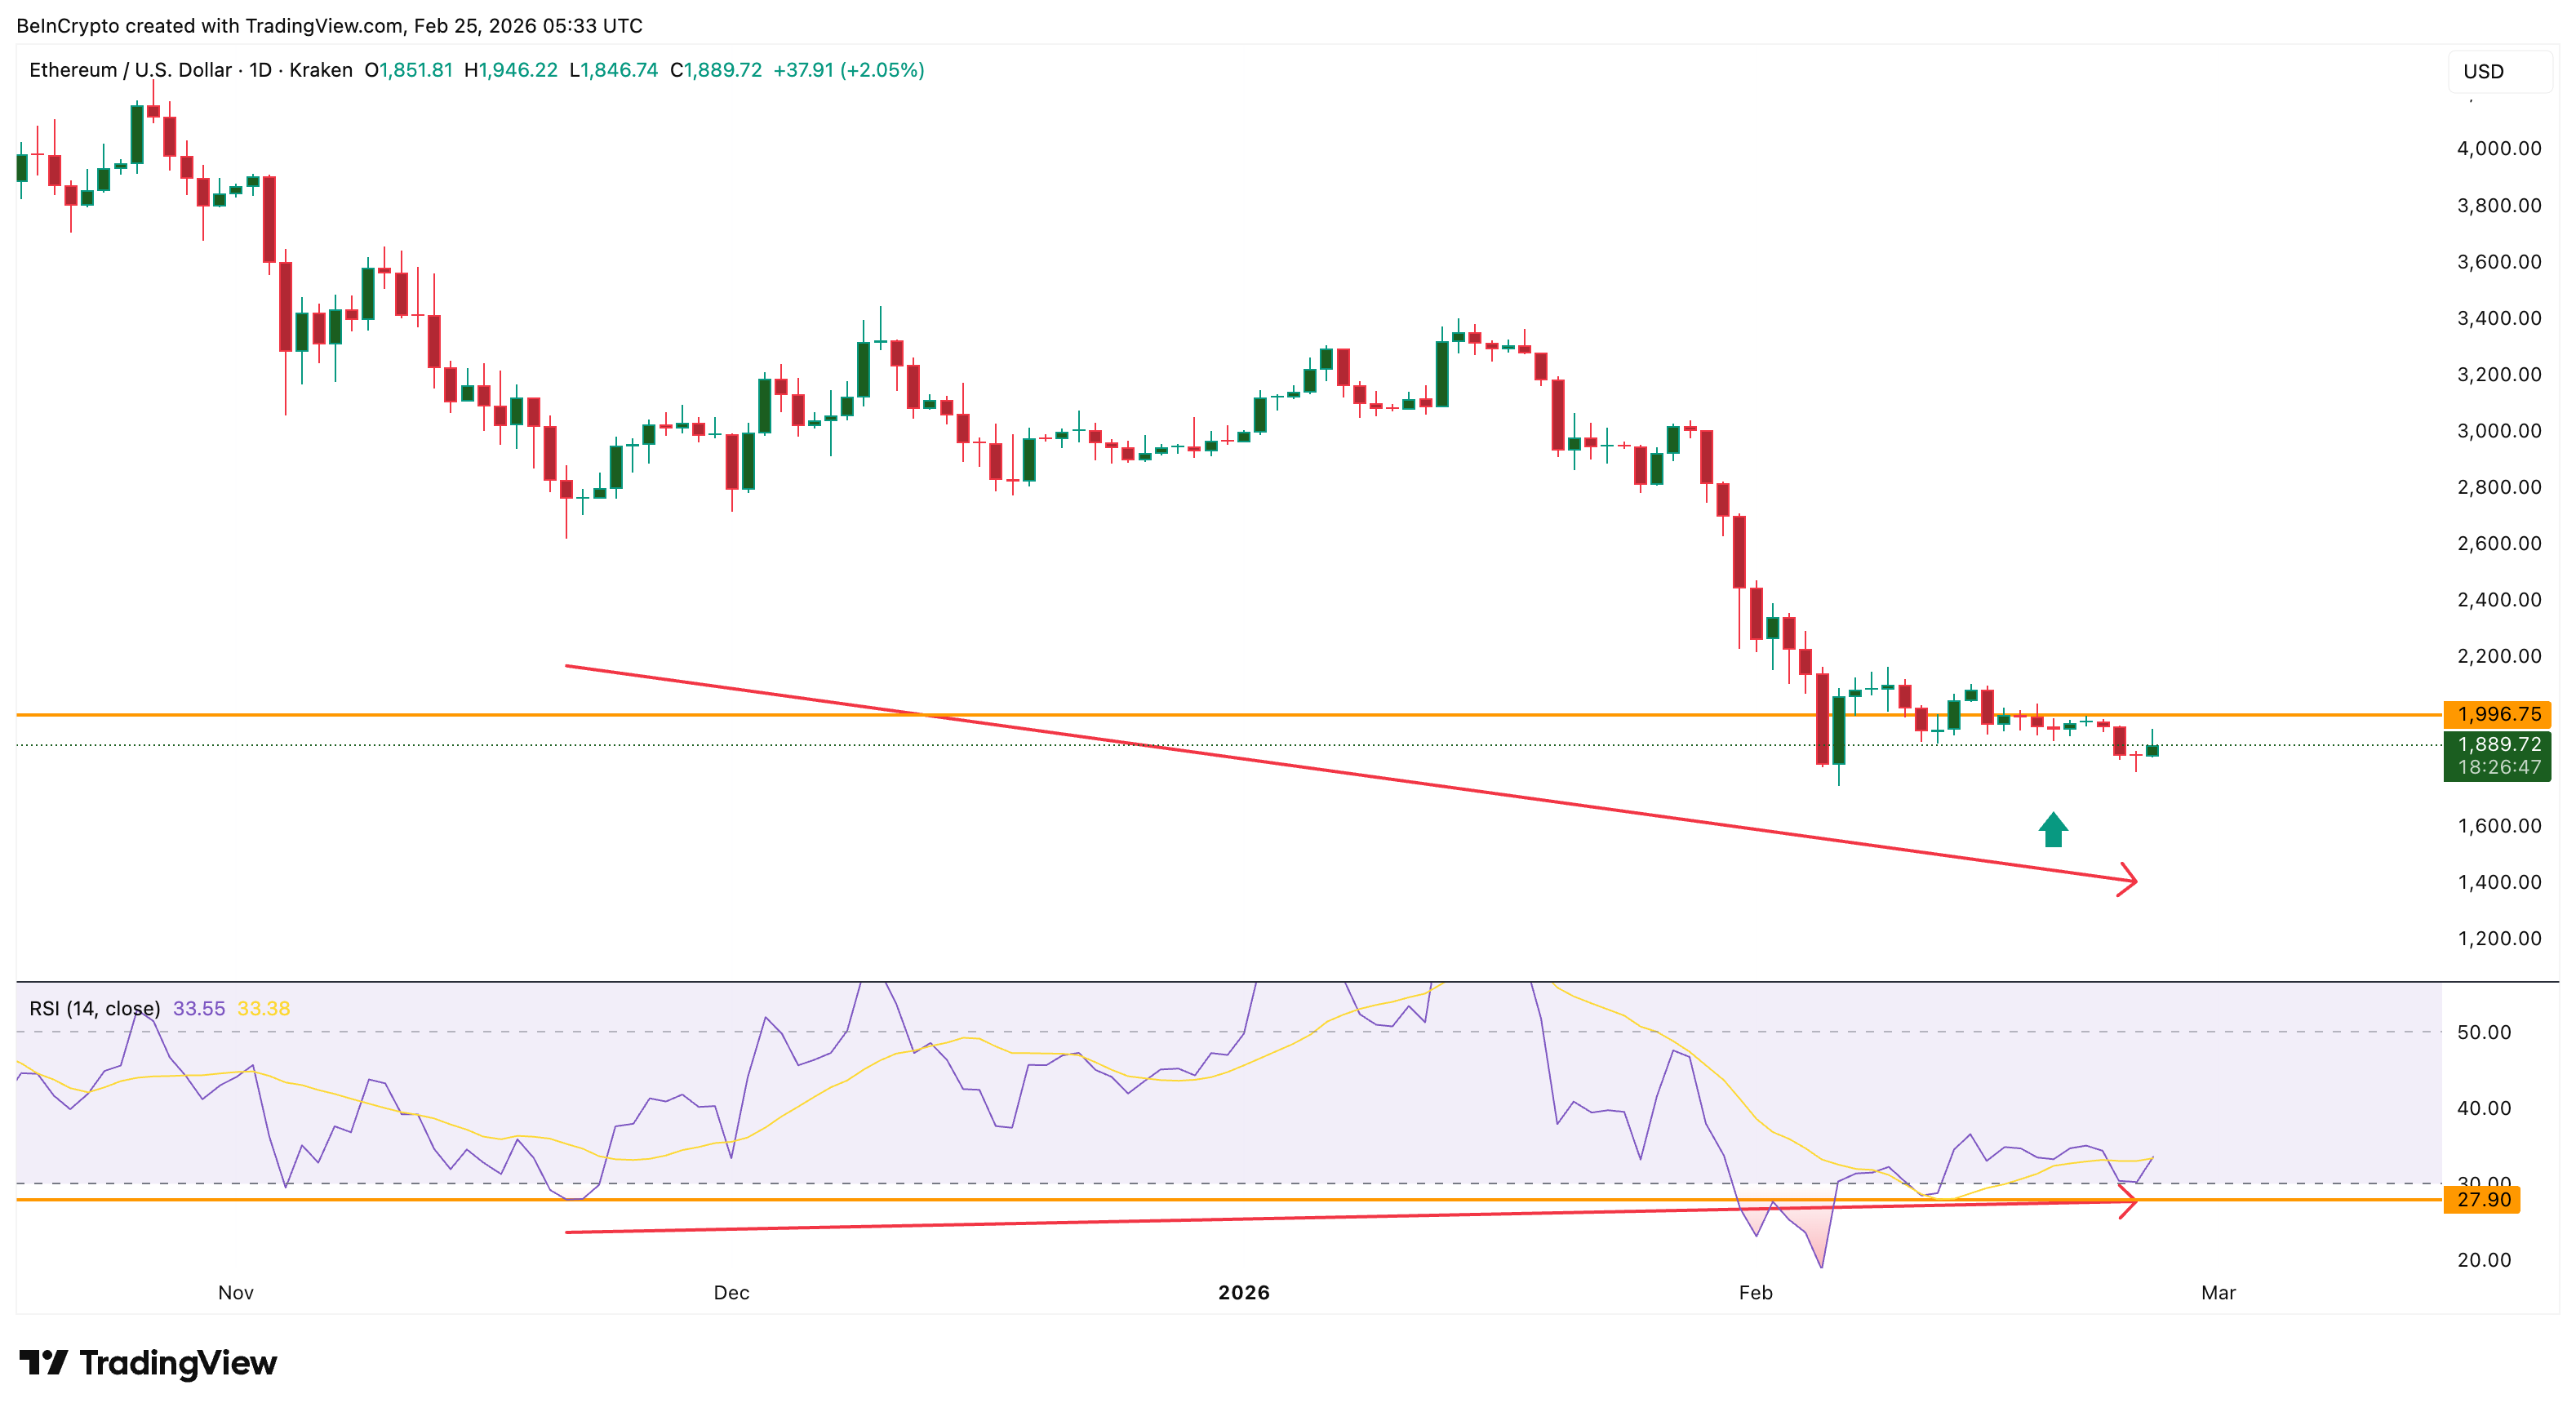
A similar divergence appeared on February 19, but it probably failed because long-term holder support was weaker at that time. The current setup differs because accumulation is now occurring across whales, long-term holders, and exchange flows. This increases the probability of a stronger rebound attempt, if not a theoretical reversal.
Ethereum is now testing a critical recovery zone.
The first resistance sits at $1,990. If Ethereum breaks above this level, the next target becomes $2,050. A move above $2,240 would confirm a larger recovery and signal that the structural bottom may already be in place. This would represent about a 20% move from current levels. However, downside risks remain.
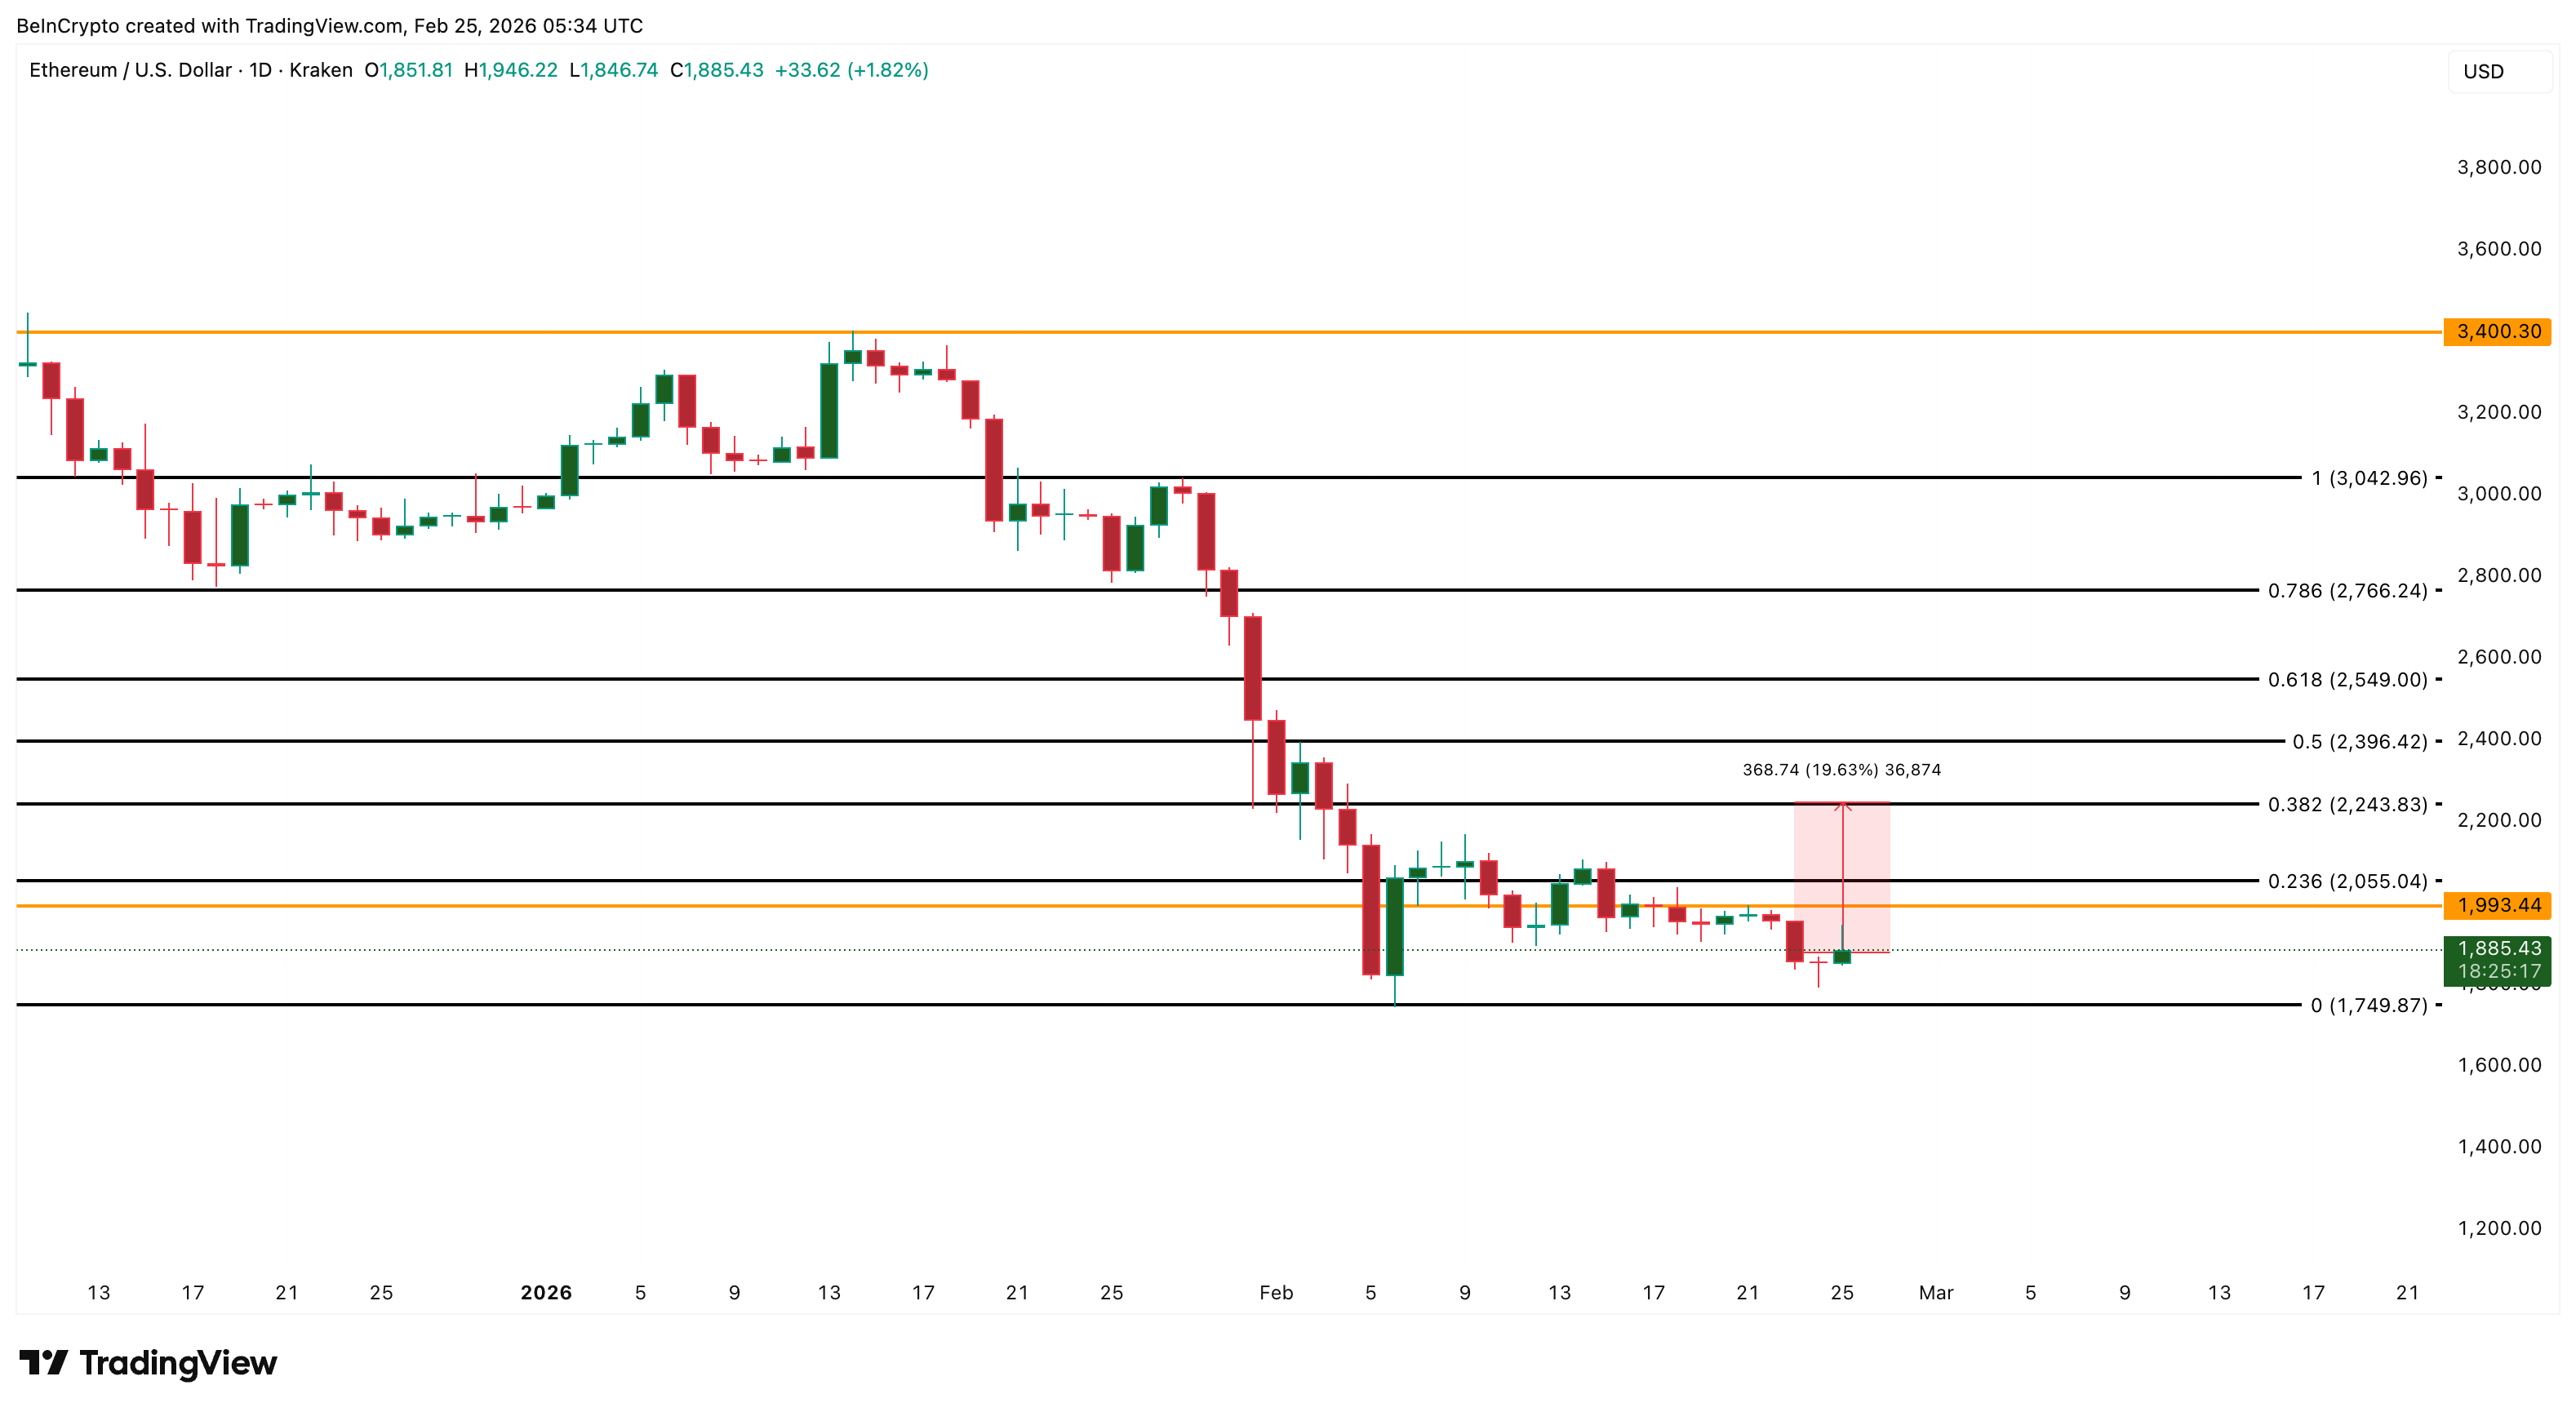
If Ethereum falls below $1,740 before rebounding higher, the structural bottom thesis would fail. This would signal that whales may have accumulated at a local bottom, while the broader downtrend remains active.
For now, the data shows a rare alignment. Whales added nearly 9 million ETH during a $7 billion leverage collapse. Long-term holders have resumed accumulation. Exchange outflows remain dominant, and weak hands are exiting. Ethereum’s next move will now decide whether this accumulation marks the beginning of a true structural bottom or just another temporary pause in a larger downtrend.
