
Ethereum price is still holding firm, up 1.1% in the past 24 hours at around $4,770. The asset trades less than 2% below its all-time high, extending three-month gains to 85% and one-year returns to over 70%.
The rally has been one of the strongest among major altcoins, but traders are now split between two scenarios: a short pullback or a breakout that takes ETH past $5,500. There are reasons why both could happen.
Large Holders Continue to Accumulate
Ethereum price has stayed resilient near $4,770, and big holders have quietly added to their stashes. Wallets holding between 1 million and 10 million ETH increased their supply from 7.42 million ETH ($35.39 billion) on August 19 to 7.63 million ETH ($36.39 billion) at press time.
That means an extra 210,000 ETH, worth about $1.0 billion at the current price, was absorbed over the past few days.
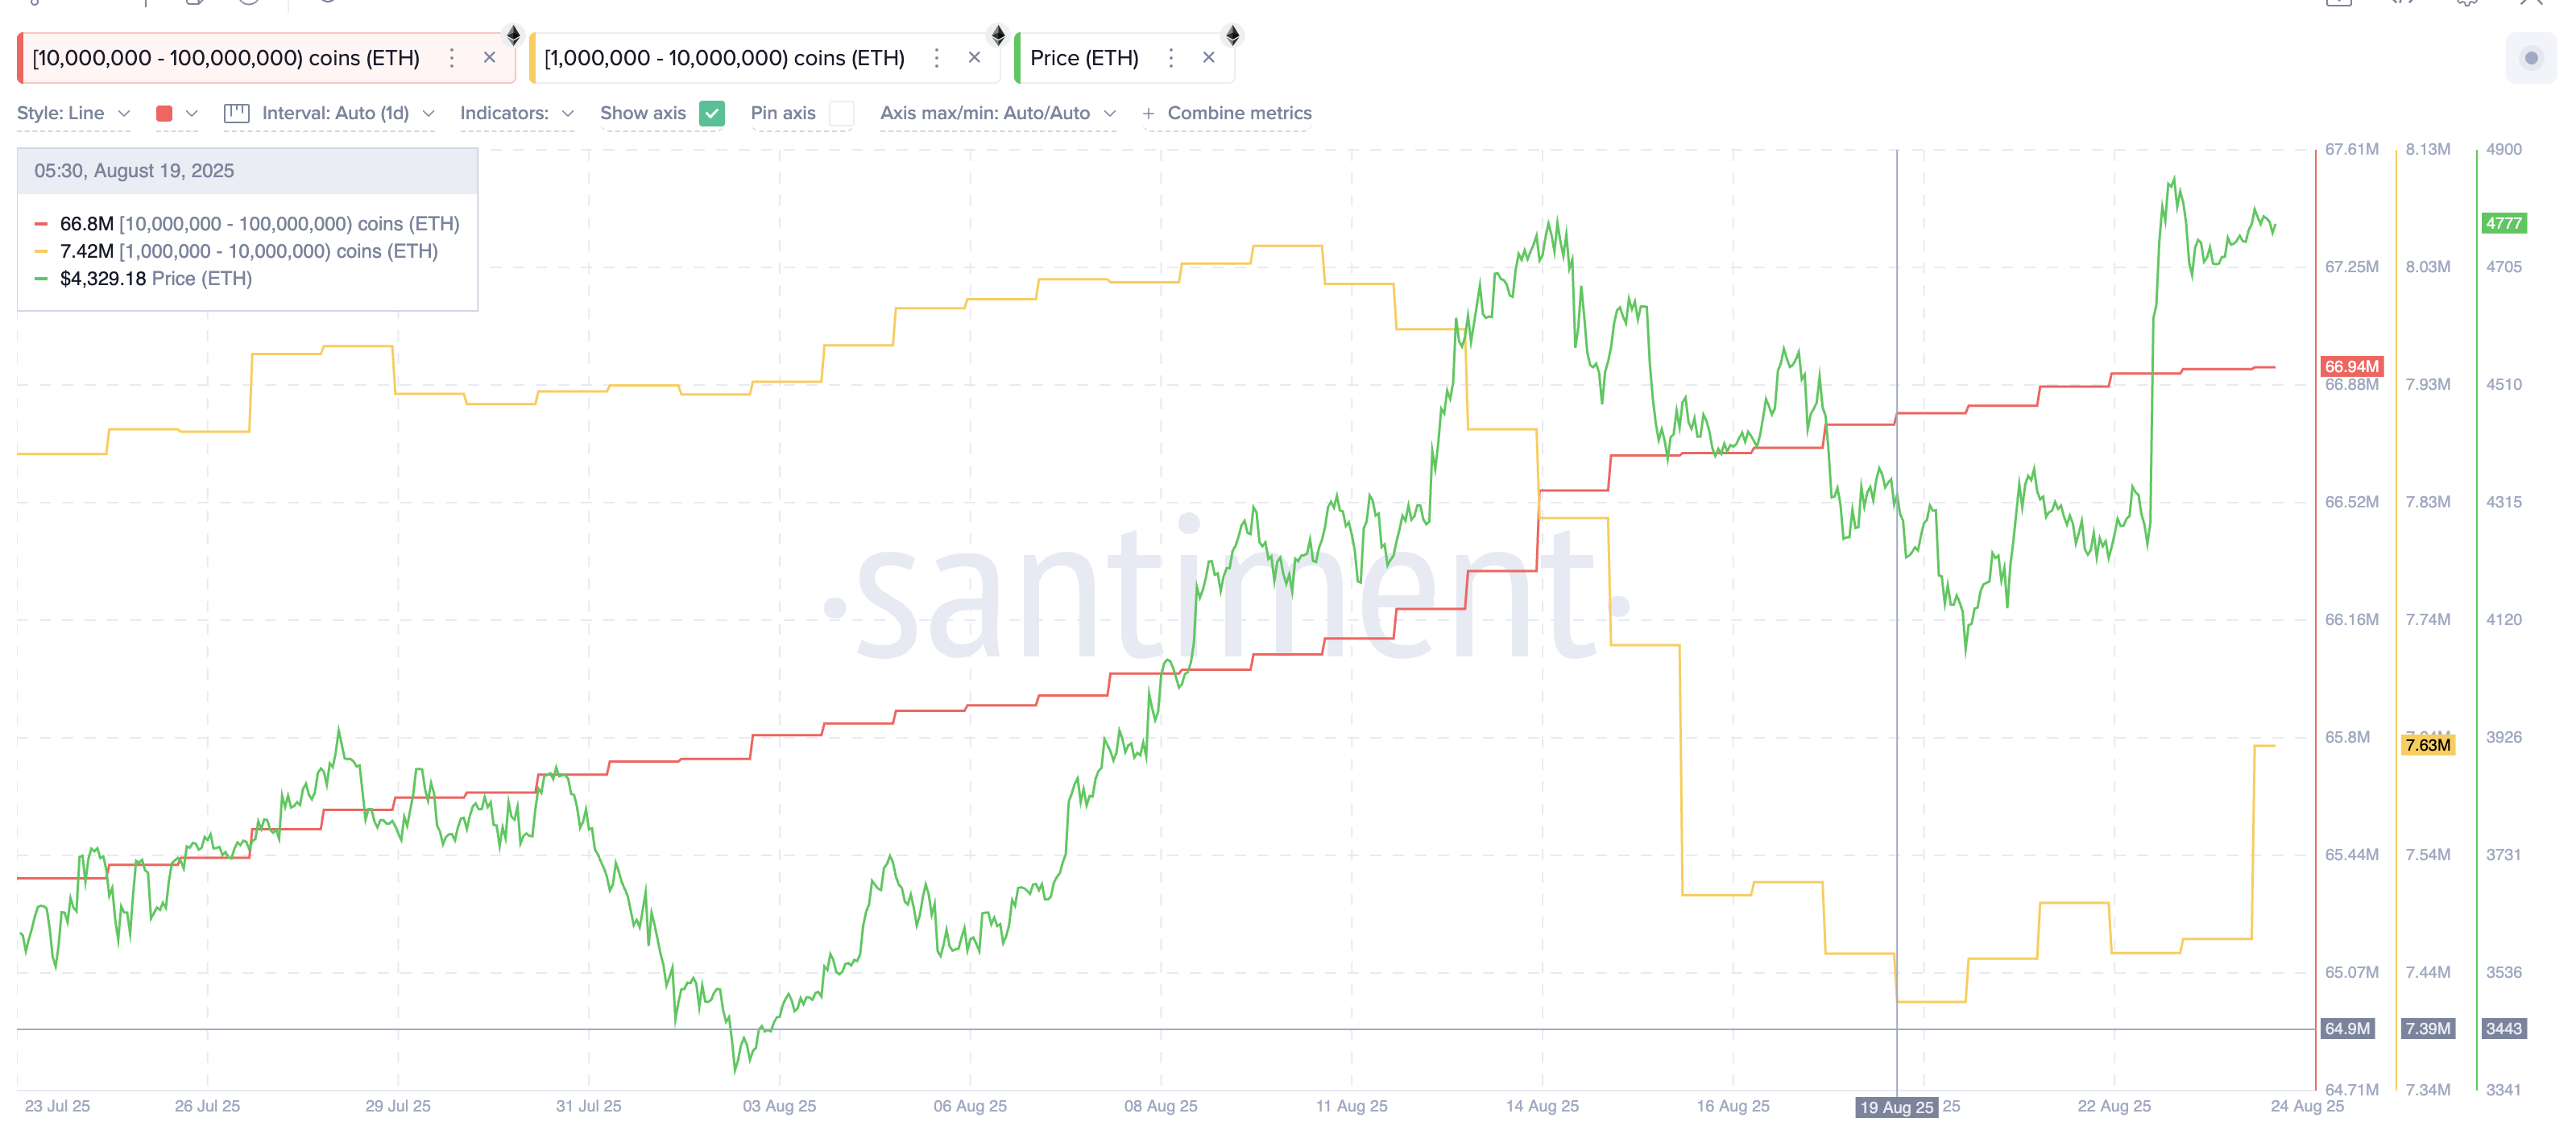
At the same time, the 10 million–100 million ETH cohort lifted holdings from 66.8 million ETH ($318.63 billion) to 66.94 million ETH ($319.30 billion), an addition of around 140,000 ETH valued at $668 million.
Such steady accumulation, even with Ethereum trading just shy of its highs, points to underlying confidence. But while spot buying strengthens the base, on-chain activity shows signs of profit-taking.
This is where metrics like liveliness and the cost-basis heatmap add another layer of context.
Want more token insights like this? Sign up for Editor Harsh Notariya’s Daily Crypto Newsletter here.
Liveliness Hints at a Pullback, But Limited
The Ethereum Liveliness metric, which measures whether coins are being held or spent, has climbed to its highest monthly reading over 0.70. Higher liveliness means more long-held coins are being moved, which is often associated with profit-taking.
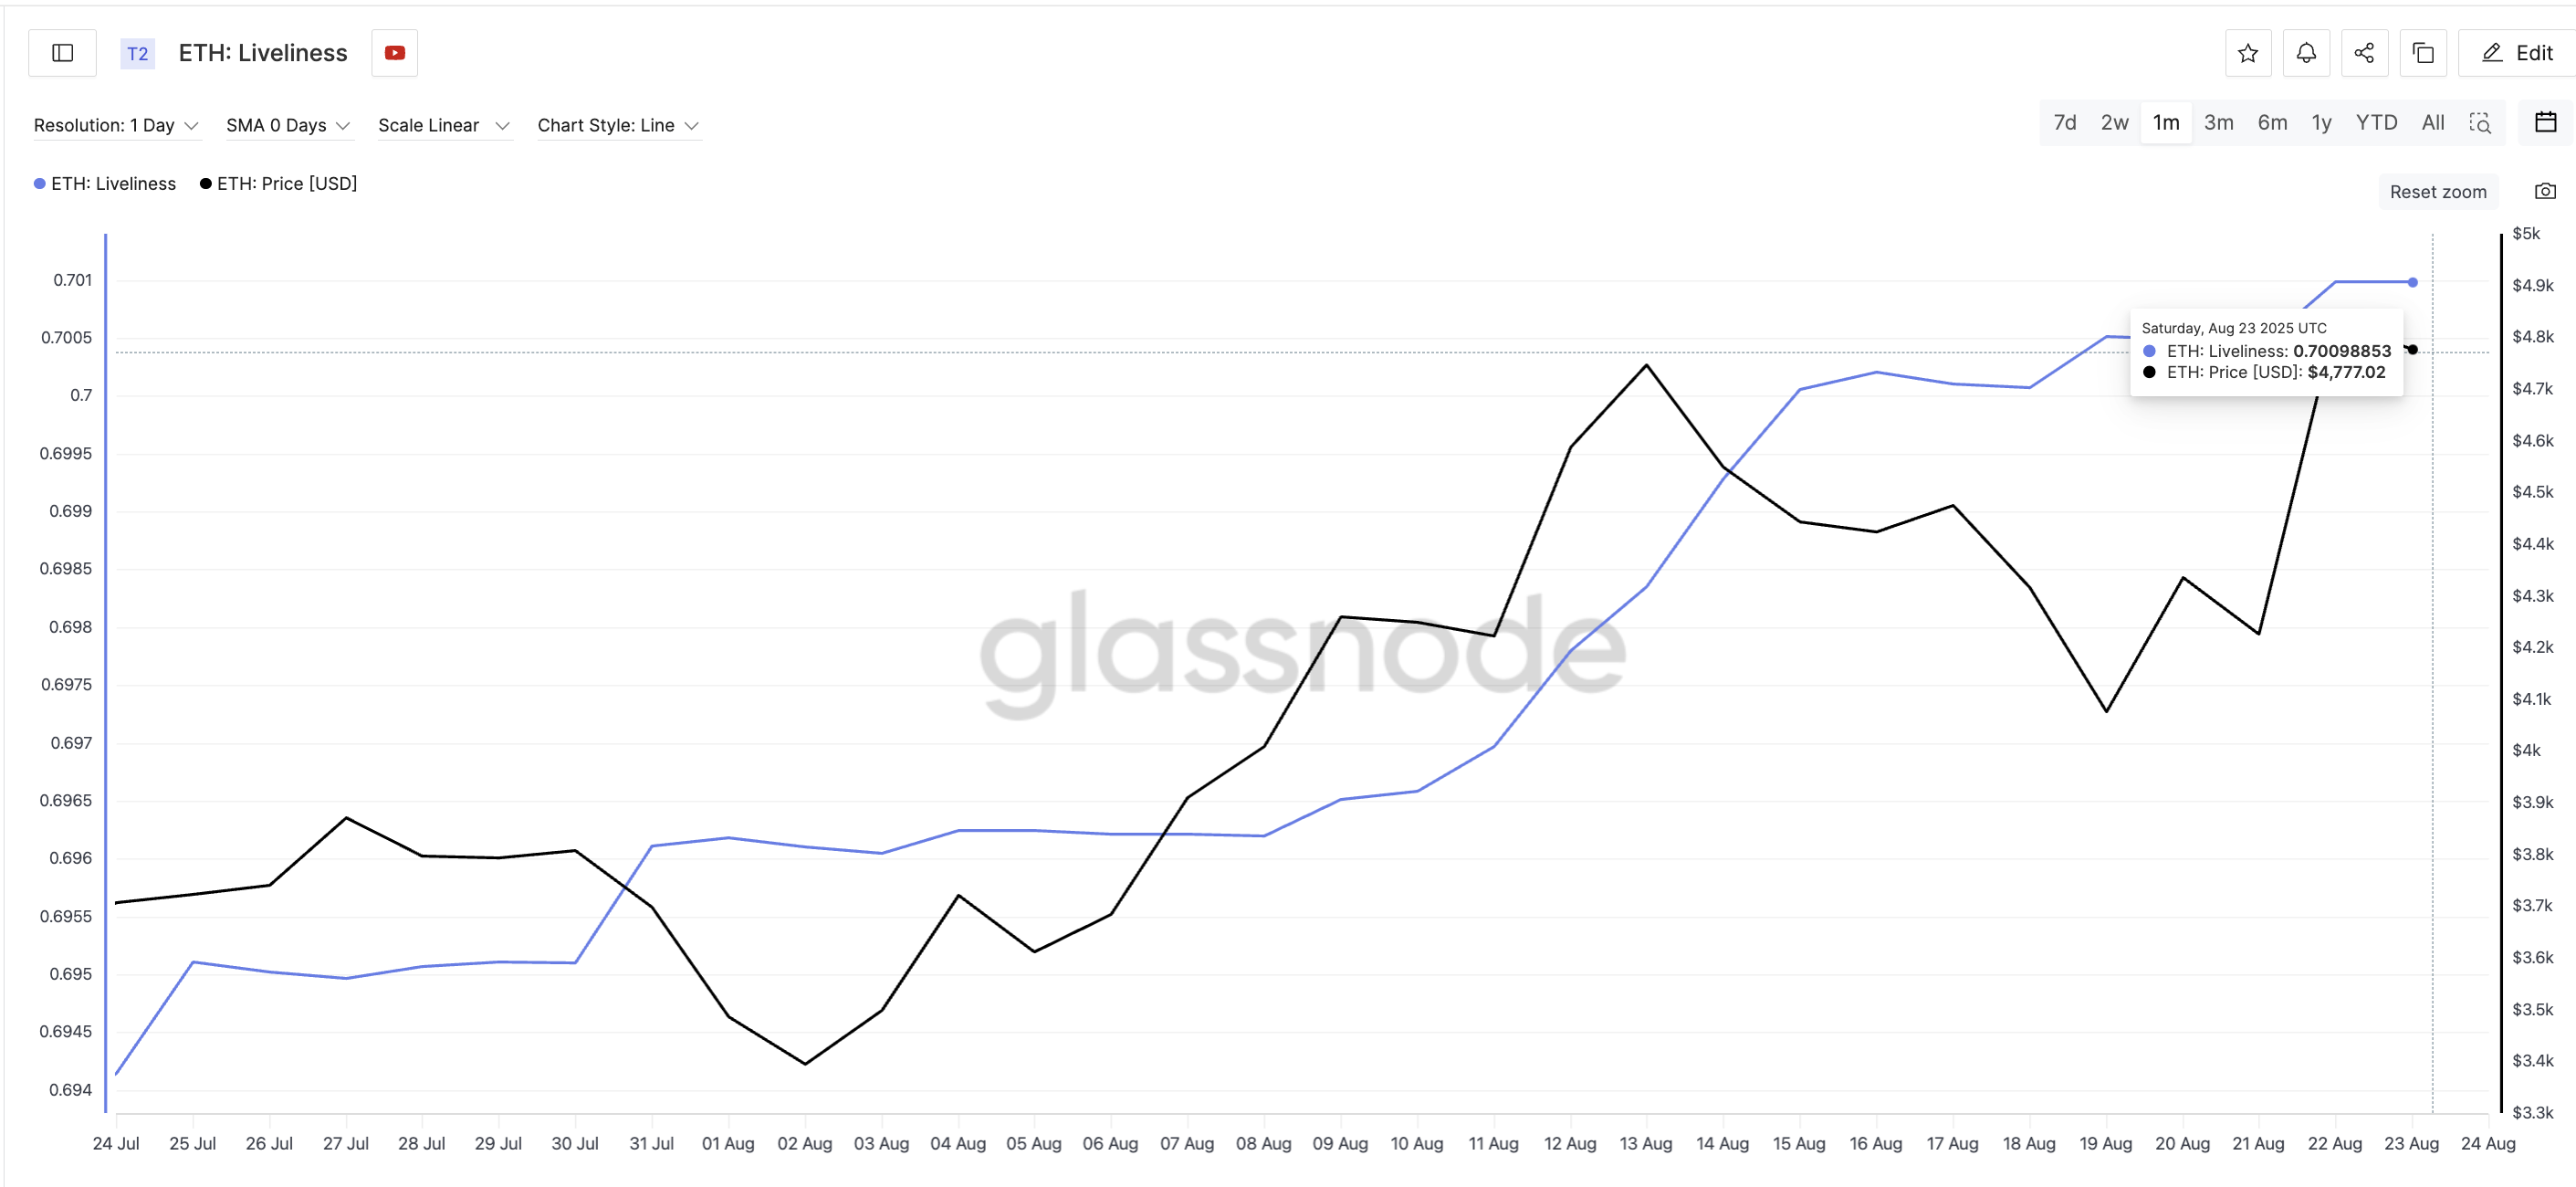
The last time liveliness spiked in early August, Ethereum dropped from $4,748 to $4,077 within days. A similar cooling is possible now, though the scale may be smaller given stronger demand zones underneath.
One reason any pullback may be limited is visible in Ethereum’s Cost Basis Distribution Heatmap. This tool shows where coins last changed hands, highlighting price zones with concentrated ETH buying activity.
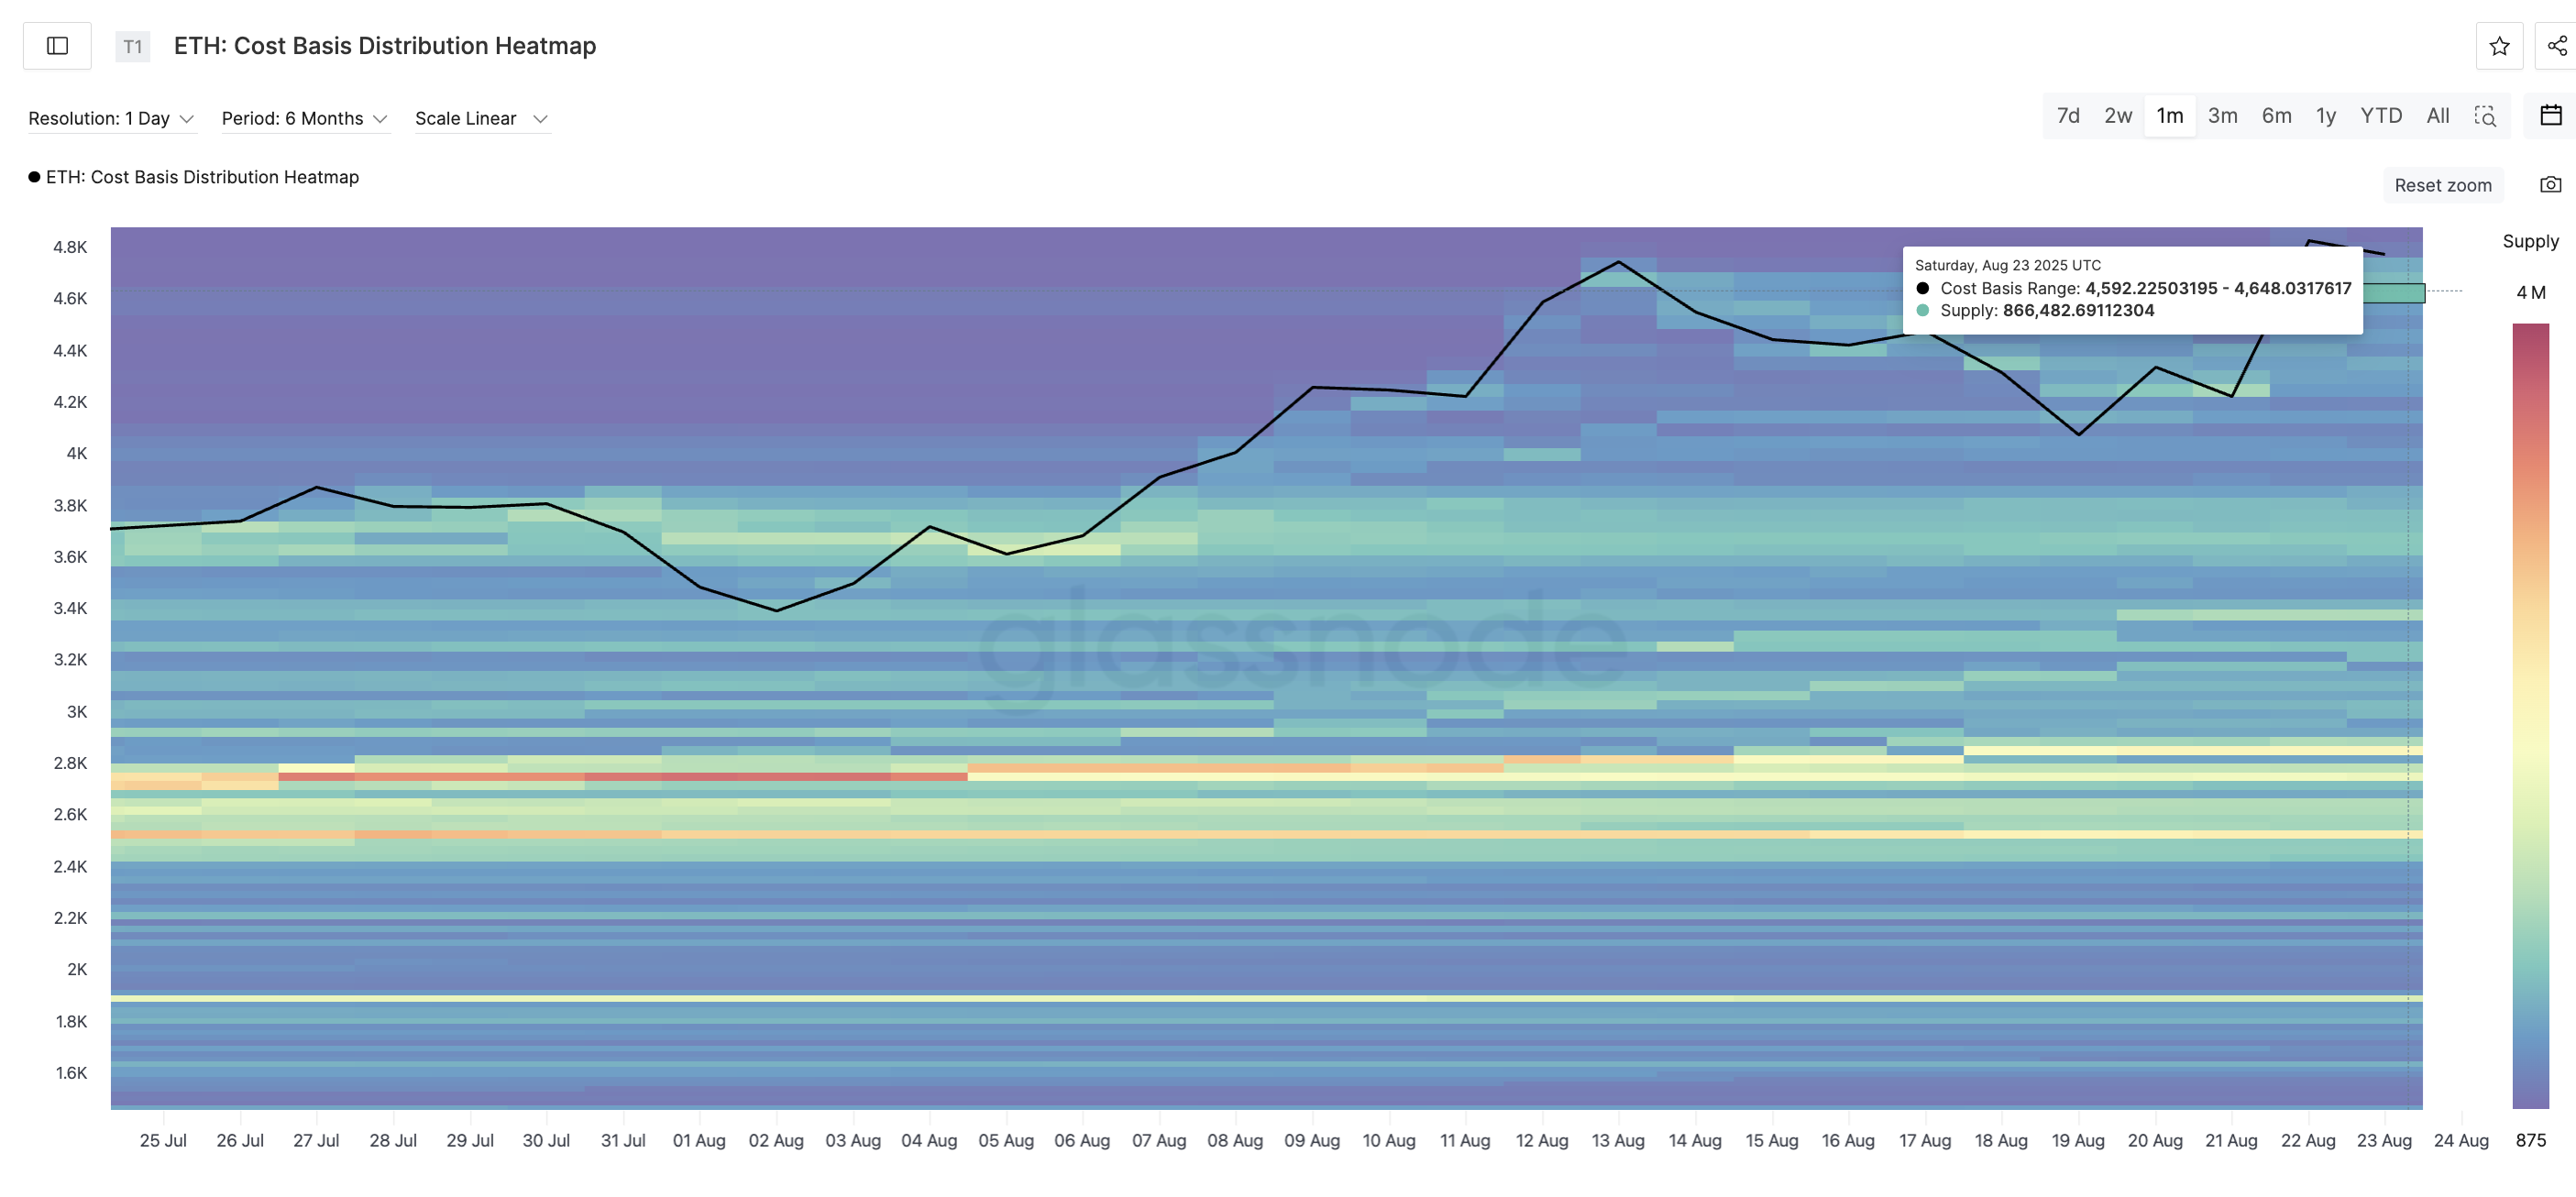
Three key clusters have formed:
- $4,592–$4,648 with almost 866,000 ETH
- $4,648–$4,704 with almost 700,000 ETH
- $4,704–$4,761 with almost 545,000 ETH
Together, these layers of accumulation suggest heavy demand between $4,590 and $4,761. If ETH dips into this zone, buyers will likely absorb selling pressure quickly, limiting downside risks. This is more evident with the large holders, including whales, picking up ETH during the rally. They might want to do the same if the Ethereum price dips a bit.
Key Ethereum Price Levels to Watch
From a charting perspective, Ethereum recently respected the 0.618 Fibonacci extension at $4,948, often one of the strongest resistance levels. A decisive daily close above it would open the path toward the 1.0 extension at $5,496, effectively the $5,500 milestone.
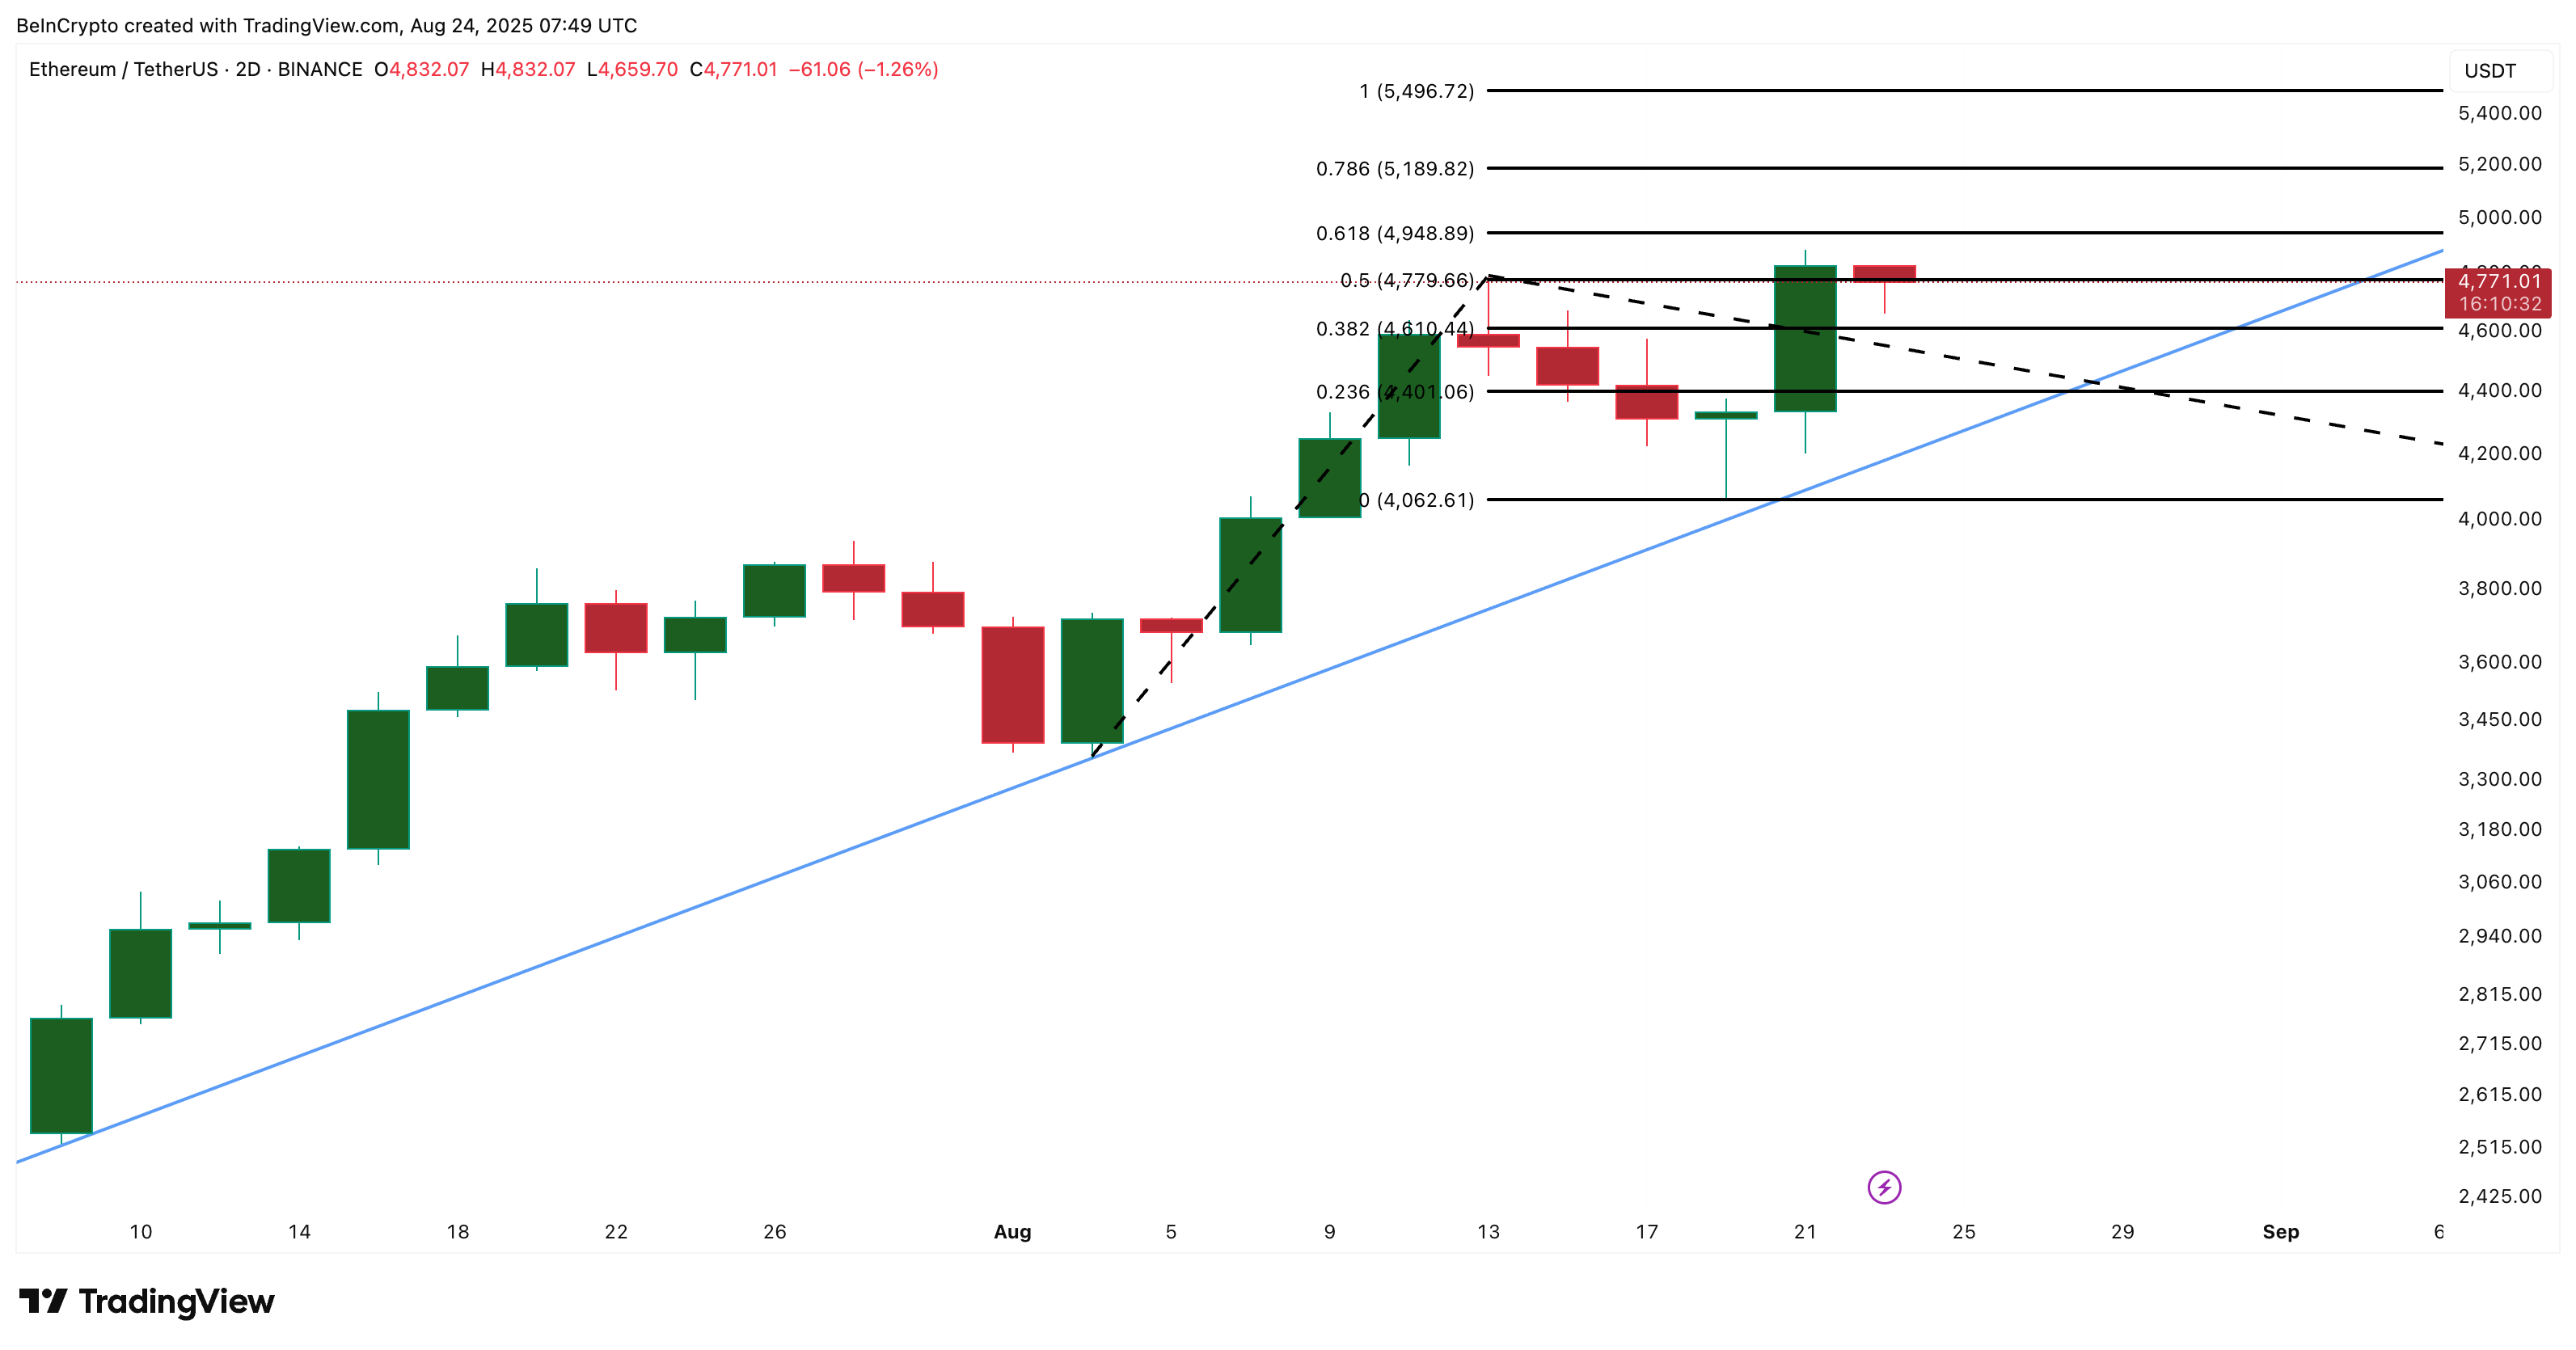
On the downside, failure to hold the $4,610 zone, which aligns with both Fibonacci support and cost basis clusters, could trigger a move toward $4,400. However, that would require ETH whales and other large holders to sell, which doesn’t seem likely yet.
