
The Ethereum price has recently broken down below a significant support area. Whether it reclaims this area or not will have major implications on the future price movement.
The price has been decreasing since November 18, having already lost 20% of its value. This has given fuel to detractors, such as anti-crypto campaigner Nouriel Roubini who did not hold back as he stated that the Ethereum price will eventually decrease to its ”fundamental value” of $0.
Trader & technical analyst @rektcapital suggested that the Ethereum/BTC pair can help in predicting the ETH/USD price. According to him, ETH/USD will soon make a significant downward move.
$ETHBTC vs $ETHBTC – $ETH #ethereum
Is ETHBTC giving an indication as to what may be in store for ETHUSD?
ETHBTC broke down from a crucial support & flipped it into new resistance
ETHUSD brokedown lately too – resistance flip next?
ETHBTC & ALTDOM trends suggest yes#Crypto https://t.co/KsPNsX3Rx0 pic.twitter.com/F9ttRTkbNm
— Rekt Capital (@rektcapital) November 29, 2019
Let’s take a look at both pairs and see if there is any truth to the claim.
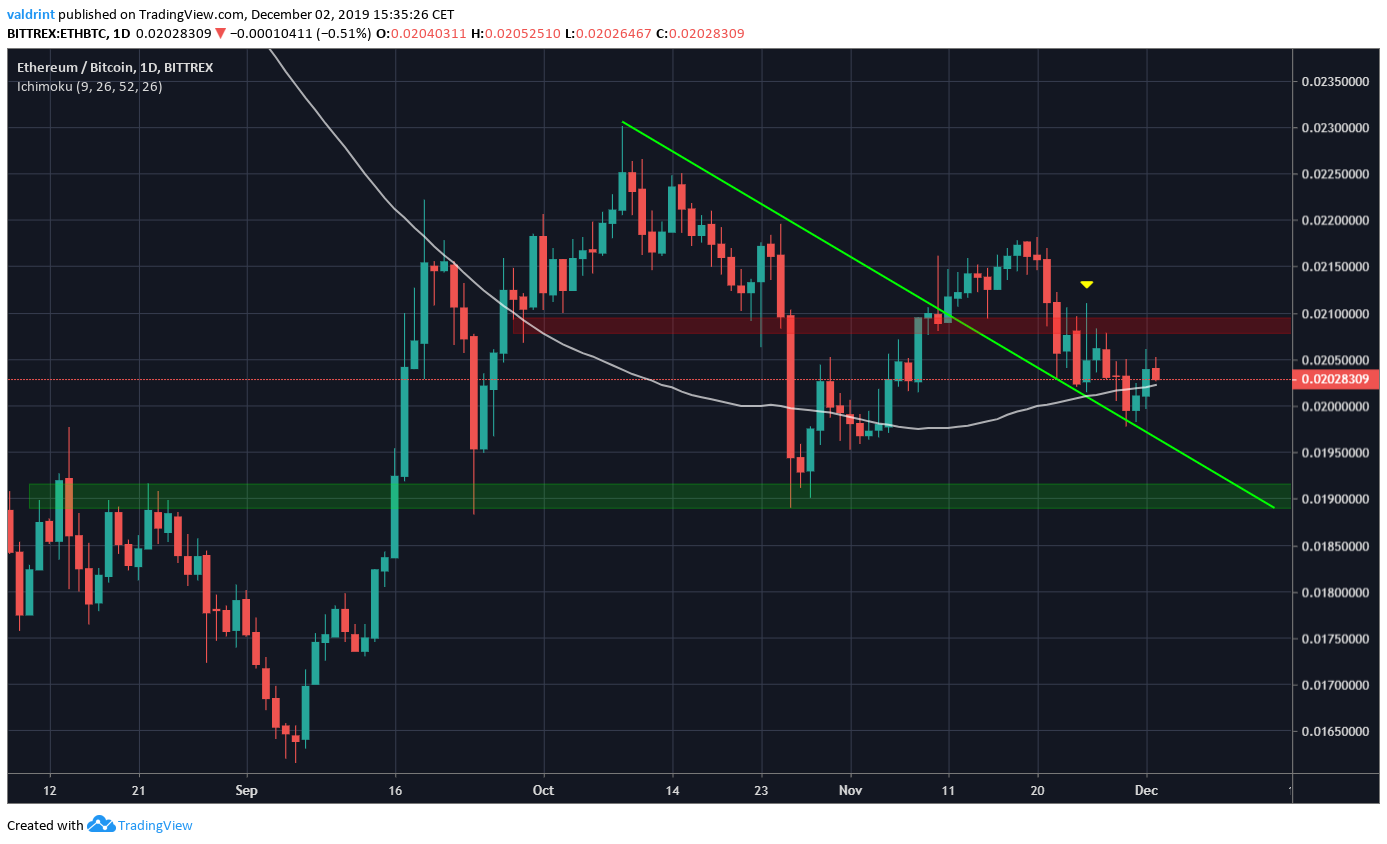
Ethereum/Bitcoin
The ETH/BTC price broke down below the support at ₿0.021 before validating it as resistance. However, the support area was in place for only one month and the price had already broken down below it once.
Additionally, the price is following a descending support line which would take the price to ₿0.019 near the end of December. The price is still trading above the 100-day moving average (MA). While a bounce is possible, it seems that the price will make a lower low near the descending support line.
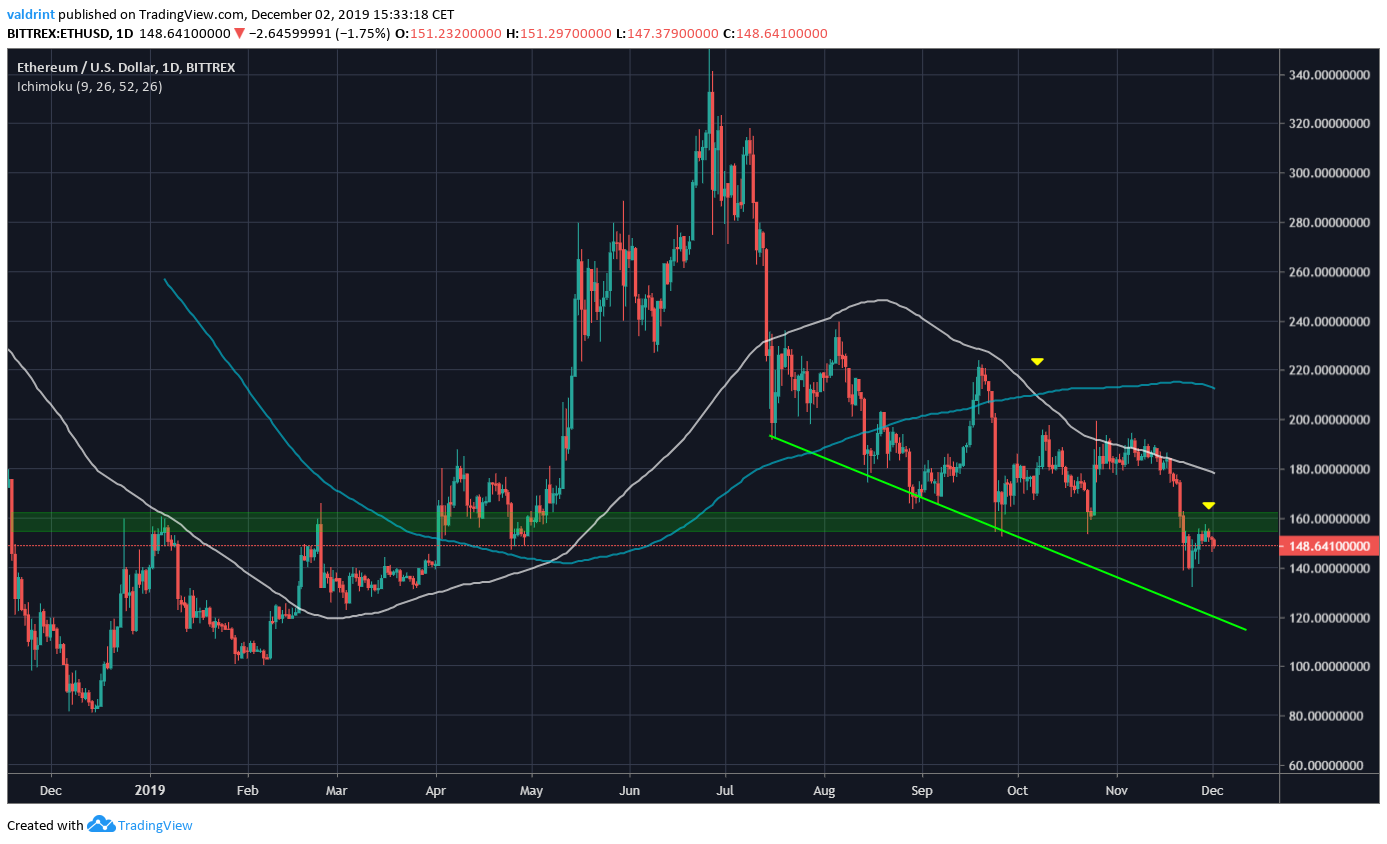
Ethereum/Dollar
The ETH/USD pair provides a more bearish outlook. The price fell below a significant support area in late November and possibly validated it as resistance afterward. Unlike in the BTC pair, the support area stood for more than six months.
The price is also following a descending support line. However, the slope of the line and current price position allows for a continued decrease until the price finds support.
Also, the 100- and 200-day moving averages have made a bearish cross and are offering resistance to the price.
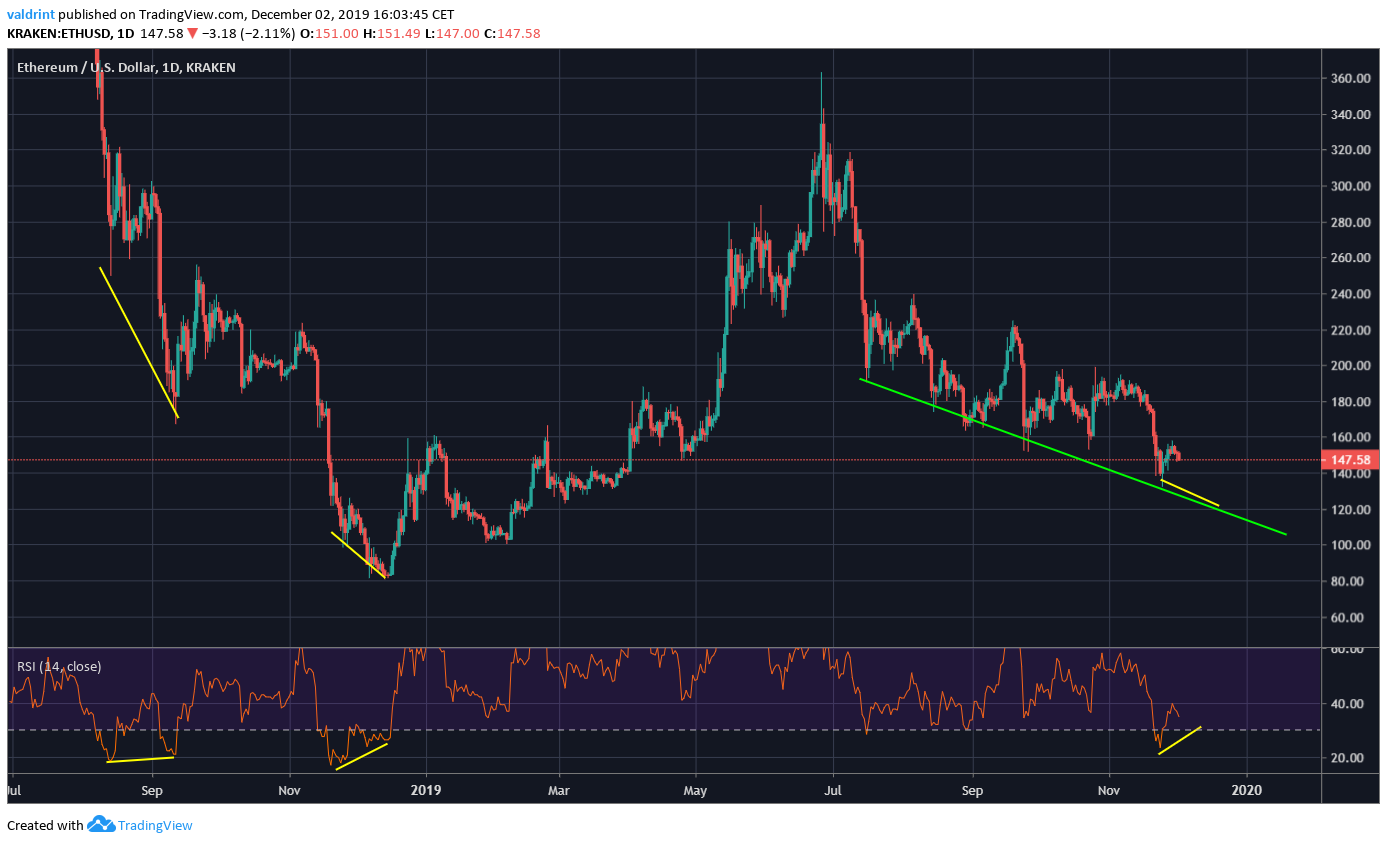
There is an interesting pattern in the daily RSI, which is currently oversold. Twice before it has made a bullish divergence higher low in the oversold area twice before, then has initiated an upward move shortly after.
It is possible that the price does so again if it decreases to the support line while the RSI makes a higher low. If this happens, it could reclaim the previous support area.
Whenever a strong support level is broken and the lower prices cannot be sustained it often has major bullish implications. It remains to be seen if this will be the case with ETH.
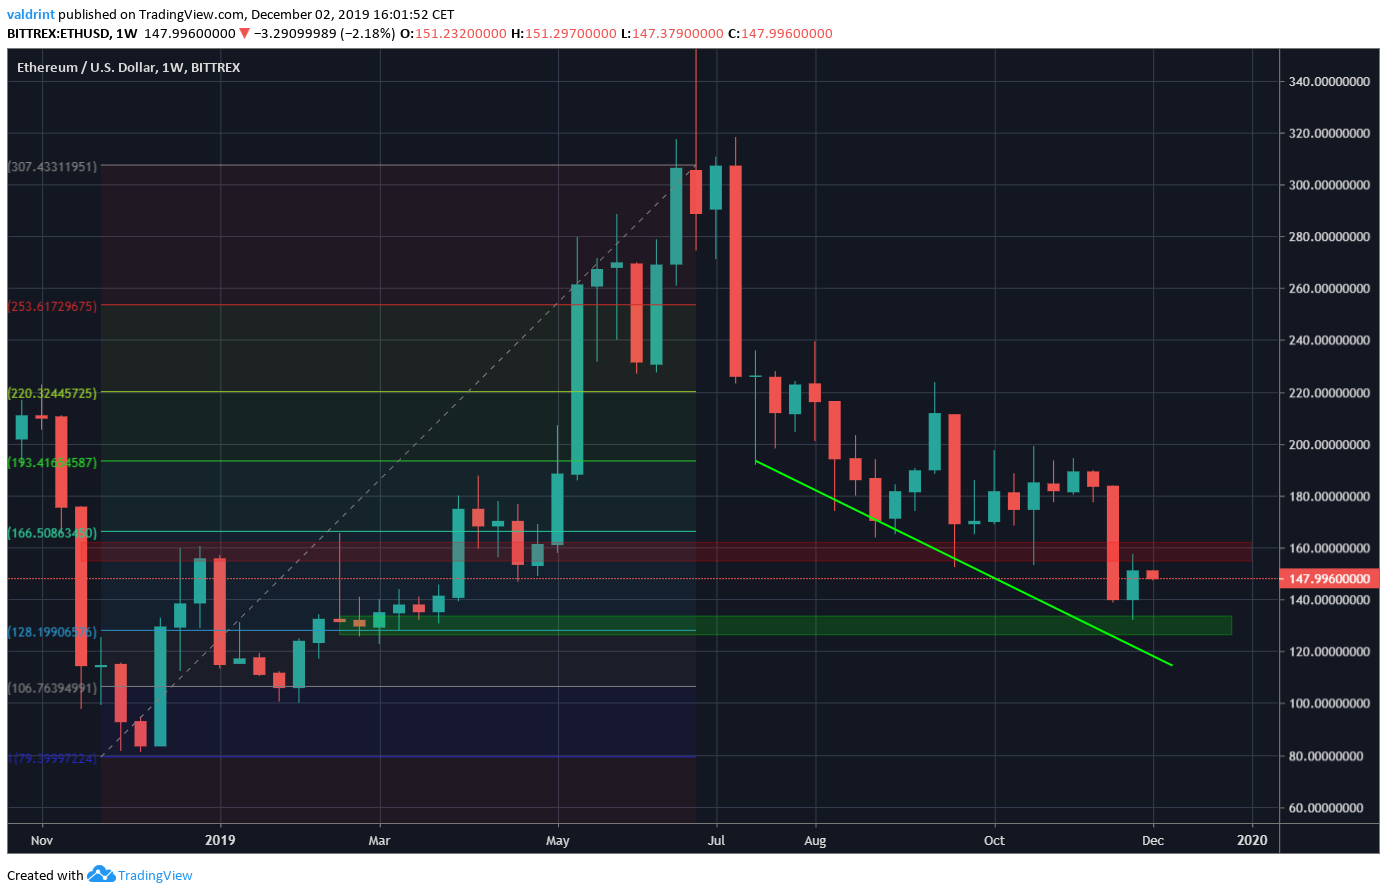
Long-Term
The weekly chart shows that the price has almost reached the 0.786 fib level. If the scenario outlined in the previous section plays out, we could see the price trading between these two ranges for the foreseeable future.
To conclude, the Ethereum price recently broke down below a very significant support area. If it validates it as resistance, it could have major bearish implications. However, it is possible that the price creates a slightly lower low before initiating a rapid upward movement.
Whichever may be the case, ETH should soon revisit the $160 area. Whether it breaks out or not will have major implications on the future price levels.
Disclaimer: This article is not trading advice and should not be construed as such. Always consult a trained financial professional before investing in cryptocurrencies, as the market is particularly volatile.
