
On June 30, 2019, the Ethereum price made a high of $325. A downtrend followed. On July 2, it reached a low of $272. The ETH price has been increasing since.
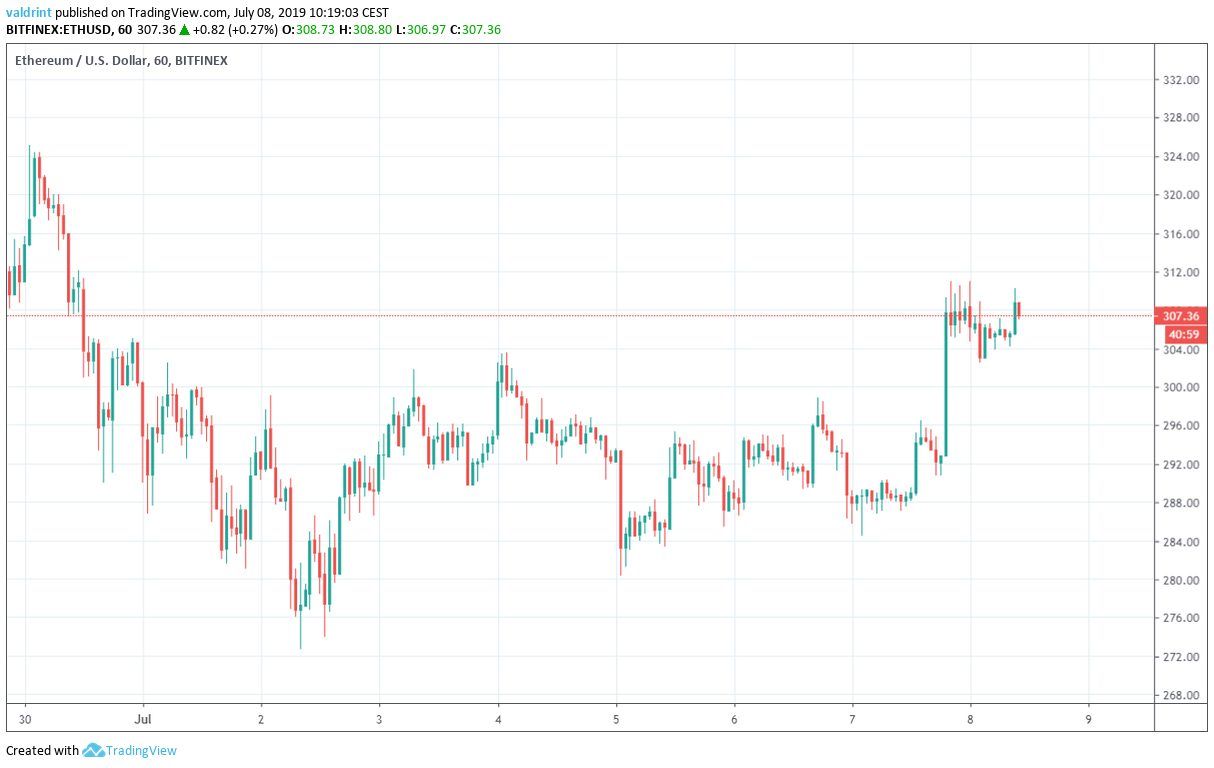
How long will the Ethereum price continue to increase? Below, we are going to analyze ETH in different time-frames alongside technical indicators in order to answer this question.
If you would like to trade Ethereum (ETH) safely and securely on our partner exchange, follow this link to get all set up on XCOEX.
For our previous analysis, click here.
Ethereum Price: Trends and Highlights for July 8
- ETH/USD broke out from a symmetrical triangle.
- It is trading inside an ascending wedge.
- Daily moving averages (MA) are in the process of rejecting a bearish cross.
- There is significant bearish divergence developing in the RSI and the MACD.
Previous ETH Price Movement
Since June 30, The ETH price has been trading inside the symmetrical triangle outlined below.
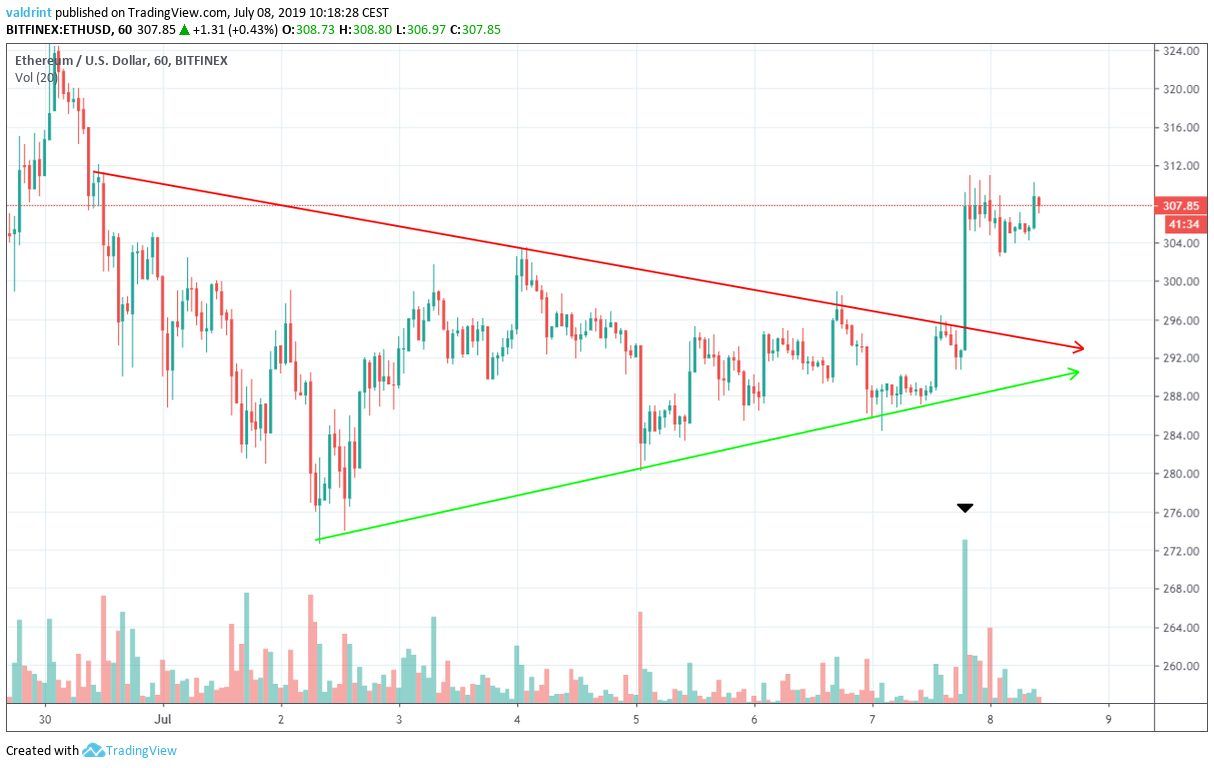
On July 7, the price broke out from this triangle.
The breakout transpired with significant volume, affirming its validity.
However, after the breakout, the ETH price created a double top, which is considered a bearish reversal pattern.
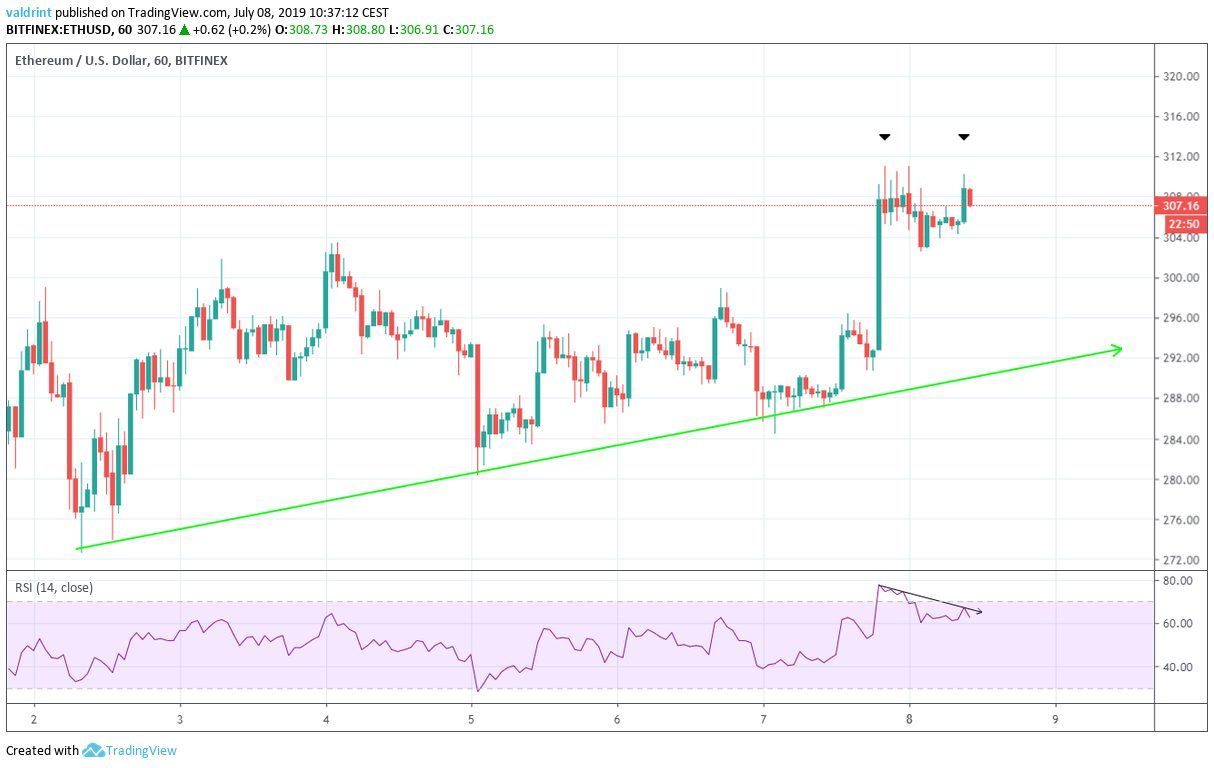
Additionally, the double top was combined with a bearish divergence in the RSI.
Therefore, it is likely that the Ethereum price will decrease towards the ascending support line of the triangle, which is still intact.
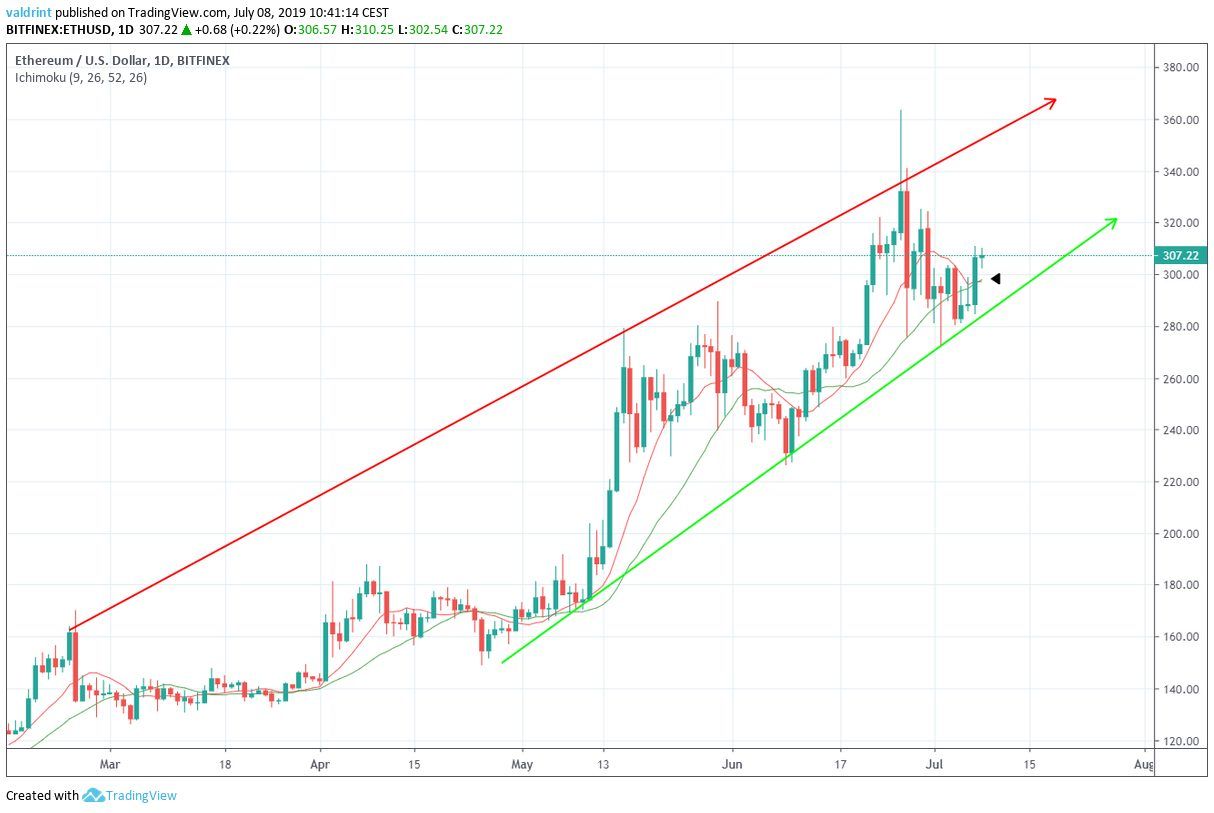
Ascending Wedge
In a daily time-frame, we can see that the ETH price has been trading inside an ascending wedge since February 21.
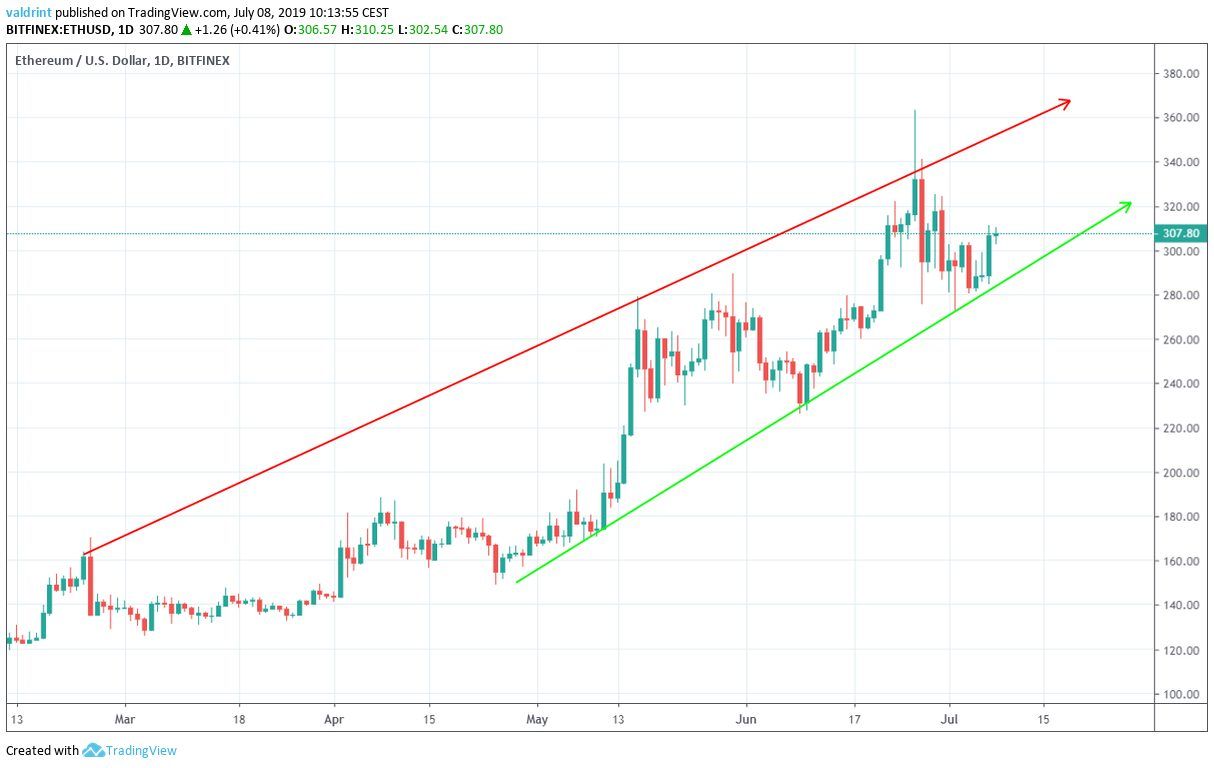
The breakout from the triangle occurred after the price bounced on the support line.
The ascending wedge, however, is a bearish pattern, making price breakdown more likely.
Technical Indicators
At the time of writing, the 10-day MA was close to crossing below the 20-day one. This is known as a bearish cross.
However, the recent Ethereum price increase took it above both MAs. Additionally, it made it likely that the bearish cross will be rejected and the price will continue to increase.
However, we still do not believe a breakout is likely.
The main reason is the significant bearish divergence that has been developing in both the RSI and the MACD since May 13 and 25, respectively.
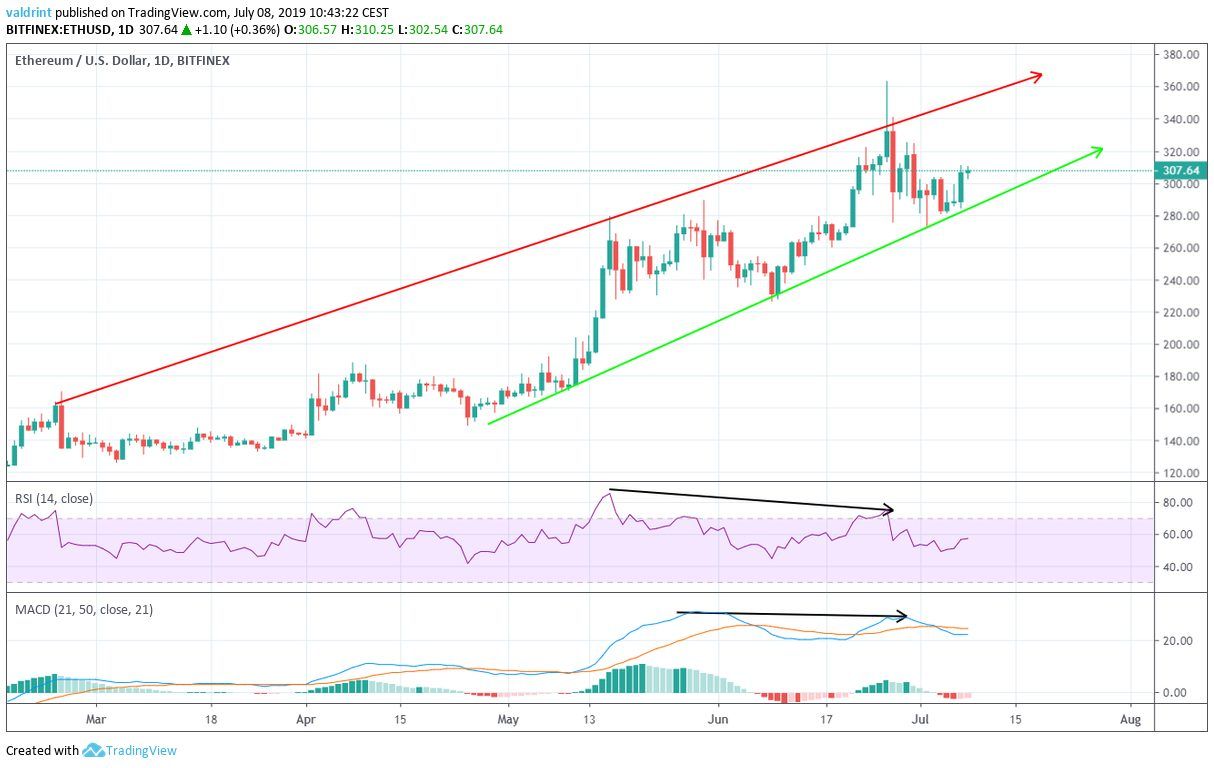
Combined with the fact that the ascending wedge is a bearish pattern, a breakout remains unlikely.
However, Ethereum price increases towards the resistance line of the wedge are expected, especially if the aforementioned bearish cross is rejected.
Summary
The Ethereum price recently broke out from a symmetrical triangle.
It is trading inside a long-term ascending wedge.
Technical indicators support a price increase within the confines of the wedge. A breakout remains unlikely.
Do you think the Ethereum price will continue to increase? Let us know in the comments below:
Disclaimer: This article is not trading advice and should not be construed as such. Always consult a trained financial professional before investing in cryptocurrencies, as the market is particularly volatile.
Images are courtesy of Shutterstock, TradingVie
