
The Ethereum price fell sharply in the past 24 hours, dropping from near $4,300 to as close to $3,400 before partially rebounding to around $3,800. The move came alongside almost $19 billion in crypto liquidations, one of the largest single-day sell-offs this year, led by the China-US tariff dispute. The sudden flush wiped out long positions across major exchanges and sent traders rushing to hedge in futures markets.
While Ethereum remains down about 13% at press time, early signs from derivatives and technical charts suggest the sell-off may have gone too far — and that a rebound could be forming under the surface.
Bearish Positioning Builds, But Derivatives Hint at a Rebound Setup
Crashes of this size rarely begin in the spot market. They start with derivatives, where heavy leverage magnifies both gains and losses.
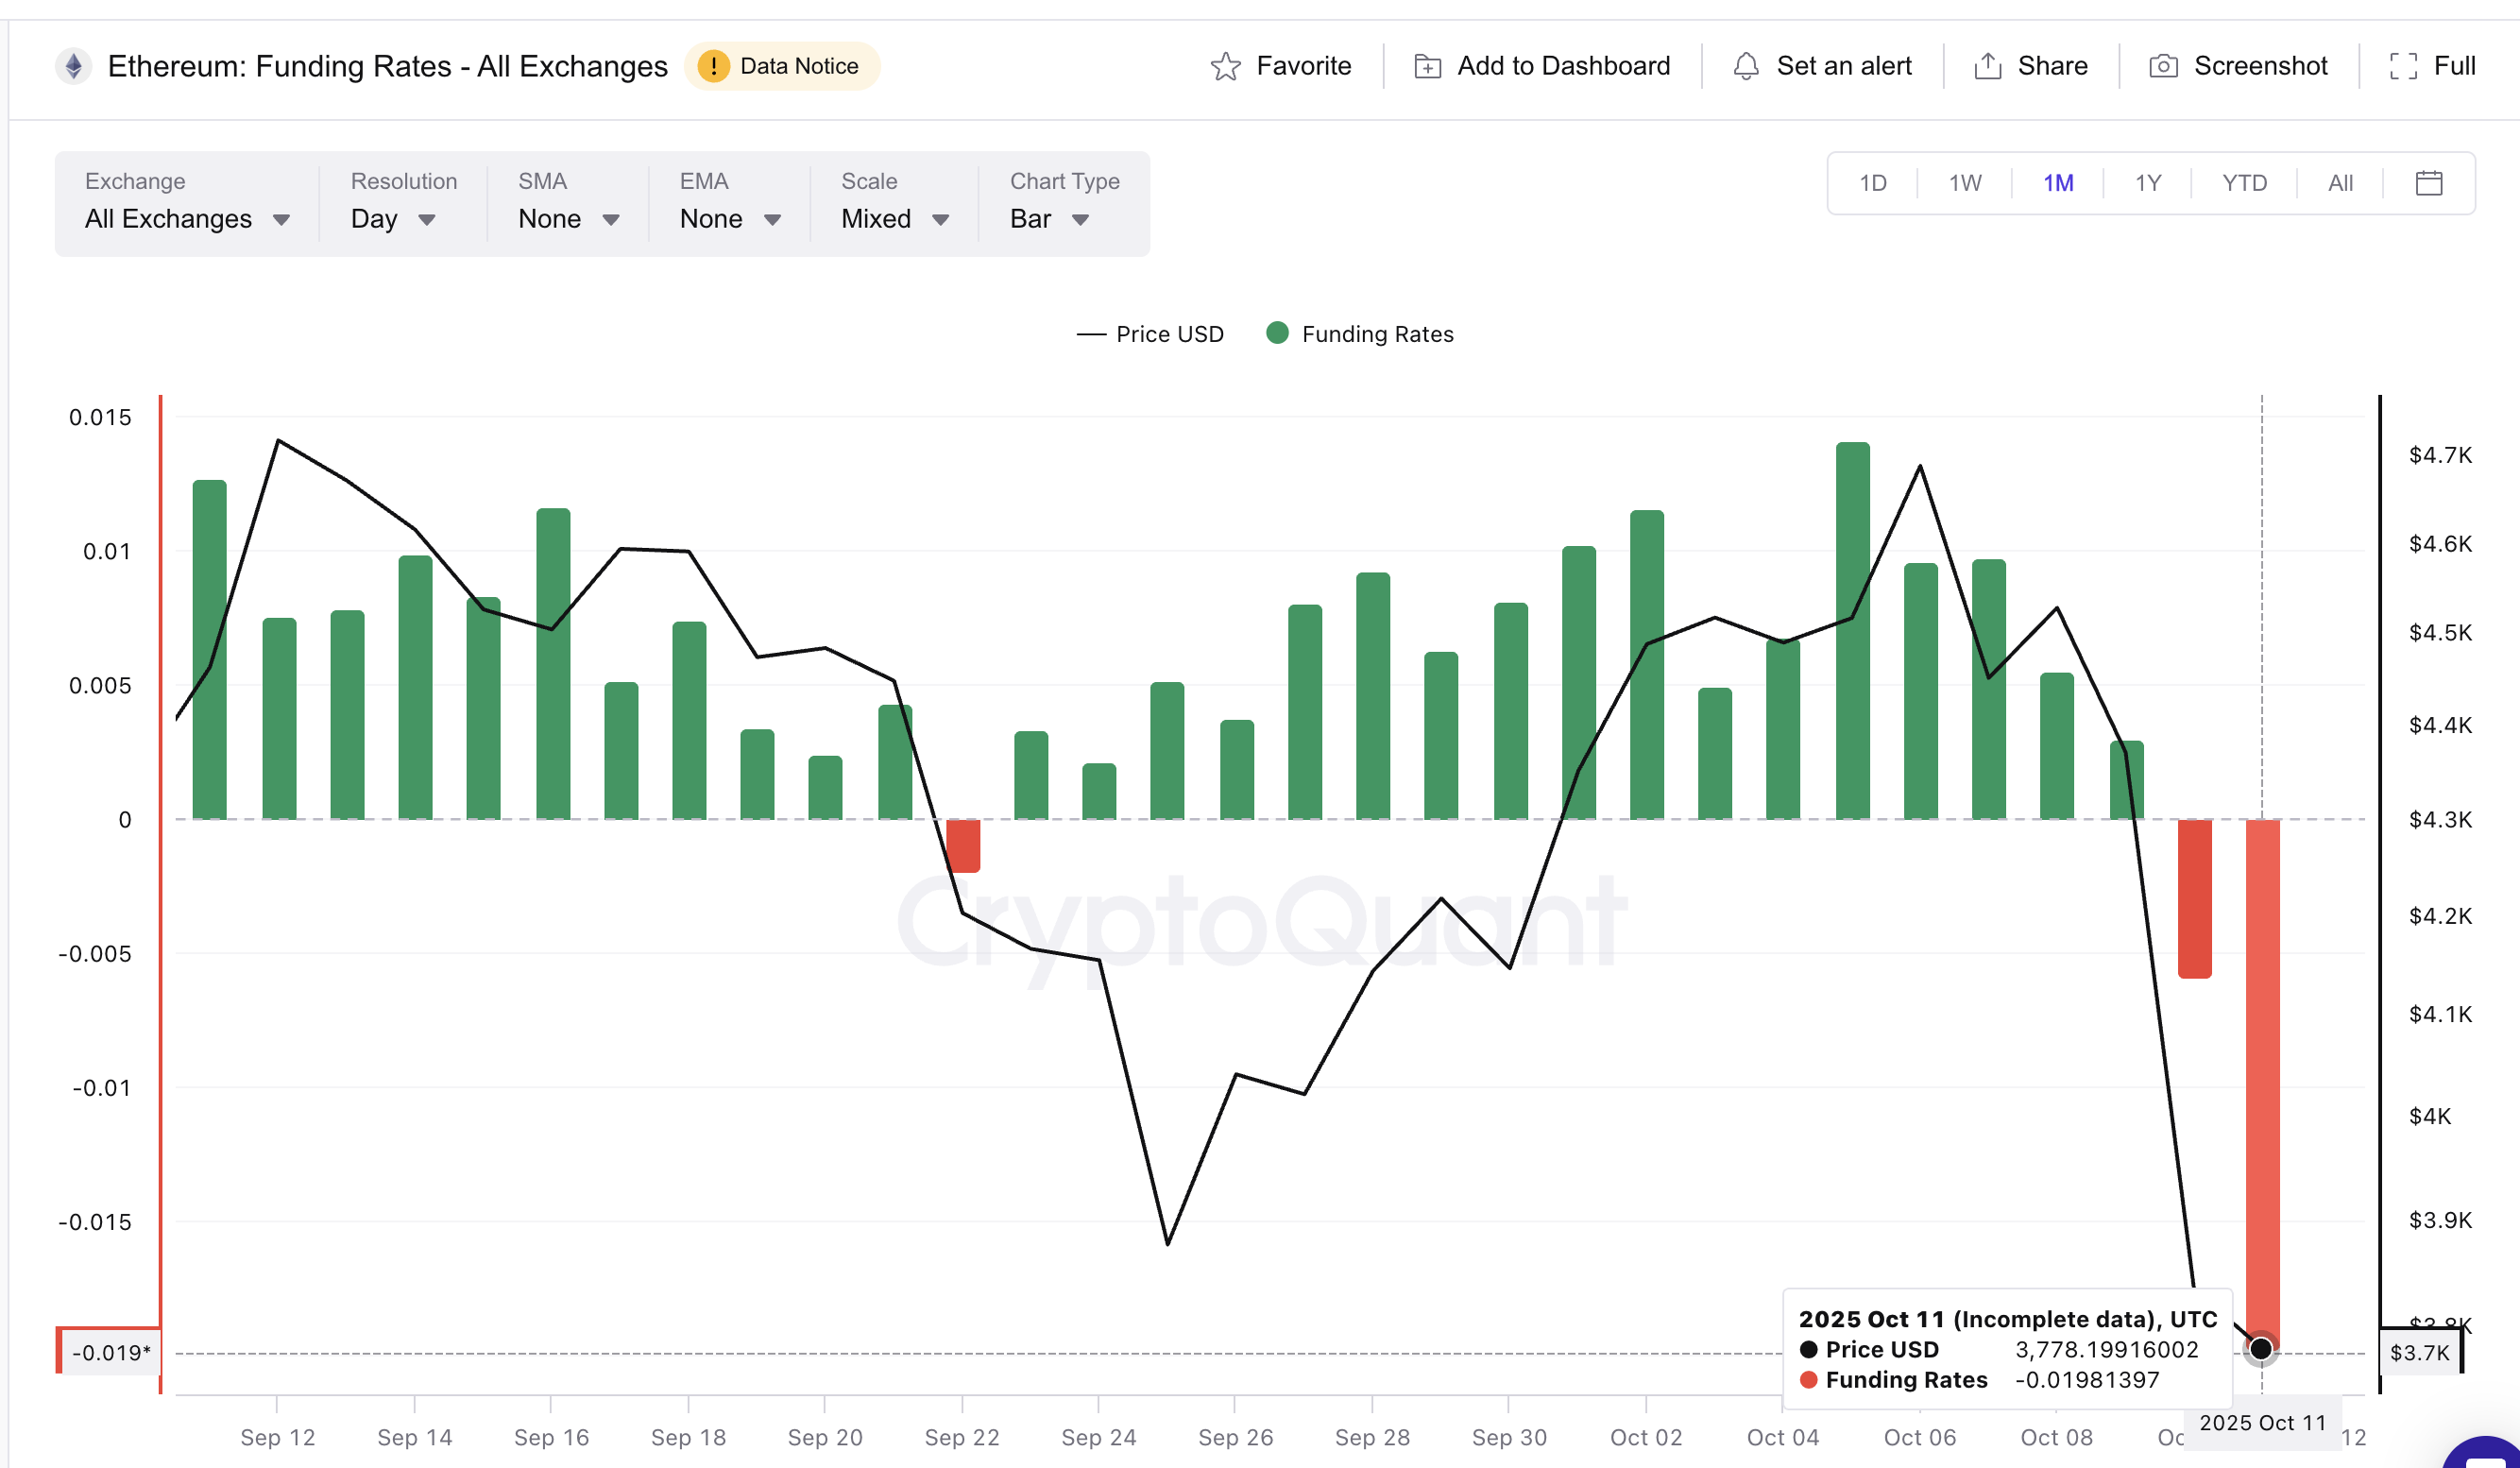
Ethereum’s funding rate — the fee traders pay or receive to hold perpetual futures — flipped from +0.0029% on October 9 to –0.019% by October 11.
A negative funding rate means short traders are paying long traders, showing that most of the open interest now bets on further downside.
Want more token insights like this? Sign up for Editor Harsh Notariya’s Daily Crypto Newsletter here.
That imbalance, while bearish on the surface, can also create a rebound setup. When shorts become overcrowded, even a small price bounce can trigger a short squeeze, forcing traders to buy back their positions and pushing prices higher.
A second derivative metric supports this view. The taker buy ratio, which measures whether aggressive trades favor buying or selling, has recovered from 0.47 to 0.50 over the last 24 hours.
This shift means buyers are now matching sellers in volume — an early sign that selling exhaustion may be near.
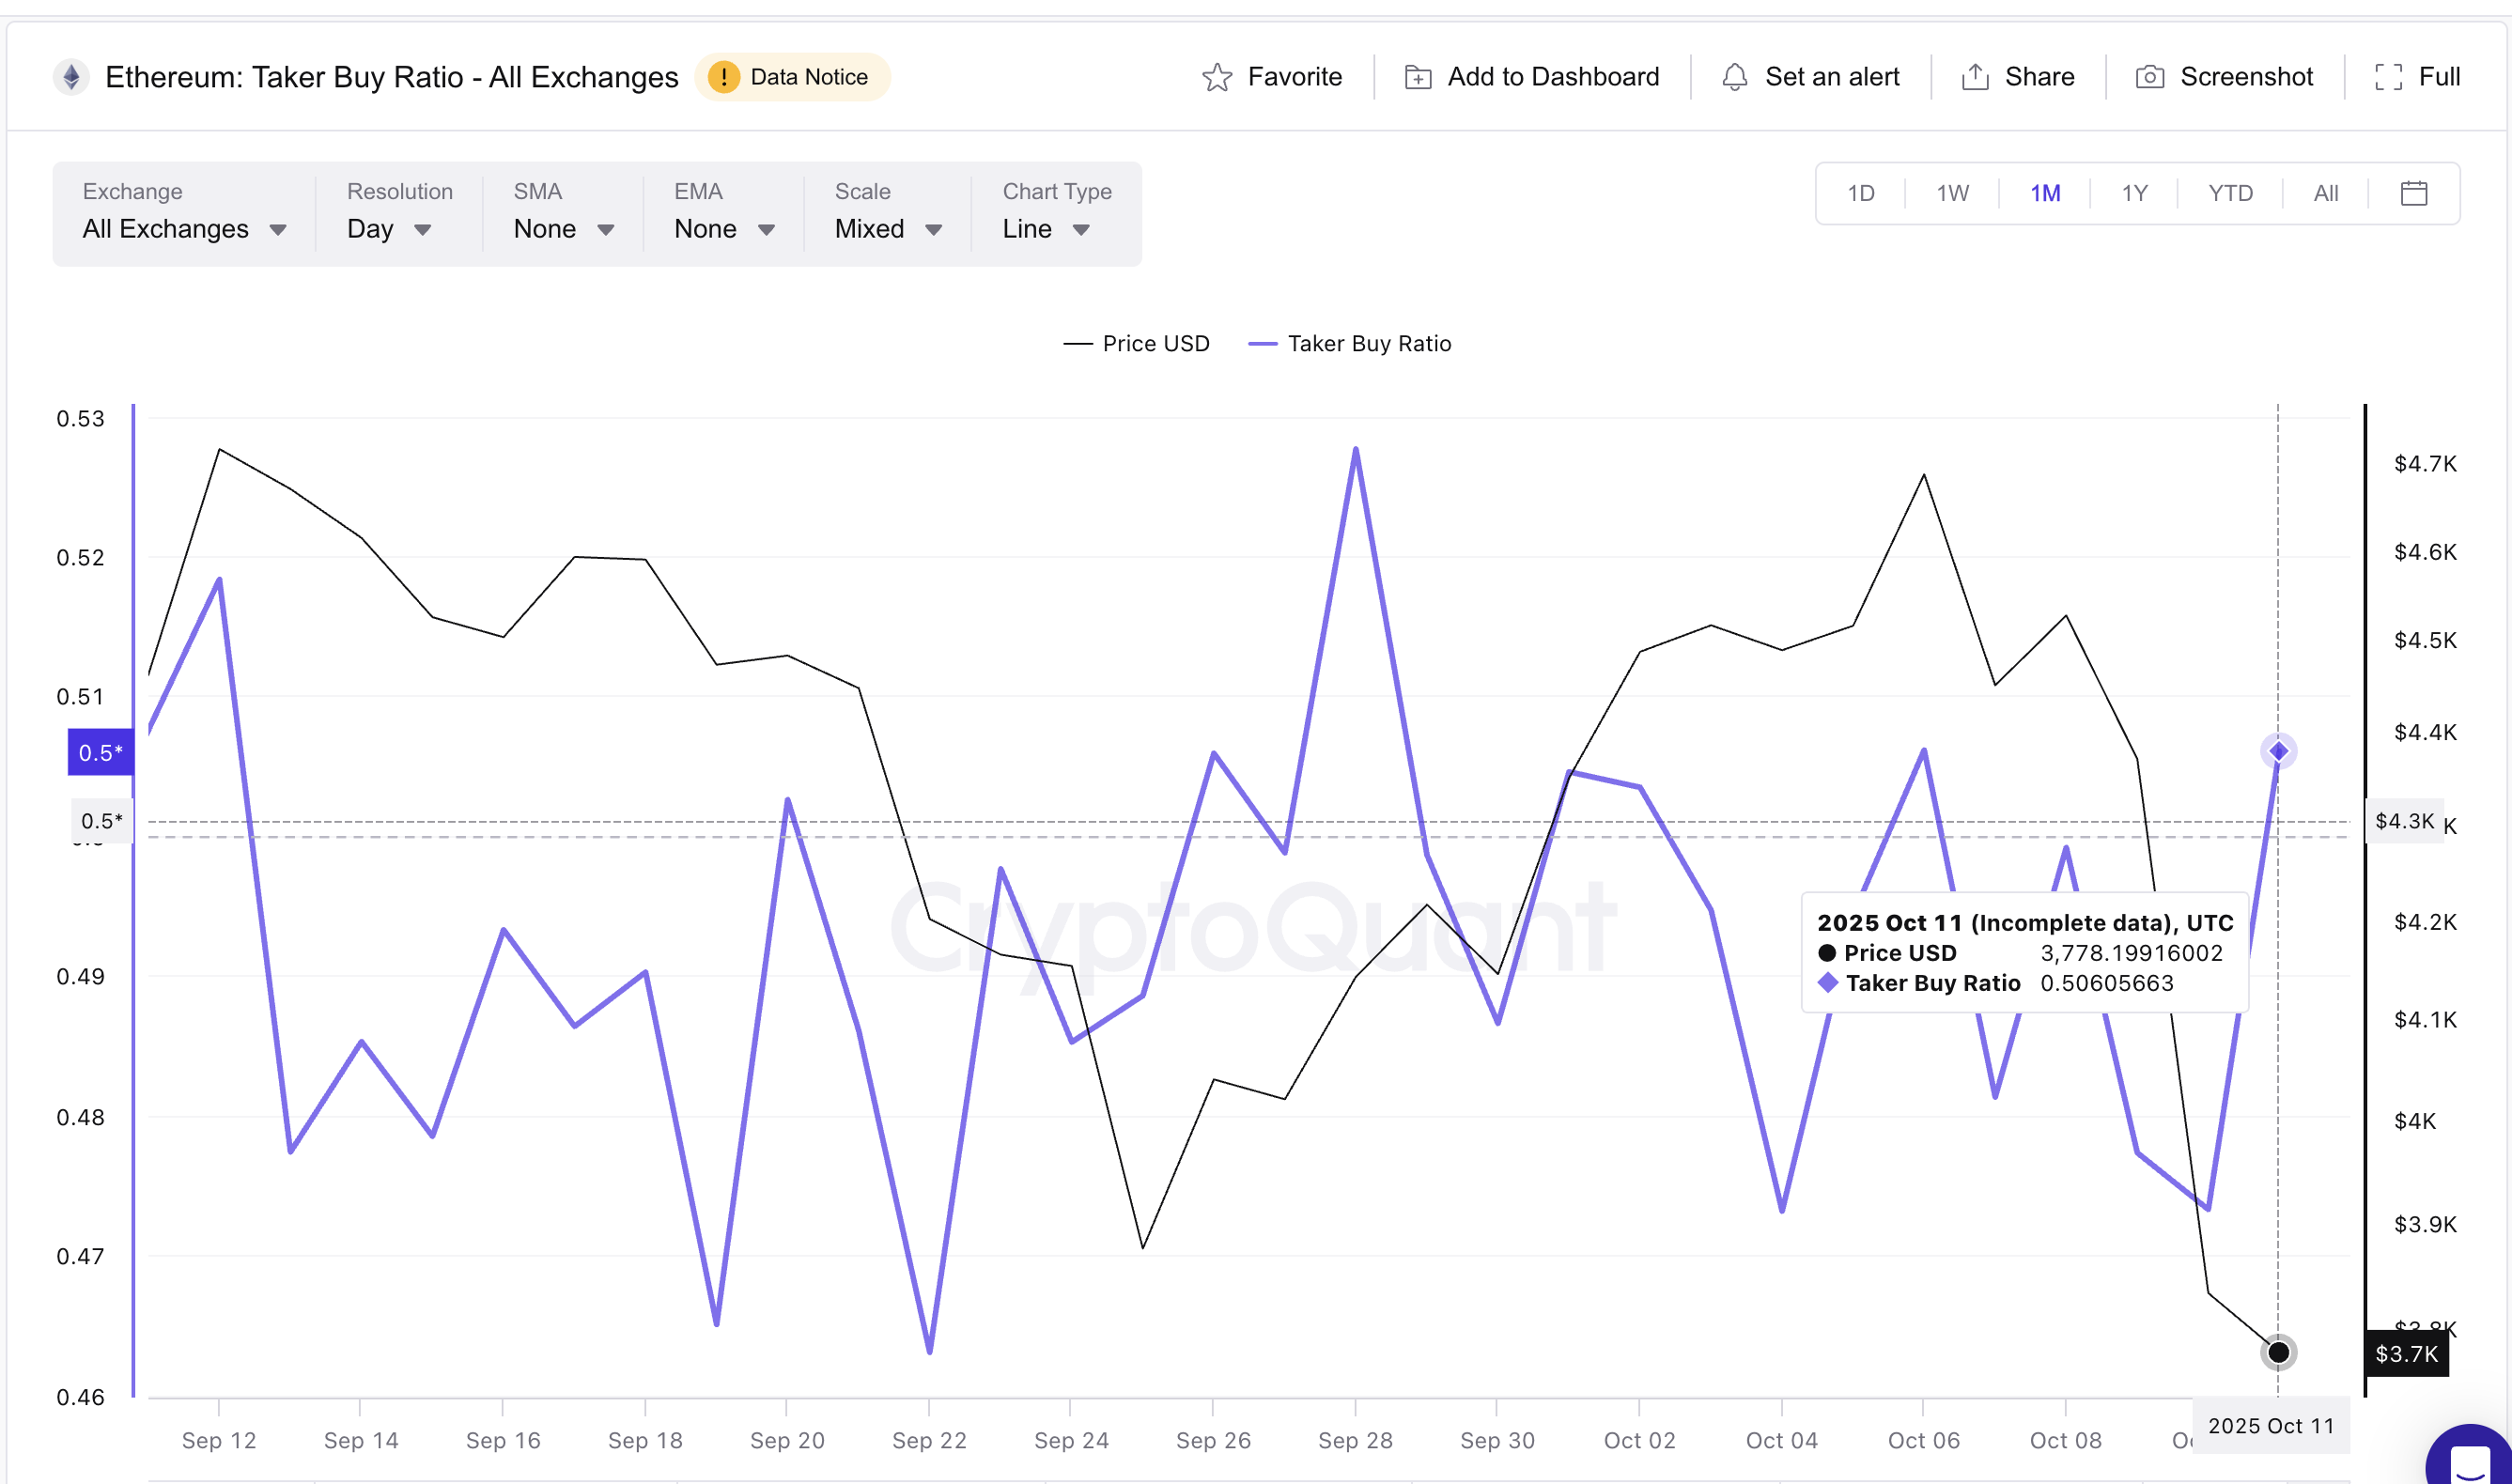
The last time this ratio hit similar levels (a local peak), on September 28, Ethereum rallied 13%, moving from $4,140 to $4,680.
Together, these readings suggest the market’s bearish positioning might actually be setting up the conditions for a rebound rather than a deeper crash. The technical charts should reveal more.
Hidden Divergence Strengthens the Ethereum Price Recovery Case
The Ethereum price chart adds weight to this idea. On the daily timeframe, Ethereum shows a hidden bullish divergence — a pattern that forms when price makes a higher low but the Relative Strength Index (RSI) makes a lower low.
RSI measures momentum between 0 and 100. When it diverges from price in this way, it signals that sellers are losing power even if prices haven’t fully recovered yet.
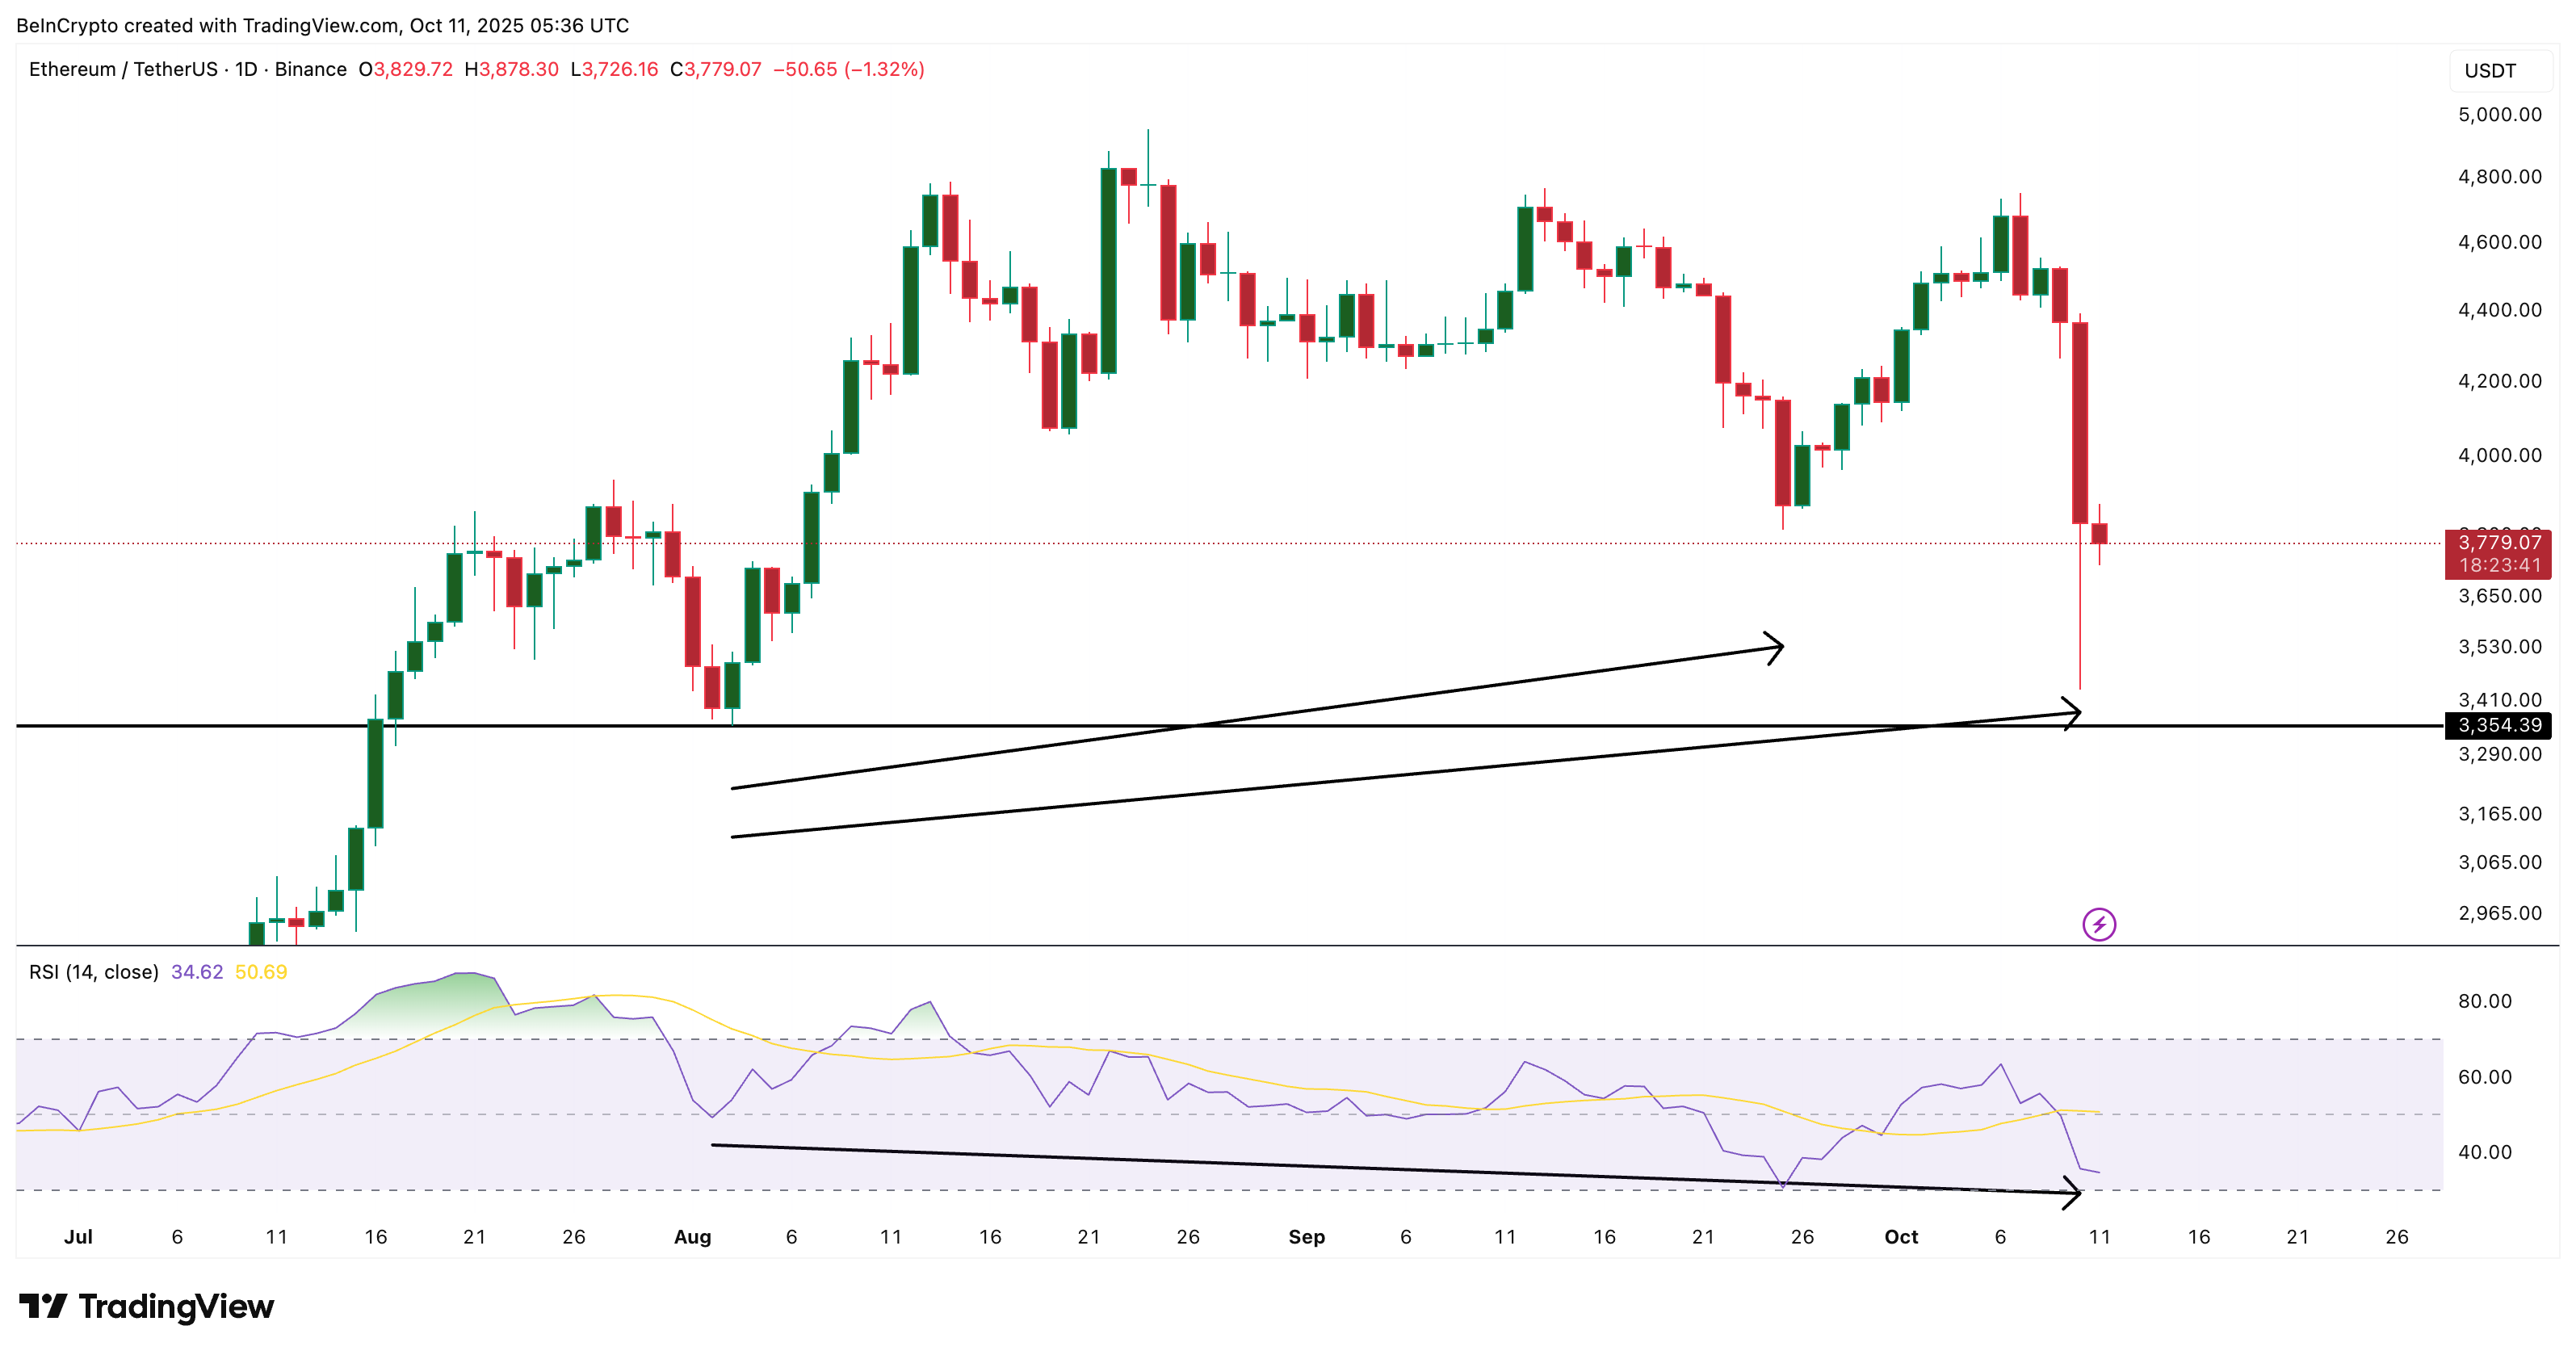
Between August 2 and October 10, this same setup appeared. The last time Ethereum printed this signal, from August 2 to September 25, it climbed almost 25% within days.
If Ethereum holds above $3,430 (key support), the current rebound setup remains valid. Breaking through $3,810 (another key support) and $4,040 would confirm short-term recovery, with a possible target near $4,280 — about 13% higher than current levels.
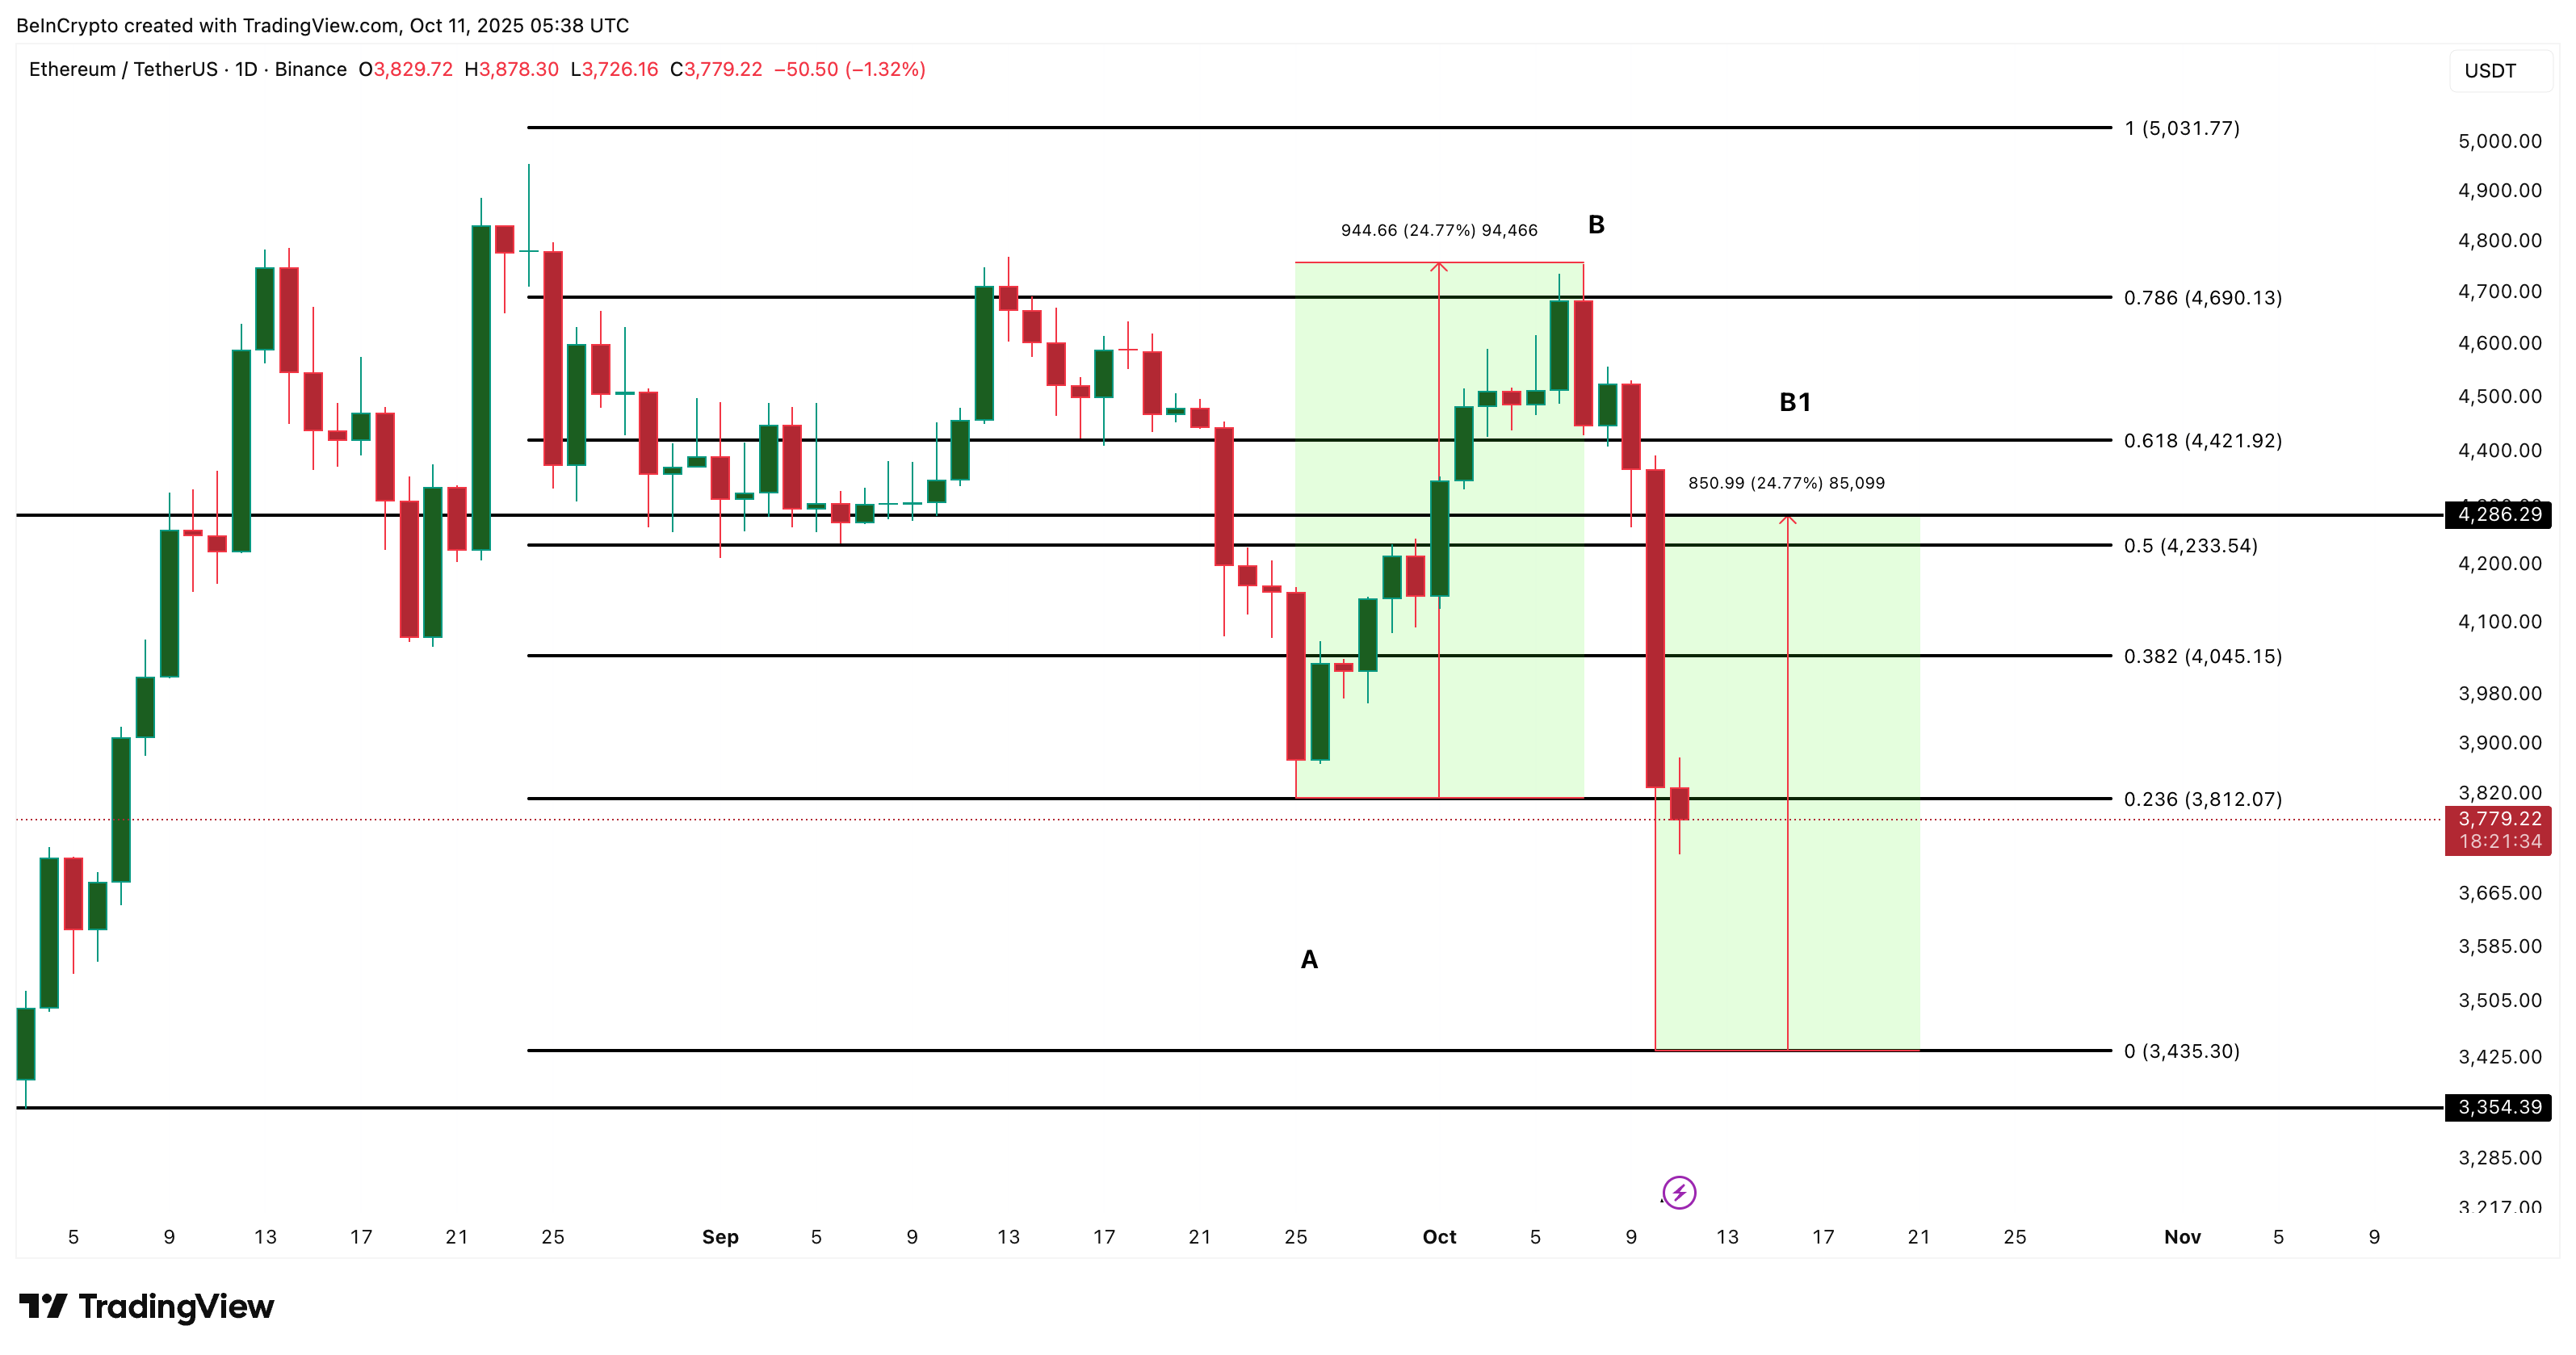
A drop below $3,350, however, would invalidate the structure and return momentum to the bears. For now, the Ethereum price crash may have created its own rebound zone.
With shorts overcrowded and technical strength quietly returning, a recovery toward $4,280 looks increasingly possible if buyers defend key support. All we need is a daily candle close above $3,810 for the strength to return.
