
Ethereum trades above $4,540 at press time on September 12, up nearly 3% in the past 24 hours. Weekly gains stand near 4.7%, while month-on-month changes remain muted at –1.9%. Still, the breakout that took place on September 10 has put the Ethereum price back in the spotlight.
The falling wedge breakout now in motion suggests room for further gains, with on-chain and derivatives data showing that two powerful groups are backing the move. Together, their actions point to a potential run toward $5,110 if conditions hold.
Spot Holders Step Back While Derivatives Traders Surge In
Ethereum’s rally has been marked by a sharp drop in the Spent Coins Age Band (SCAB). On September 4, coins moving across all age groups reached 417,000 ETH. By September 12, that figure had plunged to just 148,000 ETH (a 64.5% drop), even with a temporary spike to 365,000 ETH on September 11.
This drop or spot cooldown stands out because recent local ETH price highs, such as August 14 and August 27, saw spent coins jump above 500,000 ETH.
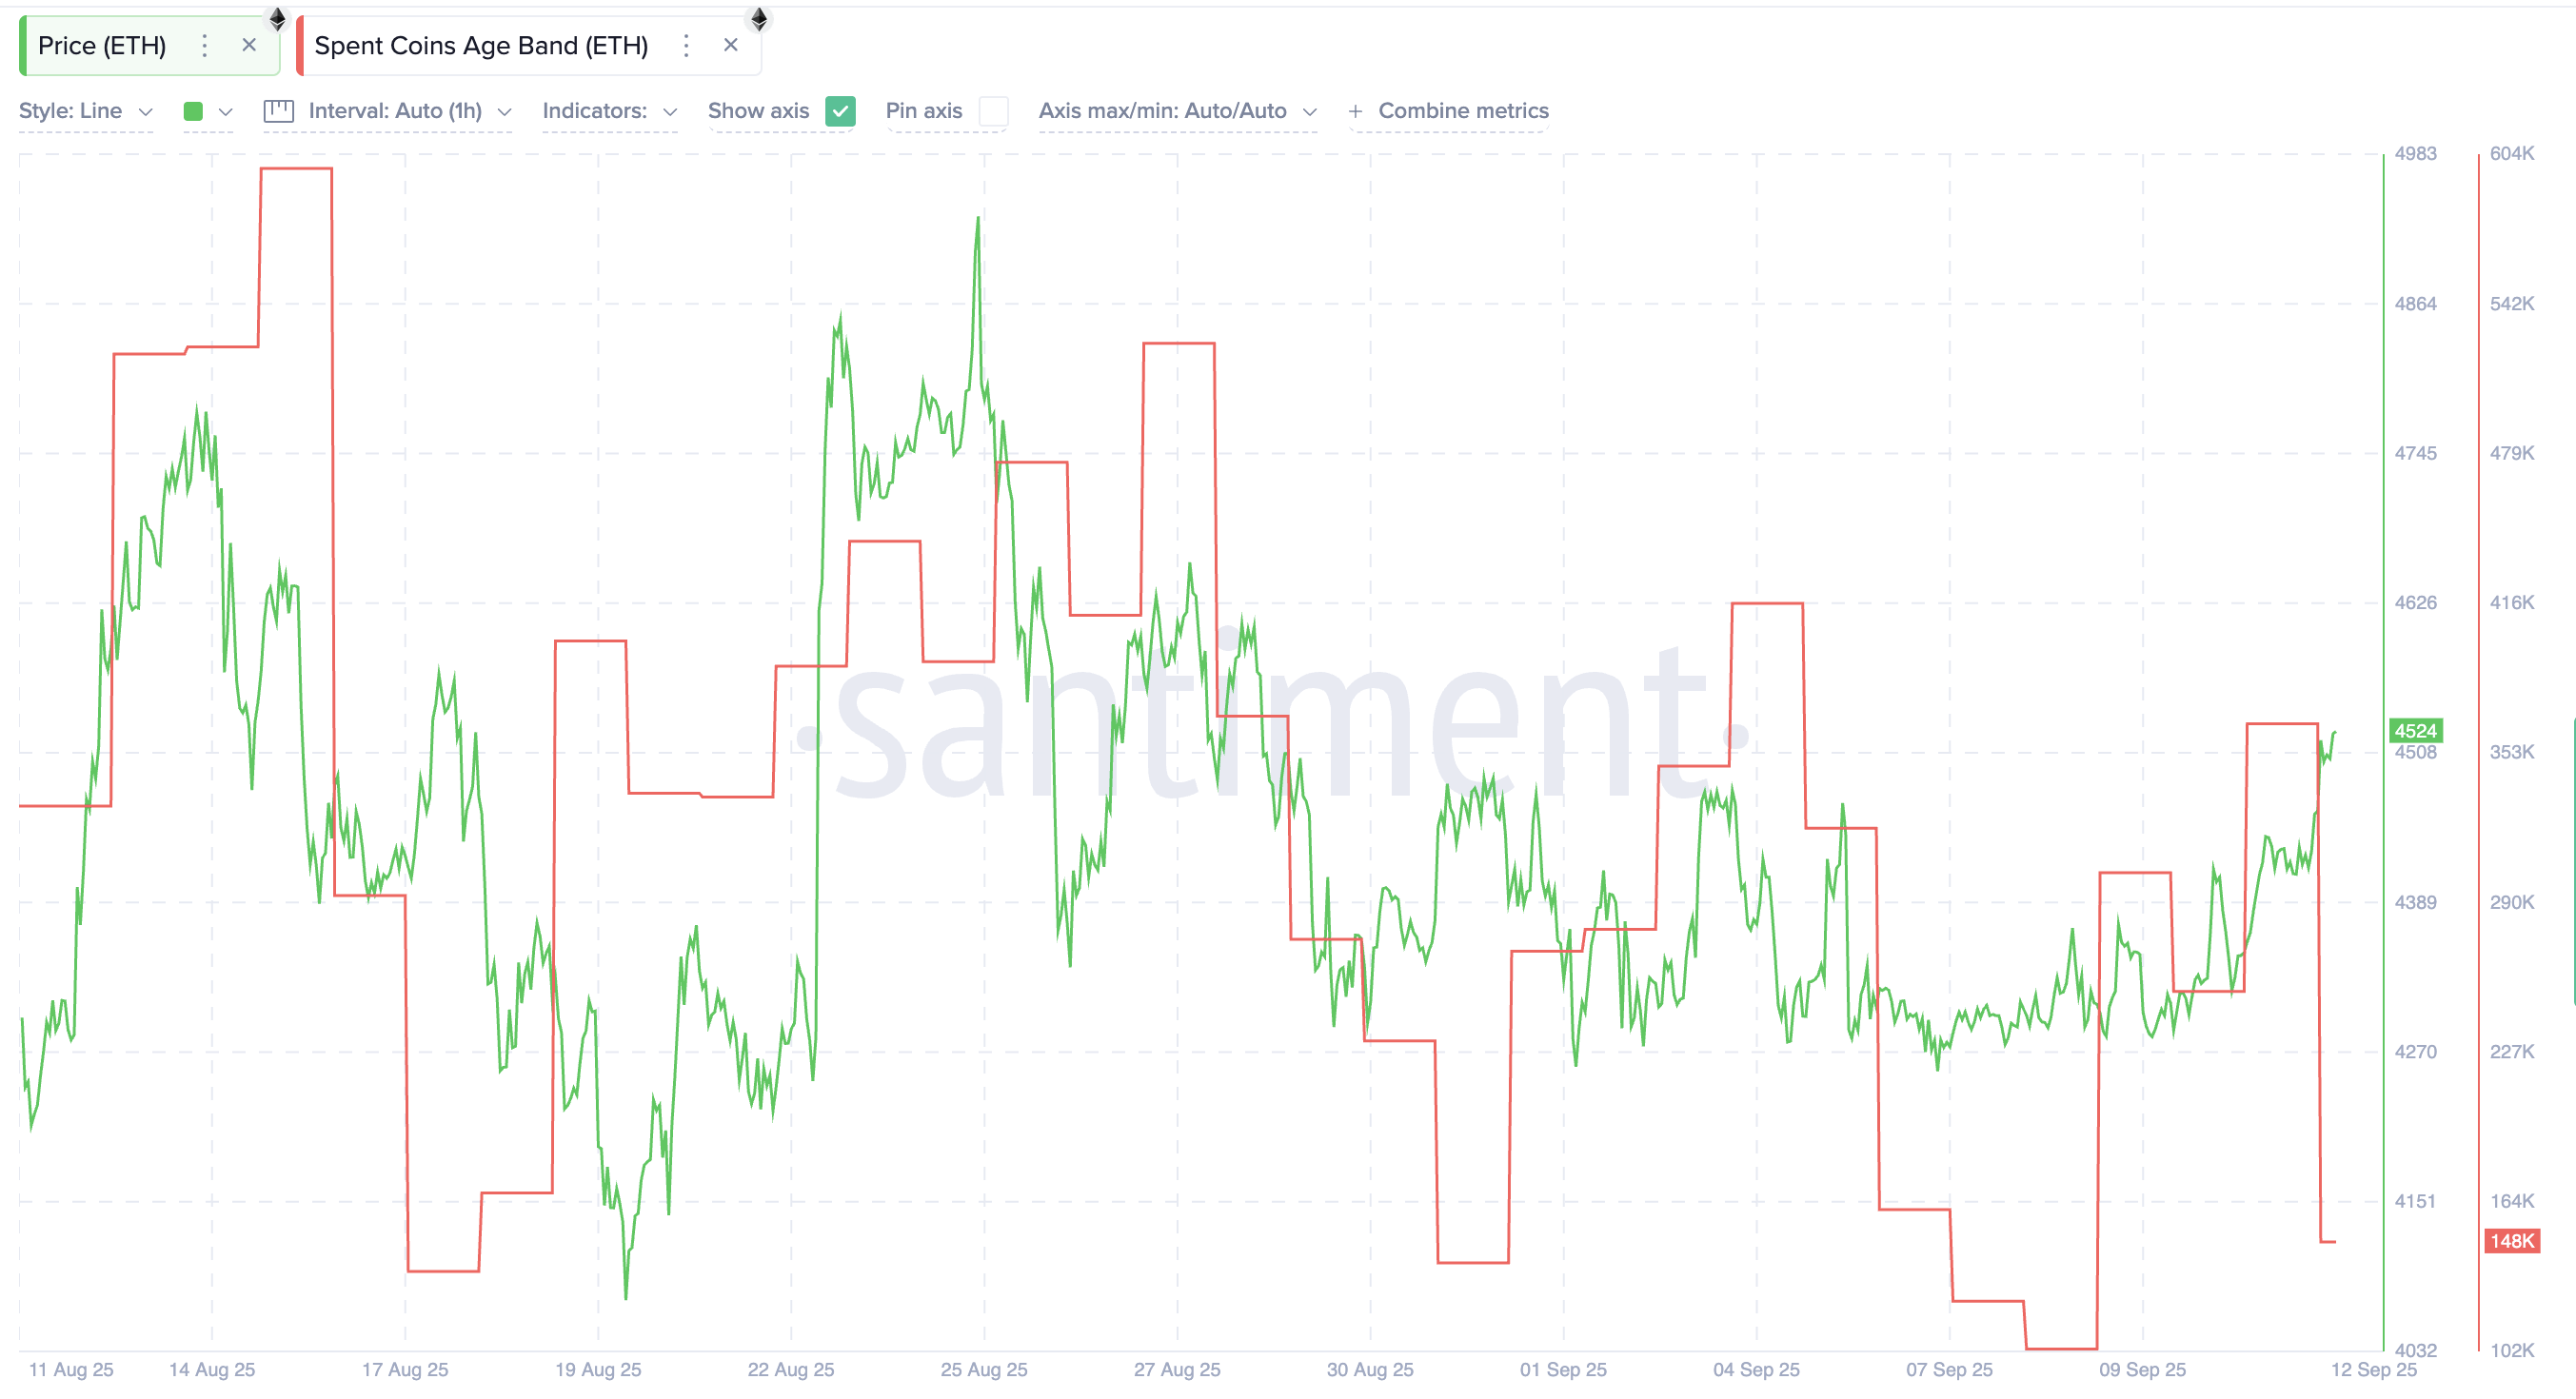
In other words, rallies earlier in the summer saw heavy selling from older coins. Now, the opposite is happening. The decline in spent coins shows that holders — even those with long-held ETH — are not selling into the rally. This adds conviction to the breakout, since fewer coins are hitting the market.
The Spent Coins Age Band (SCAB) metric tracks the distribution of coins being moved by age. It reveals whether old supply is pressuring the market or staying quiet.
Want more token insights like this? Sign up for Editor Harsh Notariya’s Daily Crypto Newsletter here.
At the same time, derivatives activity has surged. The Taker Buy/Sell Ratio has climbed above 1.0, signaling that buyers are dominating order books by absorbing sell orders. The ratio began rising on September 10, just as Ethereum broke out of its falling wedge (which we will discuss later in the piece), and peaked at 1.17, the highest level in over a year.
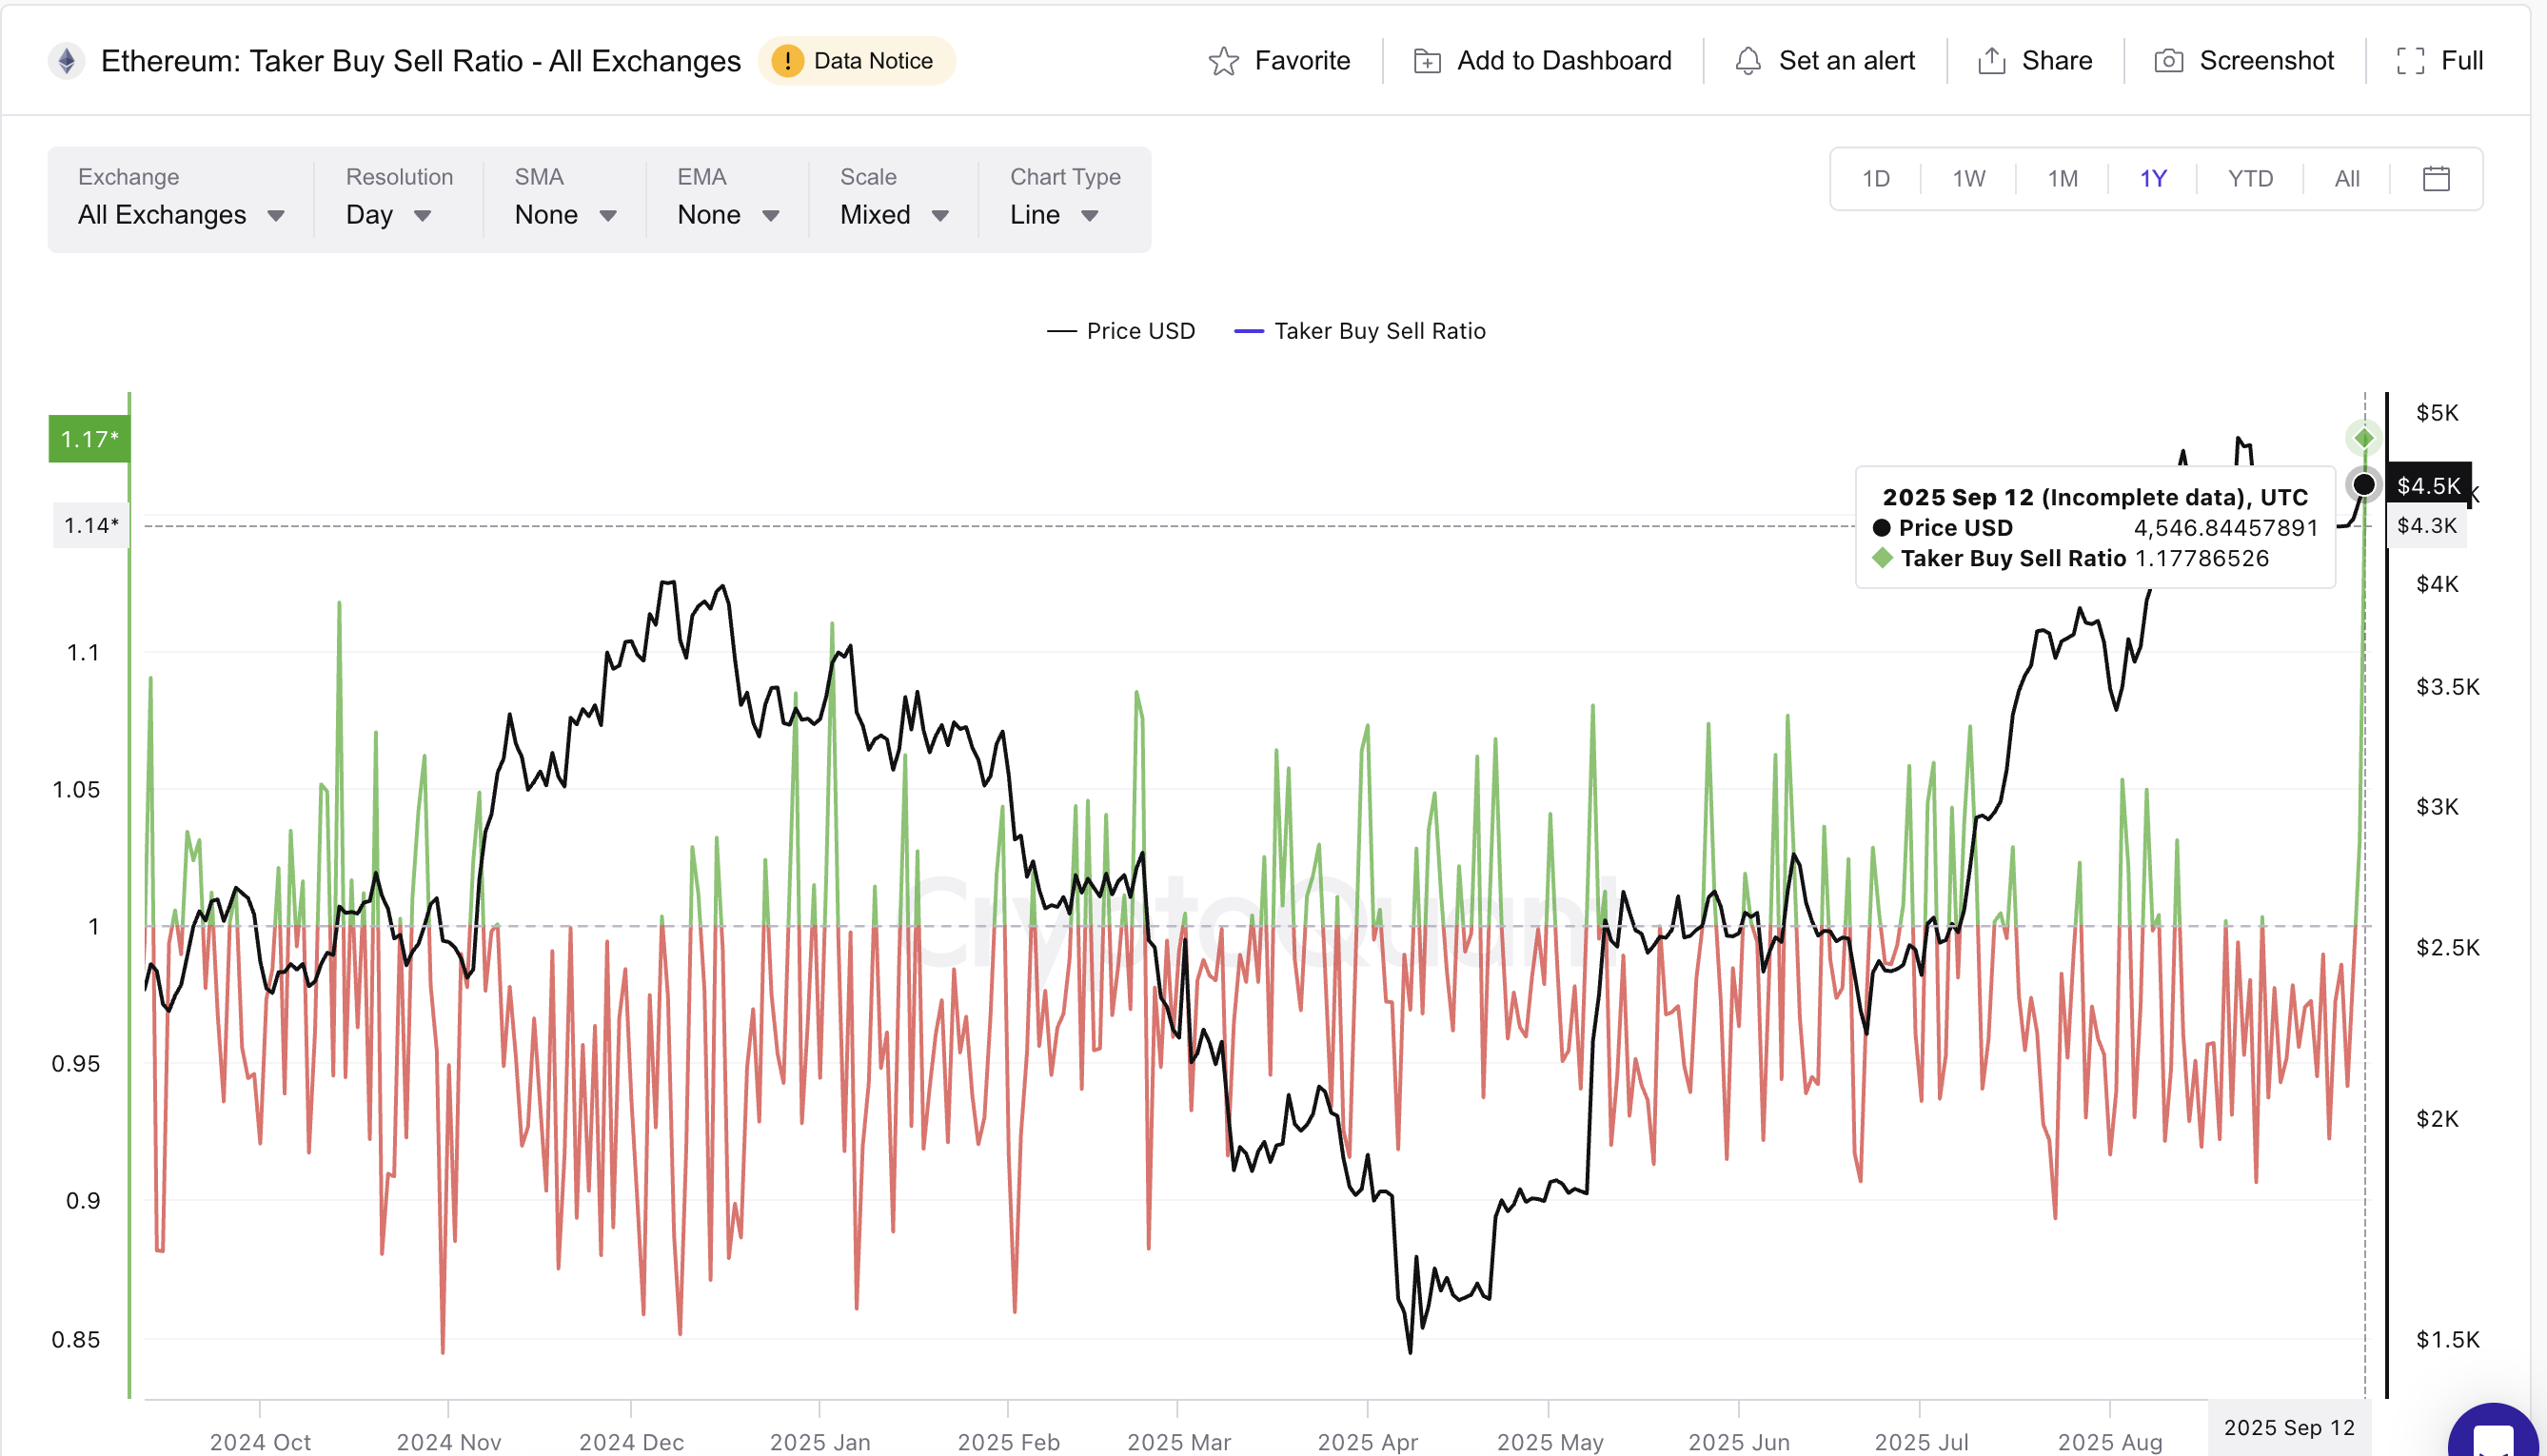
Such peaks typically show aggressive buying pressure. For context, one of the last major spikes occurred on August 3, when the ratio jumped and Ethereum rallied from $3,490 to $4,750, a near 36% surge. While these surges often cool down later in the day, the current reading underlines strong speculative demand from derivatives traders.
The combination is powerful: spot holders are showing conviction by not selling, and derivatives traders are piling in with bullish bets. These two cohorts together give Ethereum’s breakout a supportive foundation.
Falling Wedge Breakout Points Toward $5,100 for the Ethereum Price
Ethereum’s technical structure also supports this bullish setup. On September 10, ETH confirmed a breakout from a falling wedge — a pattern where prices form lower highs and lower lows inside narrowing lines, eventually breaking upward.
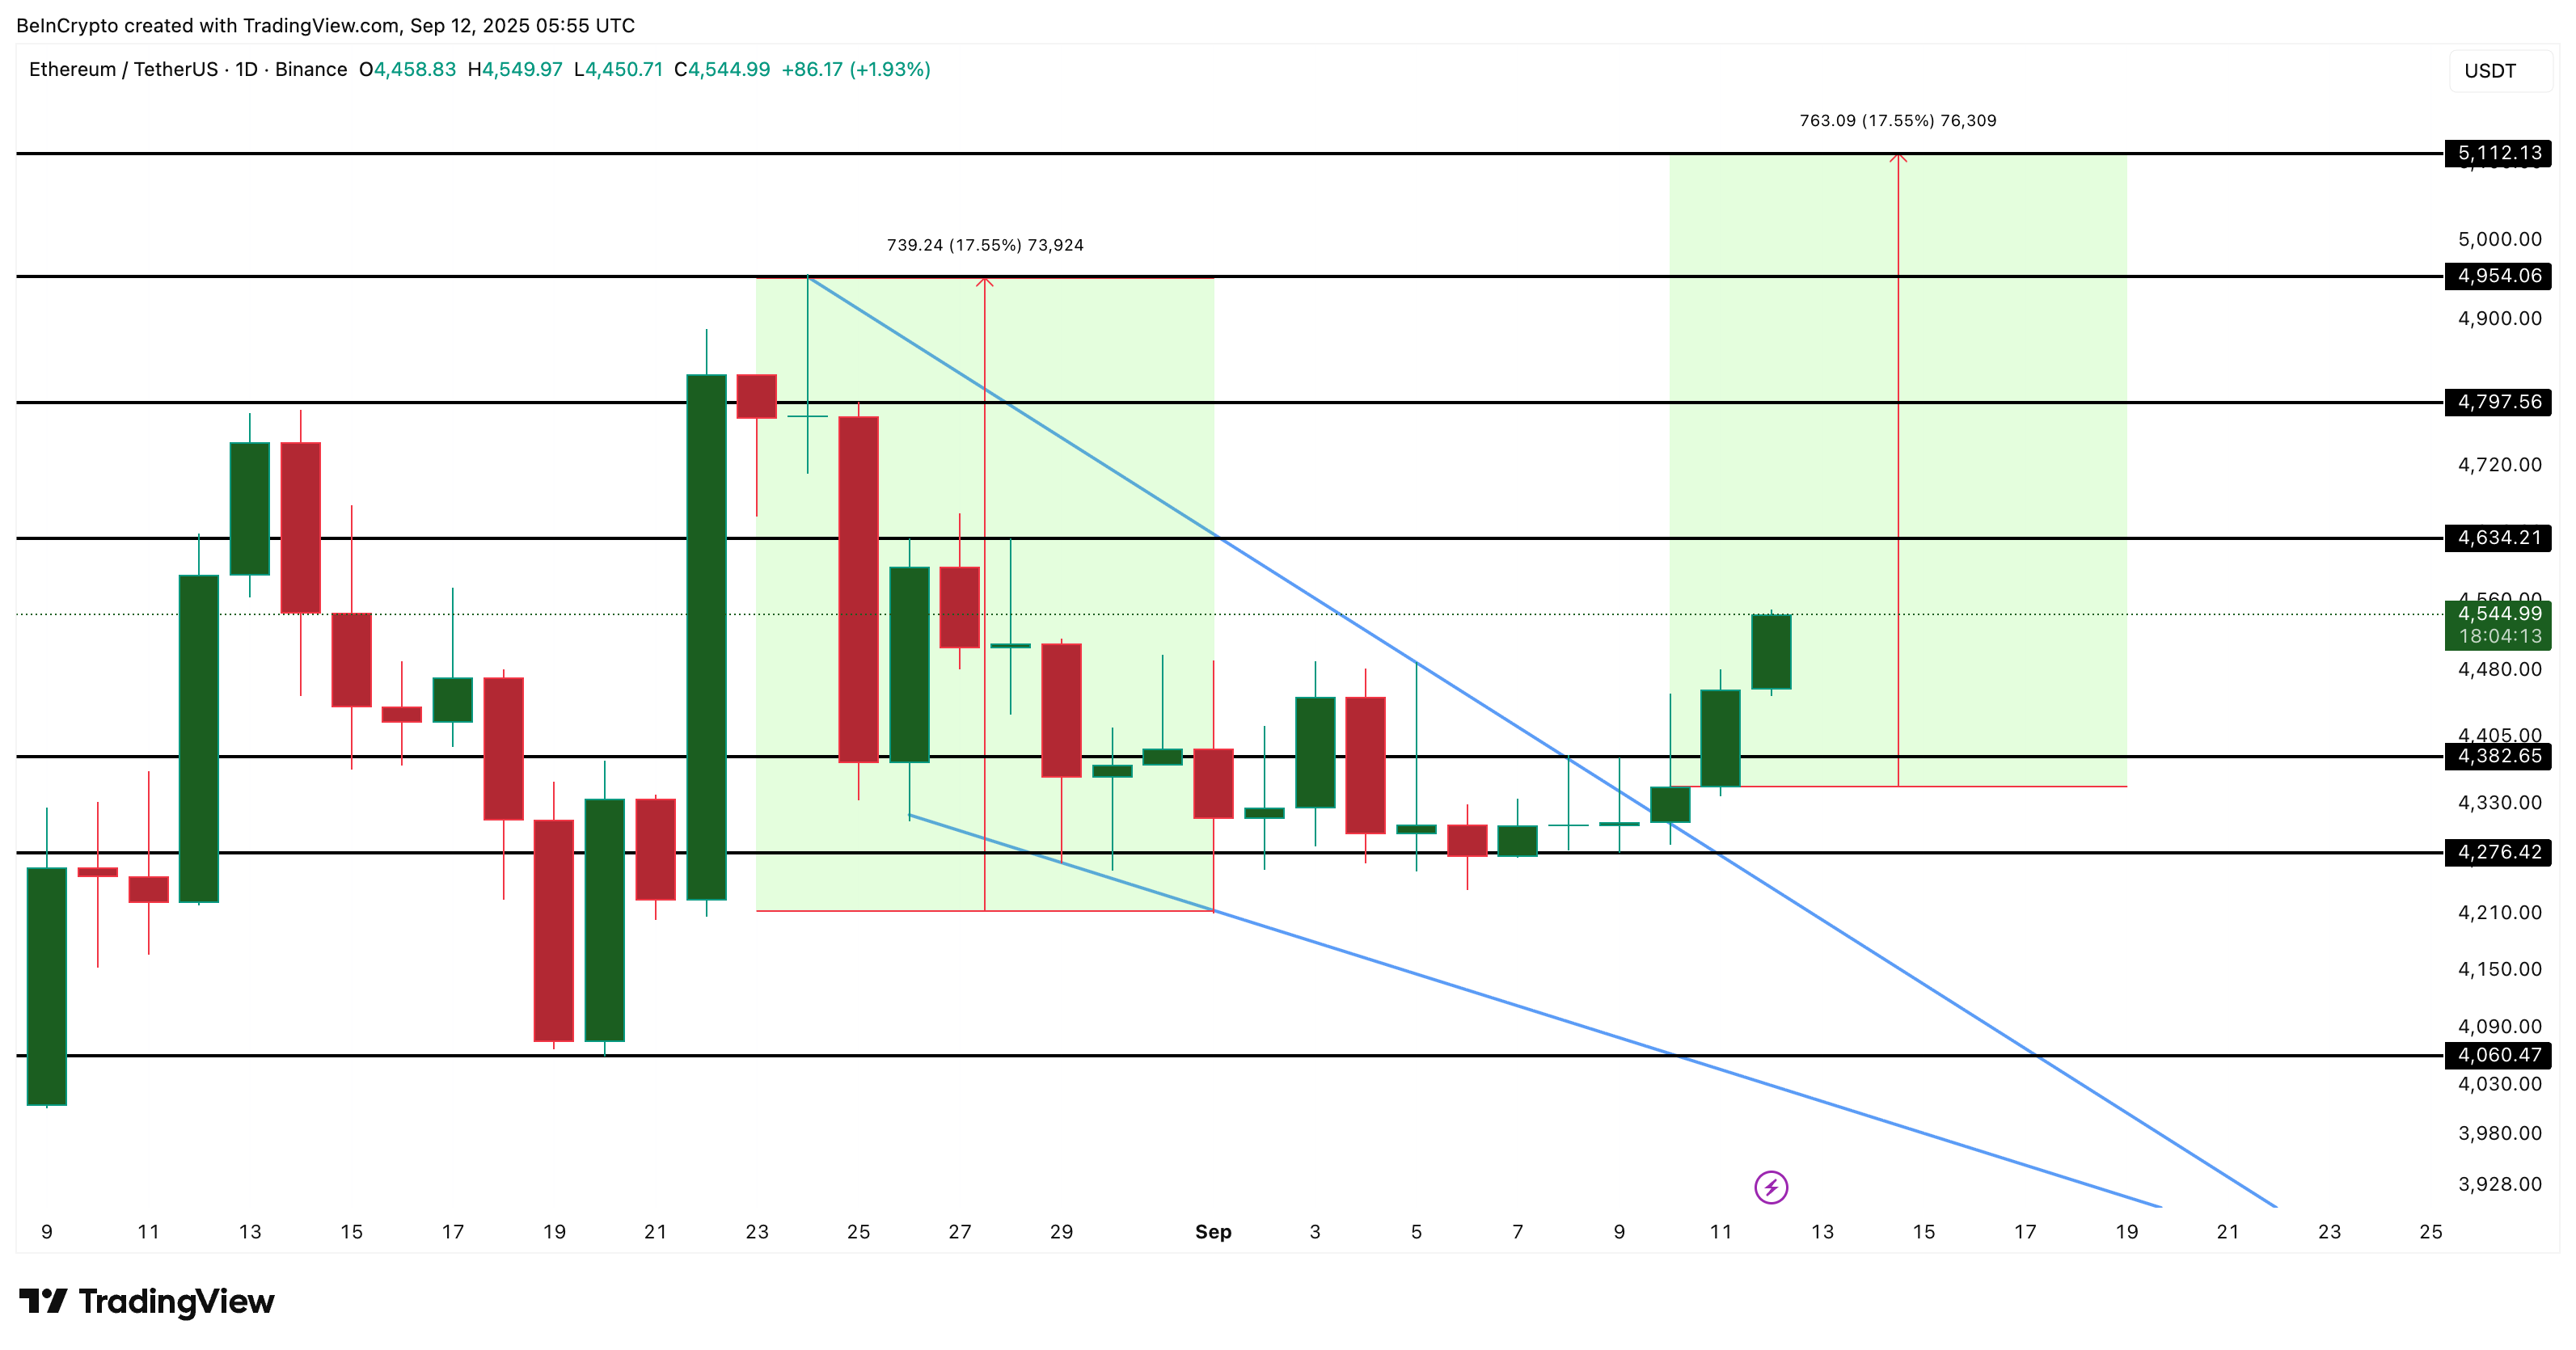
The target for this move is measured by taking the vertical distance between the wedge’s highest and lowest points. That distance is then projected from the breakout level. That gives a target of above $5,110, or nearly 12% higher than current levels, if market conditions allow.
Before that, the Ethereum price must clear several resistance levels. The first sits at $4,630, followed by $4,790 and the prior Ethereum price peak of almost $4,950.
On the downside, $4,380 is immediate support. Yet, a drop under $4,279 would invalidate the falling wedge breakout entirely and return ETH to a neutral outlook. And things get bearish if the price falls under $4,060, something that doesn’t look likely in the near-term.
