


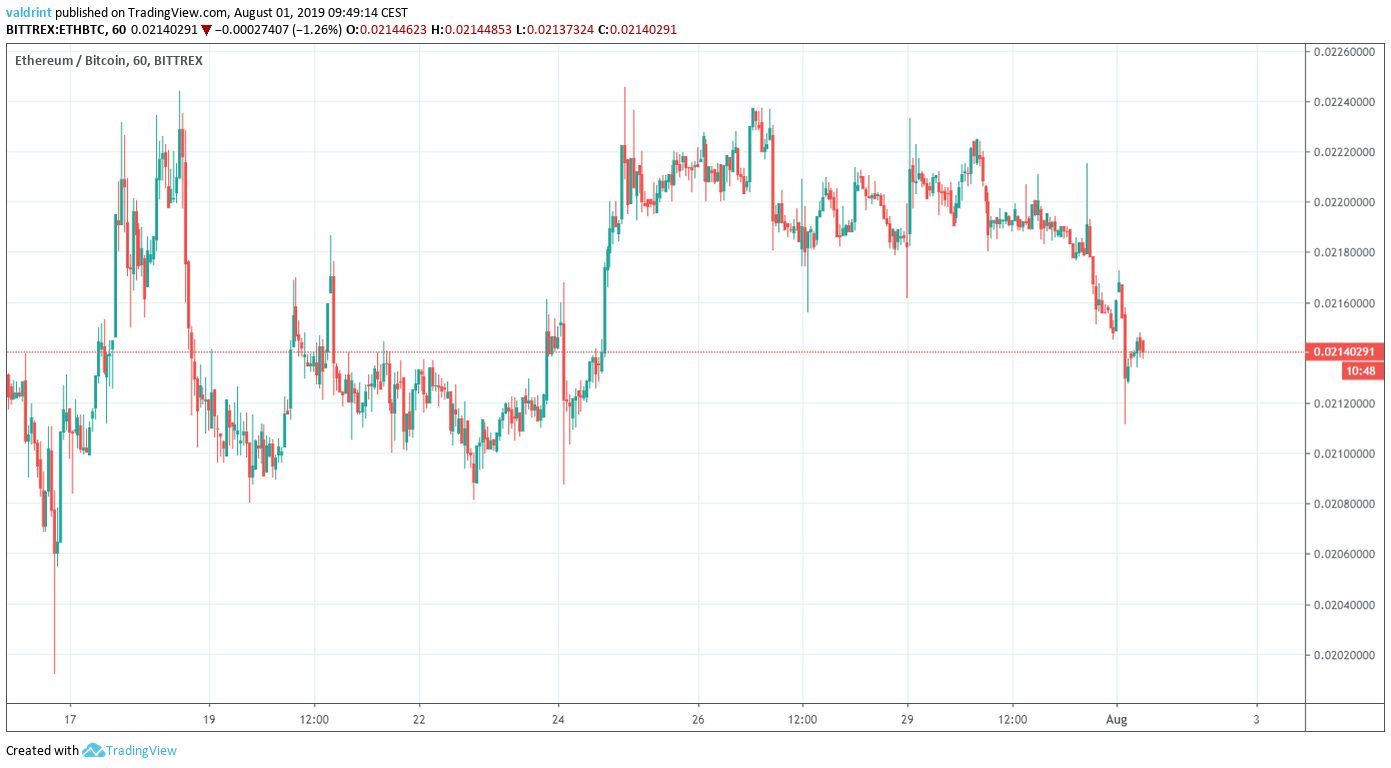
On July 16, 2019, the Ethereum (ETH) price reached a low of ₿0.020. An upward move ensued shortly after and the price reached a high of ₿0.0224 the next day. After a slight decrease, ETH reached similar highs on July 25 and 27. It has been decreasing since.
For our previous analysis, click here.
Looking to win Newcastle tickets? Follow this link to sign up for a free StormGain account, with our partner exchange, and get a chance to win free vouchers!
For a video analysis, click below:
https://www.youtube.com/watch?v=o8d_Gt13XXM
Ethereum Price: Trends and Highlights for August 1
- ETH/BTC is trading inside an ascending triangle.
- It is trading inside a long-term descending channel.
- There is long-term bullish divergence developing in the RSI & MACD
- There is support at ₿0.020.
- Also, there is resistance at ₿0.0235.
Current Pattern
A look at the hourly time-frame shows that the ETH price has been trading inside an ascending triangle since reaching a low on July 16.
The ascending triangle is considered a bullish pattern, making price breakouts more likely.
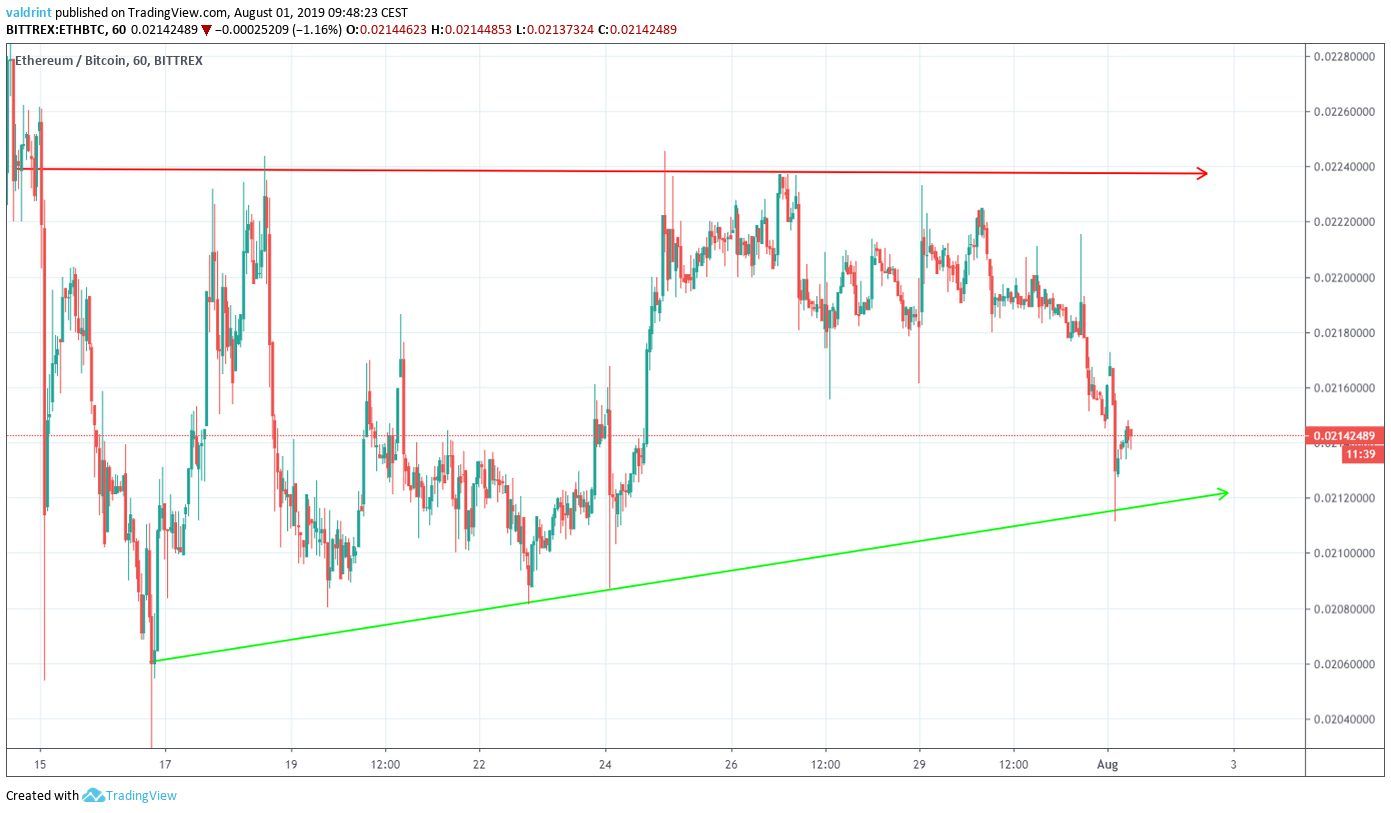
At the time of writing, the price was trading slightly above the support line.
A look at the RSI suggests that the price has begun to show signs of a reversal.
There is some bullish divergence developing in the RSI.
However, it is not very significant and is only present in short-term time-frames.
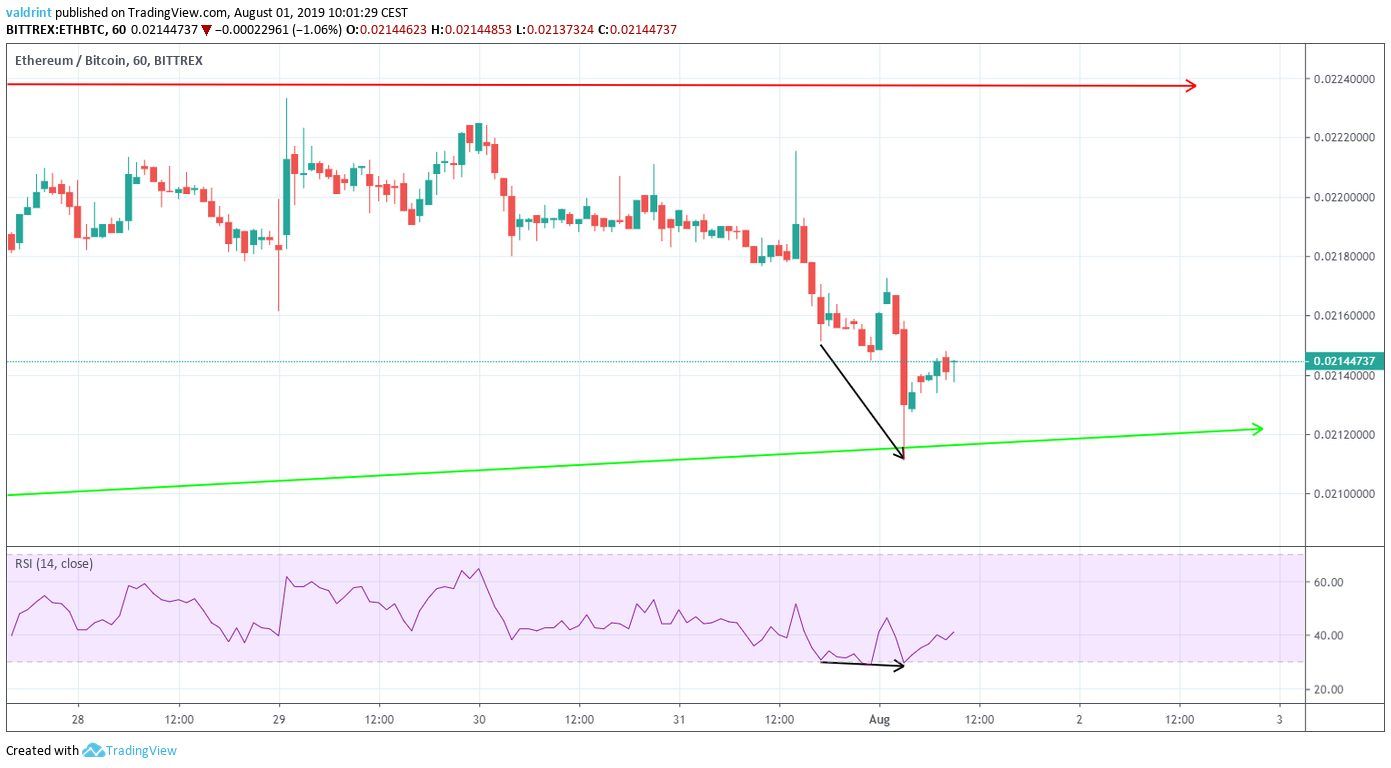
if the price were to again decrease to the support line and generate a more pronounced divergence, it would increase its significance.
Where will ETH go next?
Weekly Outlook
A look at the weekly time-frame shows us two things:
- ETH is trading inside a descending channel.
- There is a support area at ₿0.020
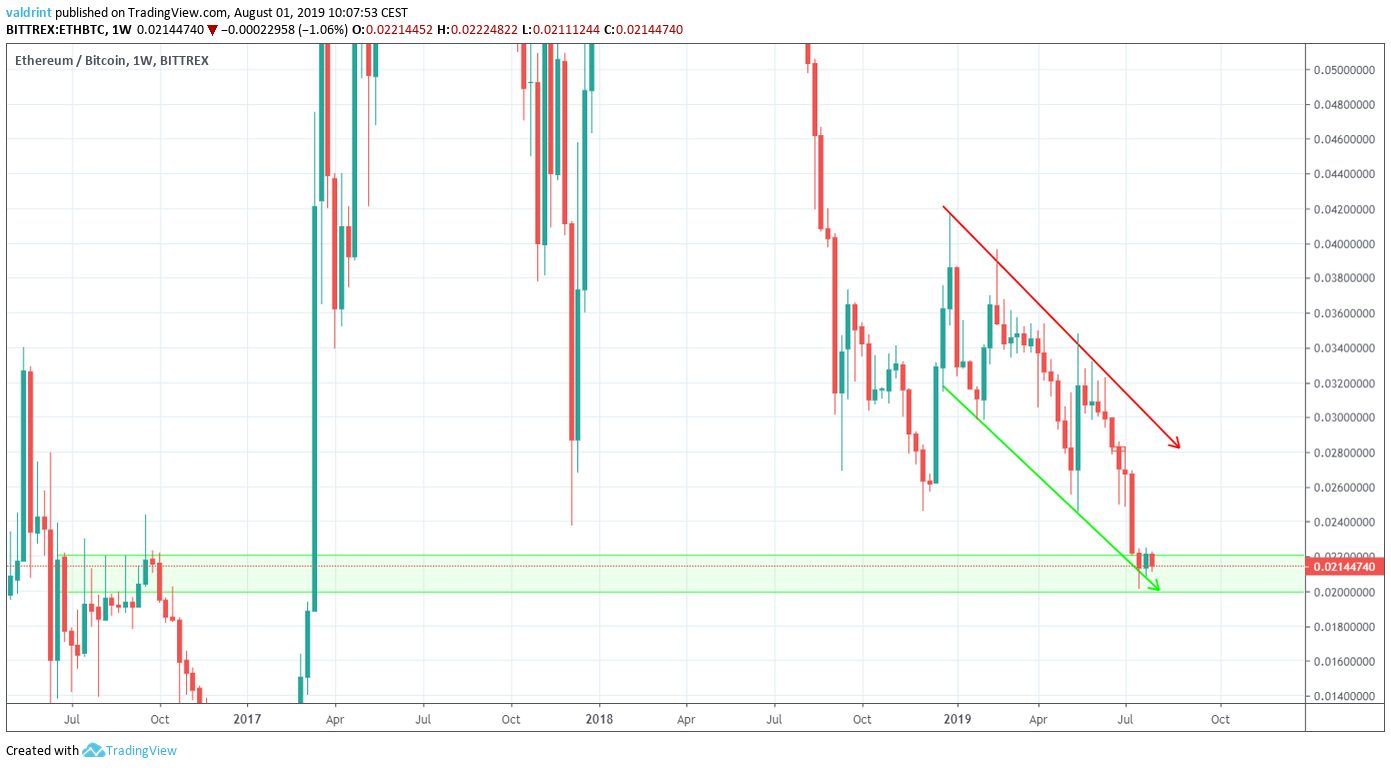
The Ethereum price has not traded below this level since March 2017.
This makes it a likely place for the initiation of a reversal.
Additionally, we can see that both the RSI & MACD suggest that ETH is likely to initiate an upward move.
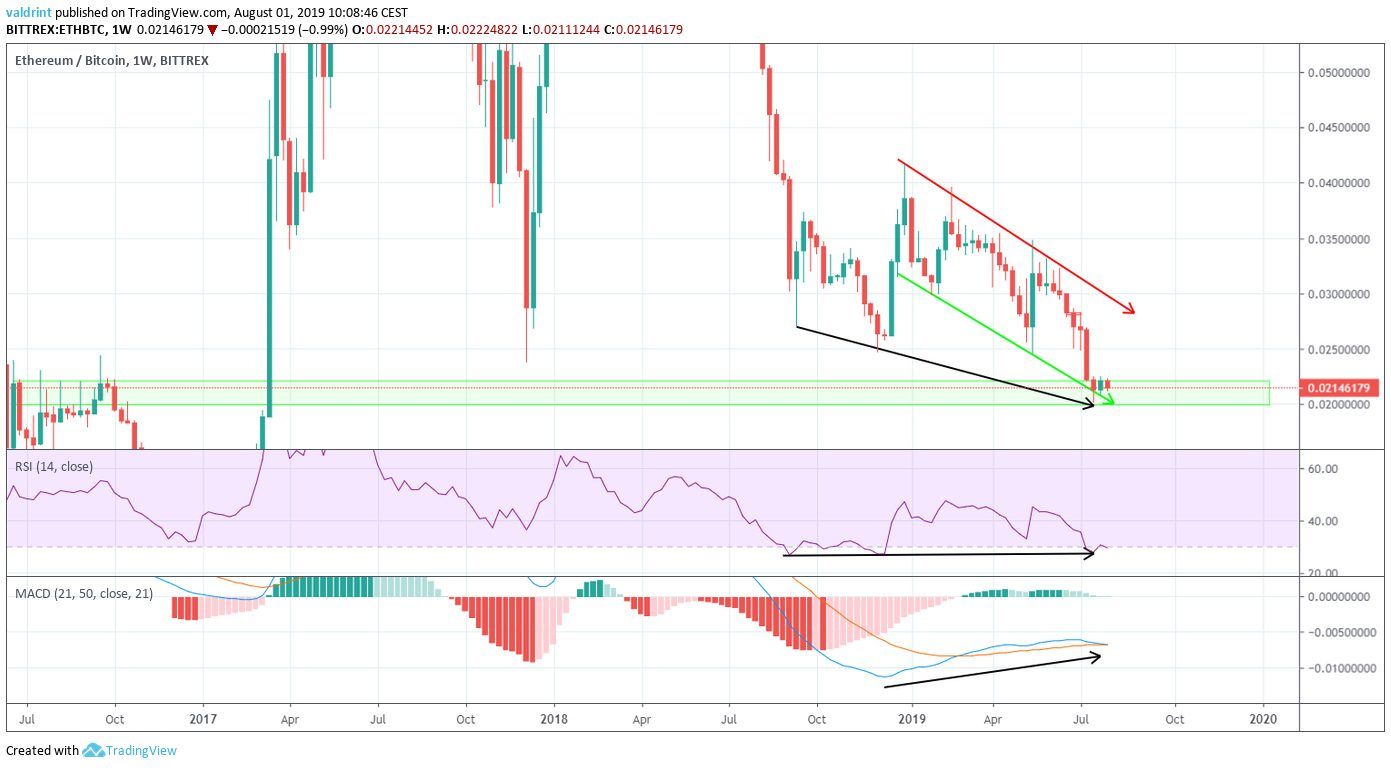
The RSI has been generating bullish divergence since July 2018.
The MACD has done so since December of the same year.
The divergence is very significant and present in long-term time-frames.
It is very uncommon for a divergence to be present in a weekly time-frame.
The use of these indicators makes it likely that Ethereum will soon increase towards the resistance line.
Breakout Target
If the price breaks out, one resistance area is outlined below.
It serves as a target for the breakout.
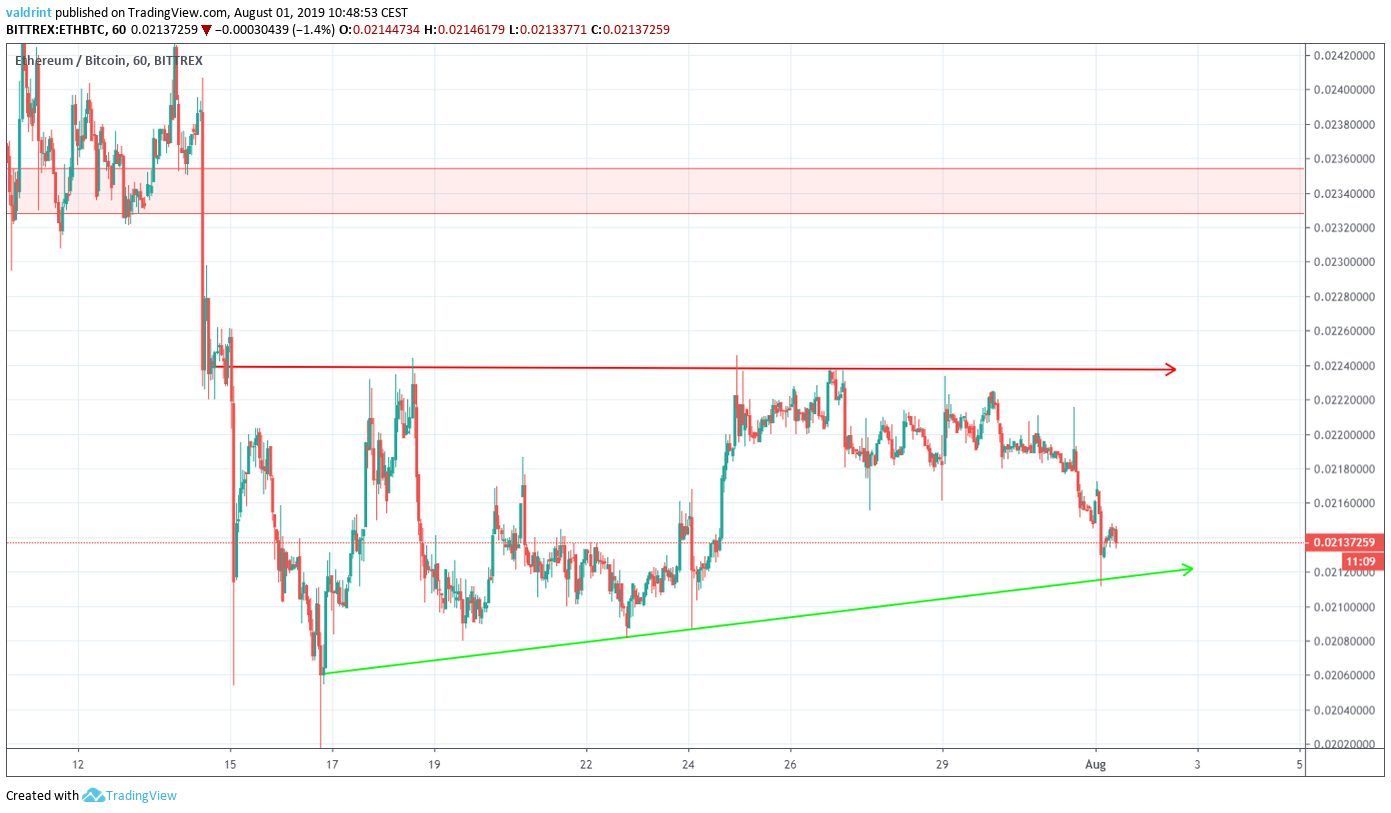
The resistance area is found at ₿0.0235.
According to our analysis, the ETH price is likely to reach it.
Ethereum Price Summary
Ethereum is trading inside a short-term ascending triangle.
According to our analysis, it is likely to increase towards the resistance line and eventually break out.
Do you think ETH will break out from the triangle? Let us know in the comments below.
Disclaimer: This article is not trading advice and should not be construed as such. Always consult a trained financial professional before investing in cryptocurrencies, as the market is particularly volatile.
Images are courtesy of TradingView.


