


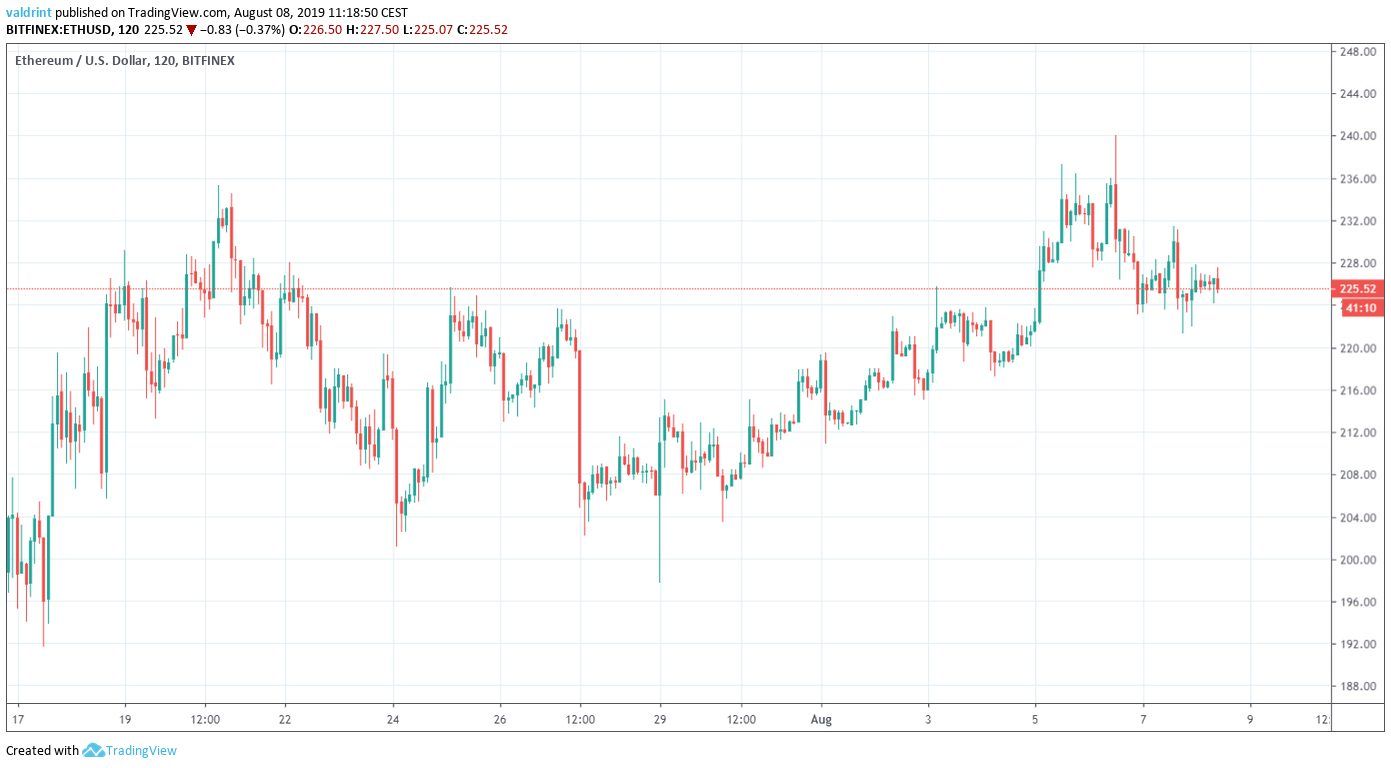
On July 17, 2019, the Ethereum price reached a low of $191. An upward move ensued and ETH made a high of $235 on July 20. After decreasing and making a higher low, ETH reached a high of $240 on August 6.
Will Ethereum continue to increase or is there a reversal in store? If you want to find out, continue scrolling below.
For our previous analysis, click here.

Ethereum Price: Trends and Highlights for August 8
- ETH/USD is trading inside an ascending triangle.
- There is support at $223.
- ETH is trading inside a short-term descending wedge.
- The short-term RSI has been generating bullish divergence.
Current Pattern
A look at the two-hour time-frame shows that since reaching the aforementioned low on July 17, the Ethereum price has been trading inside the ascending triangle outlined below.
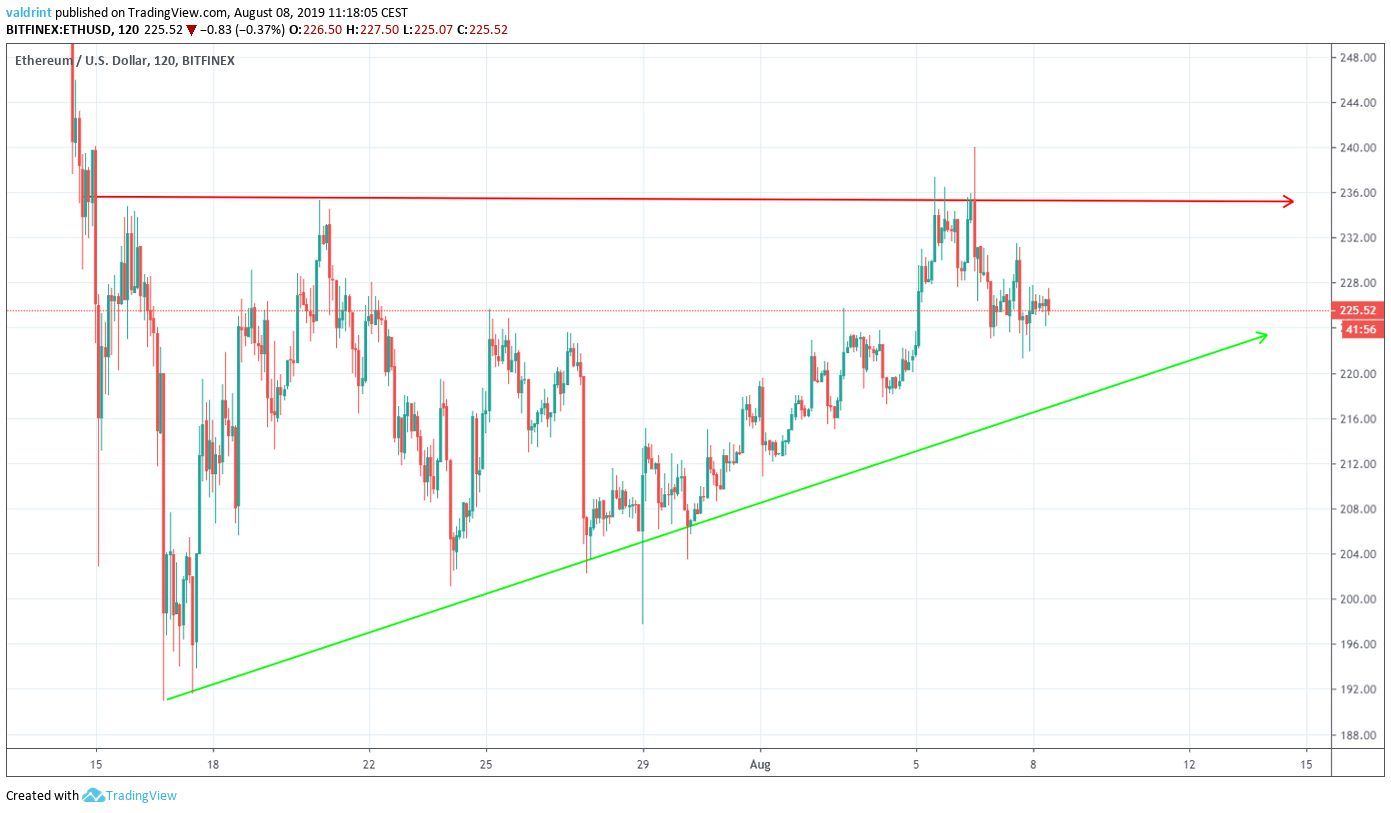
The ascending triangle is considered a bullish pattern, making a price breakout more likely.
After reaching the resistance line on August 6, ETH began to decrease creating a long upper wick.
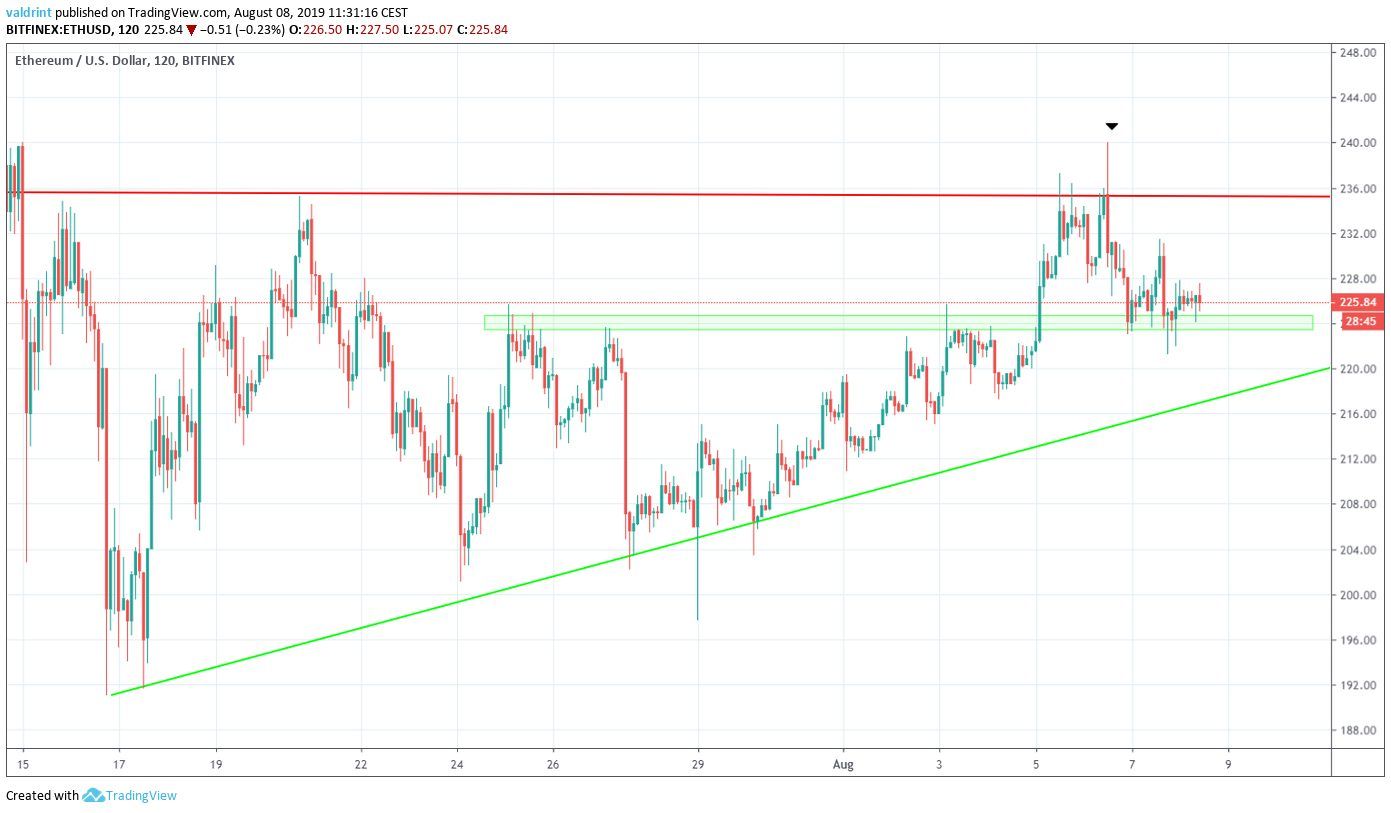
It did so until it reached the minor support area at $223.
It has been trading close to that level since.
Let’s take a closer look and try to predict whether the support line will hold.
Short-Term Wedge
A look at the hourly time-frame shows that the Ethereum price has been trading inside a short-term descending wedge.
Similar to the ascending triangle, the descending wedge is considered a bullish pattern.
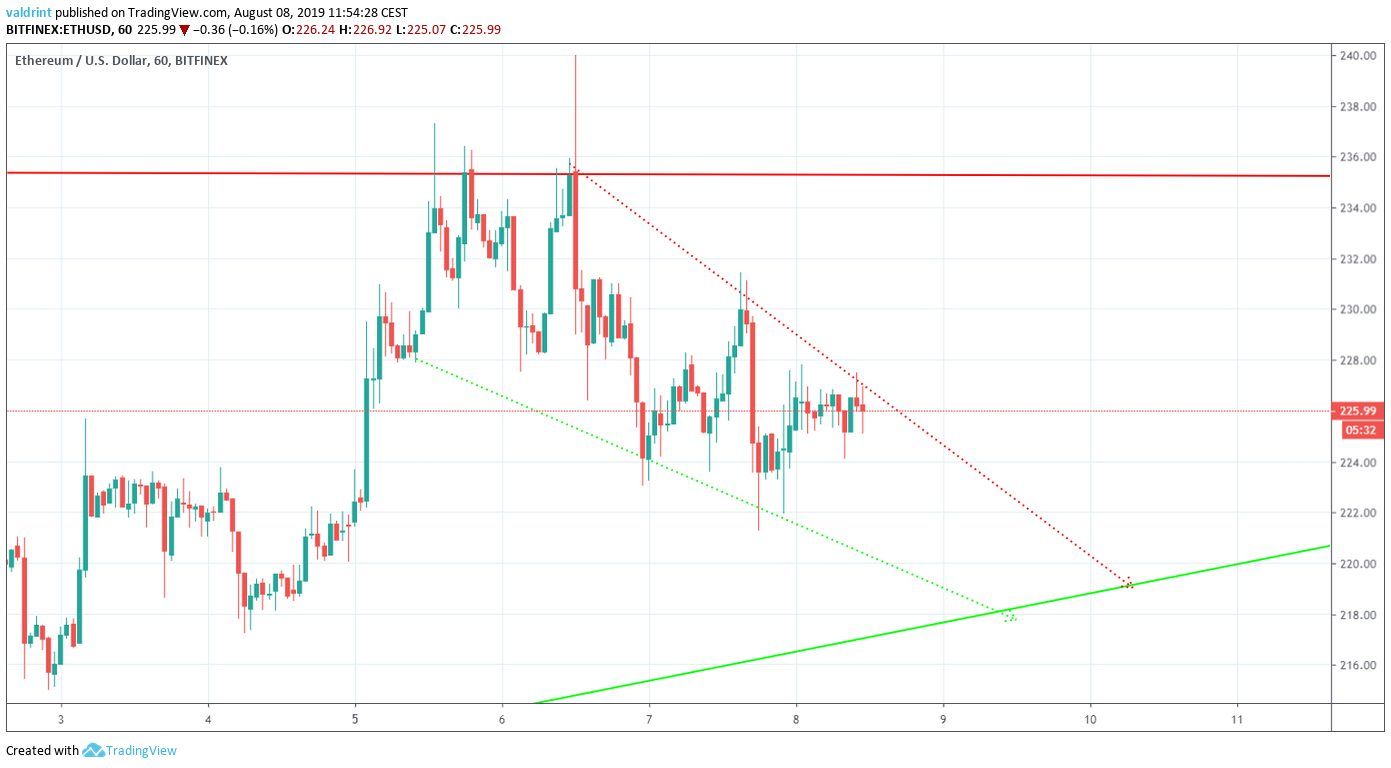
At the time of writing, it was trading at the resistance line of the wedge.
A look at the RSI shows that the recent move from support to resistance was preceded by a bullish divergence
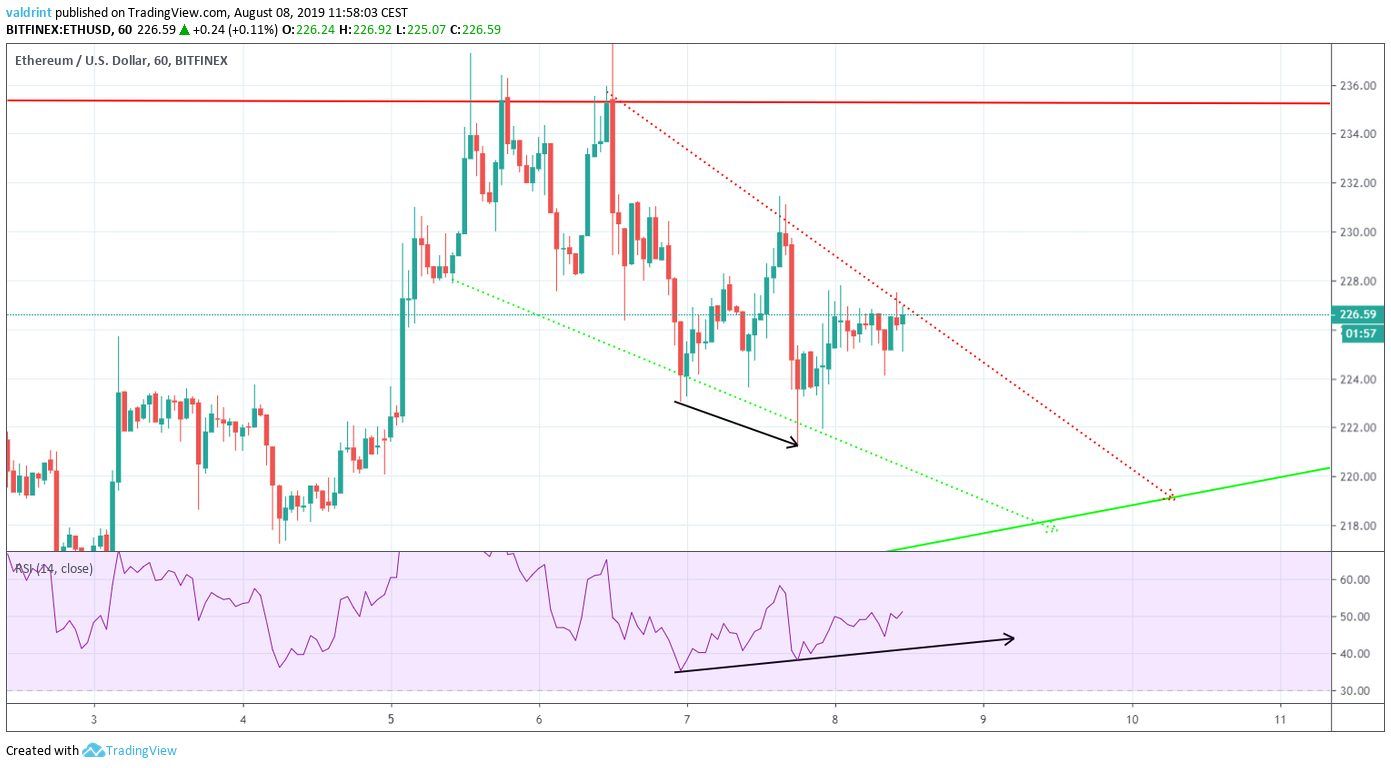
However, the divergence is only present in time-frames of up to two hours.
One possible scenario for future Ethereum price movements would be a decrease inside the confines of the wedge before an eventual breakout.
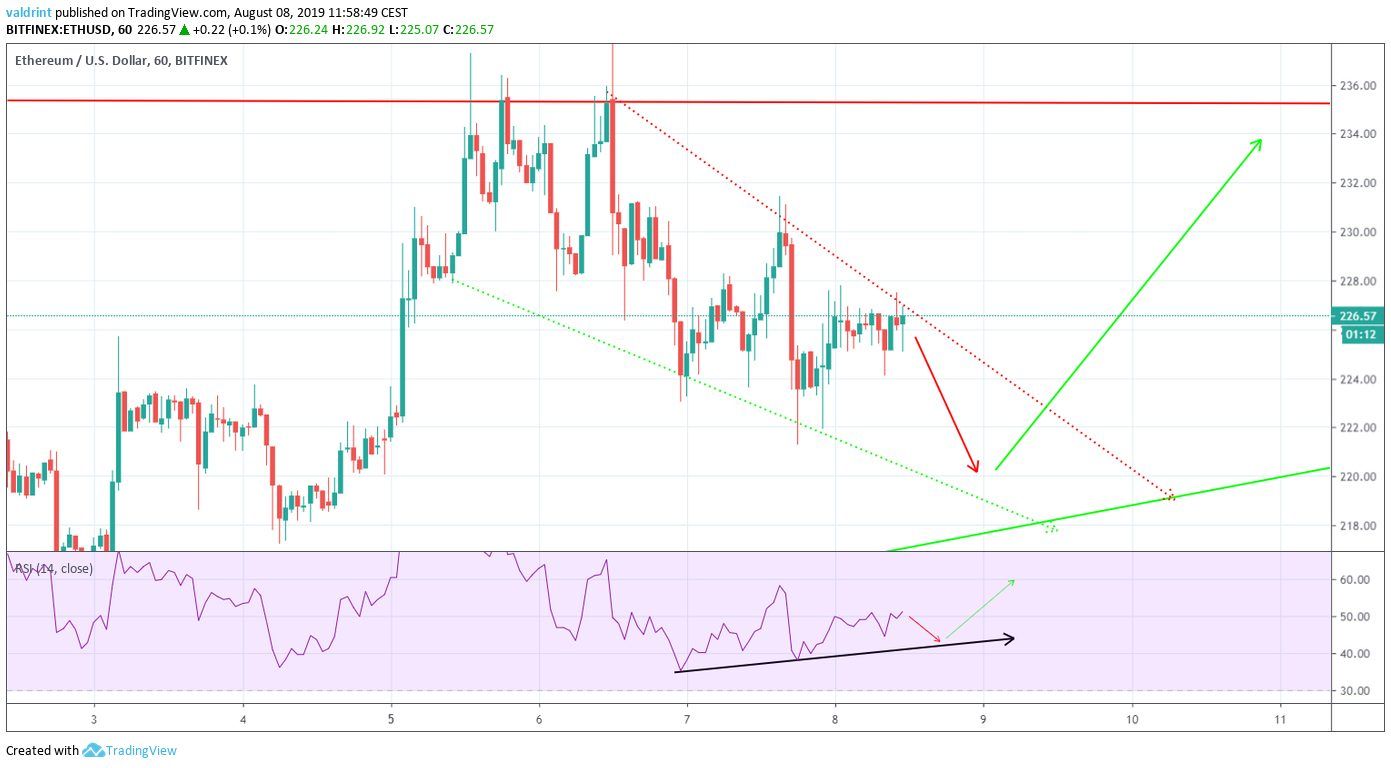
If the price were to decrease all the way to the ascending support line, that would give more strength to the potential upward move that follows.
Additionally, this would allow the RSI to bounce on the bullish divergence trend line before it resumes its upward movement.
Therefore, the combination of different time-frames and indicators makes us believe that the Ethereum price will eventually break out from the wedge.
Ethereum Price Summary
The Ethereum price is trading inside a short-term descending wedge.
According to our analysis, it is likely to decrease at the rate predicted by the wedge before breaking out.
Afterward, it is likely to reach the resistance line of the triangle at $235.
Do you think ETH will break out from the wedge? Let us know in the comments below.
Buy and trade Ethereum and other assets with a 100x multiplier on our partner exchange, StormGain.
Disclaimer: This article is not trading advice and should not be construed as such. Always consult a trained financial professional before investing in cryptocurrencies, as the market is particularly volatile.
Images are courtesy of TradingView and Shutterstock.


