


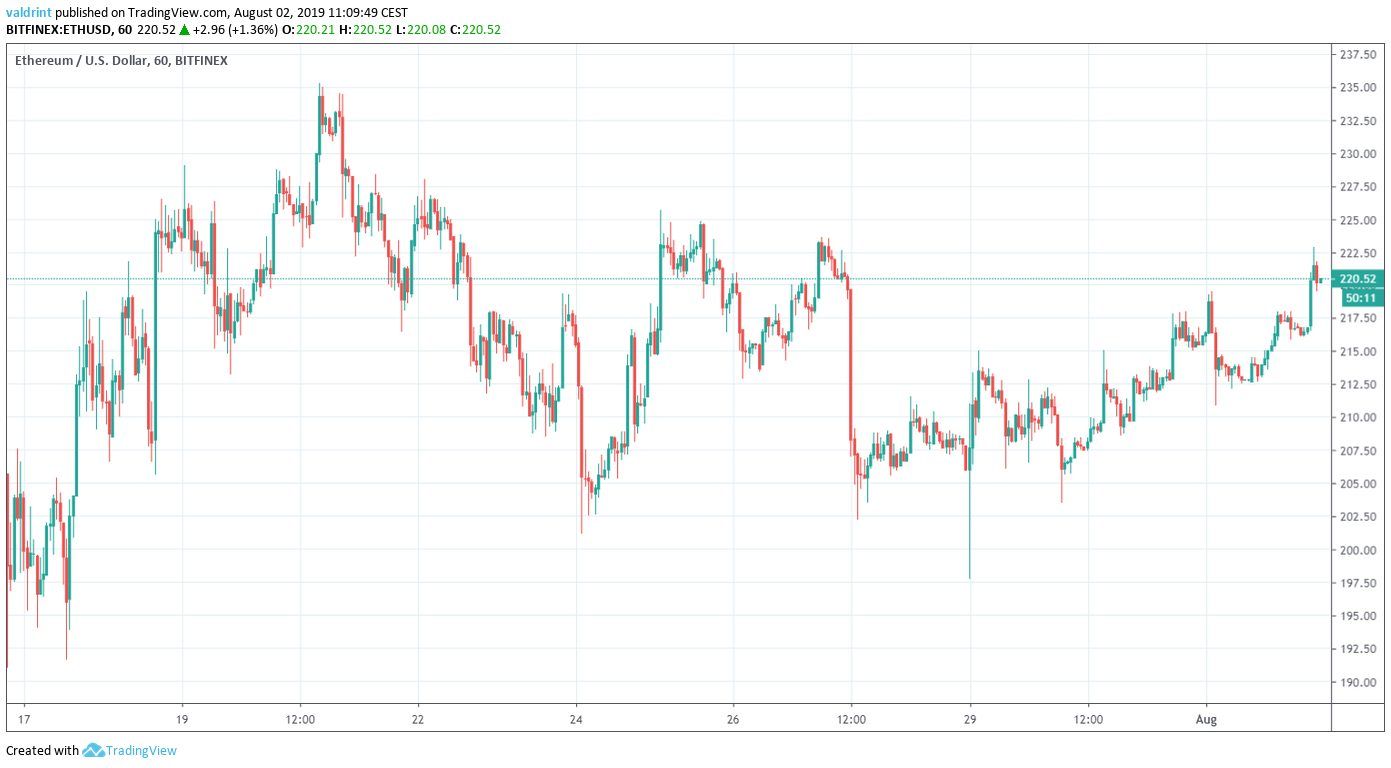
On July 17, 2019, the Ethereum price reached a low of $191.6. An upward move ensued. On July 20, ETH reached a high of $235.27. Since then, it has been decreasing, trading inside a range between $200 and $225.
Will ETH move outside of this trading range? Continue reading if you want to find out the answer.
For our previous analysis, click here.
Looking to margin trade Ethereum (ETH) and other cryptocurrency assets? Check out our partner exchange! Follow this link to get a free StormGain account!
Ethereum Price: Trends and Highlights for August 2
- ETH/USD broke out from a symmetrical triangle.
- It is following a long-term ascending support line.
- Daily moving averages are close to making a bullish cross.
- There is resistance at $230.
Breakout
A look at the hourly time-frame shows that since reaching a low on July 17, the ETH price has been trading inside the symmetrical triangle outlined below.
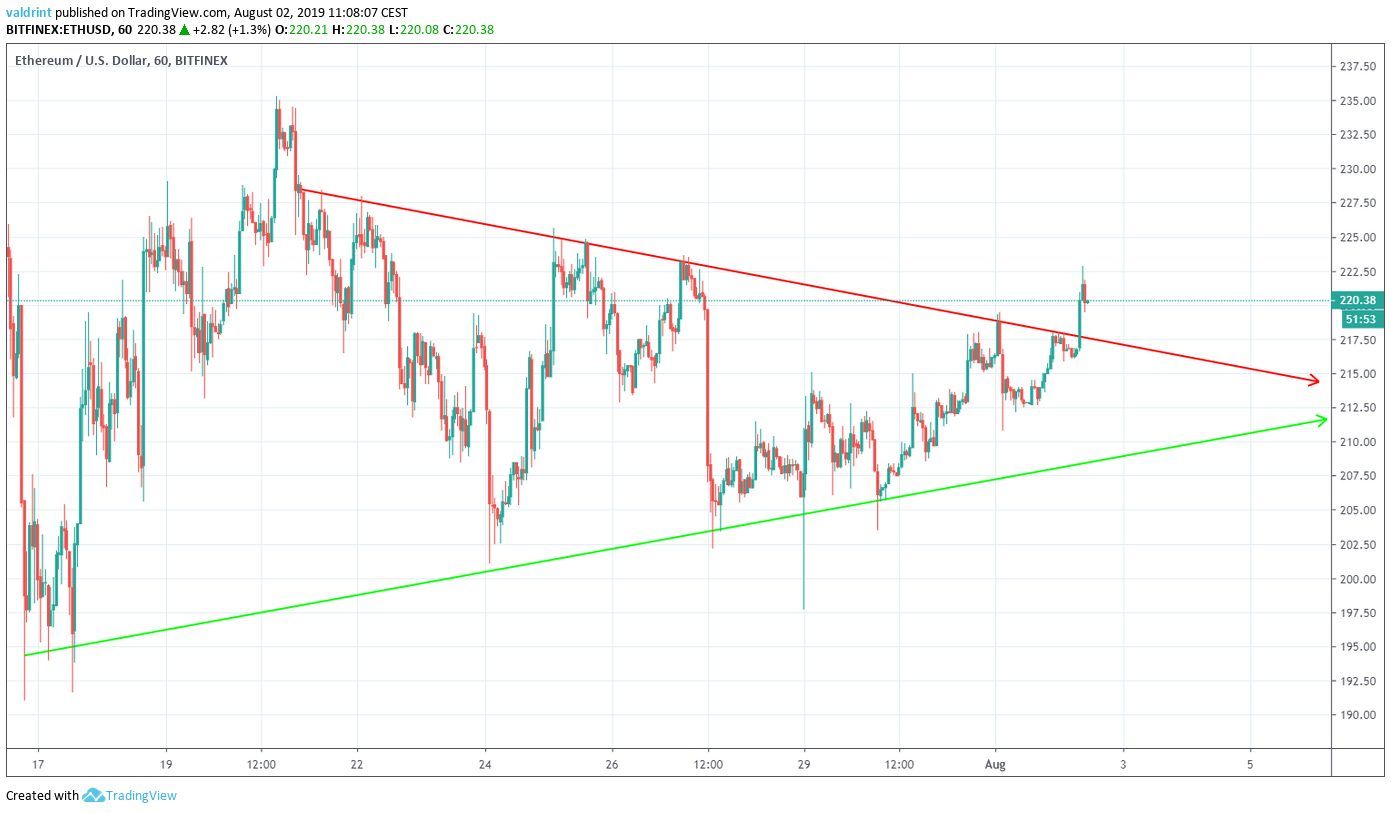
On August 2, ETH broke out from this triangle.
However, the breakout transpired with only average volume.
Additionally, there is some bearish divergence developing in the short-term RSI.
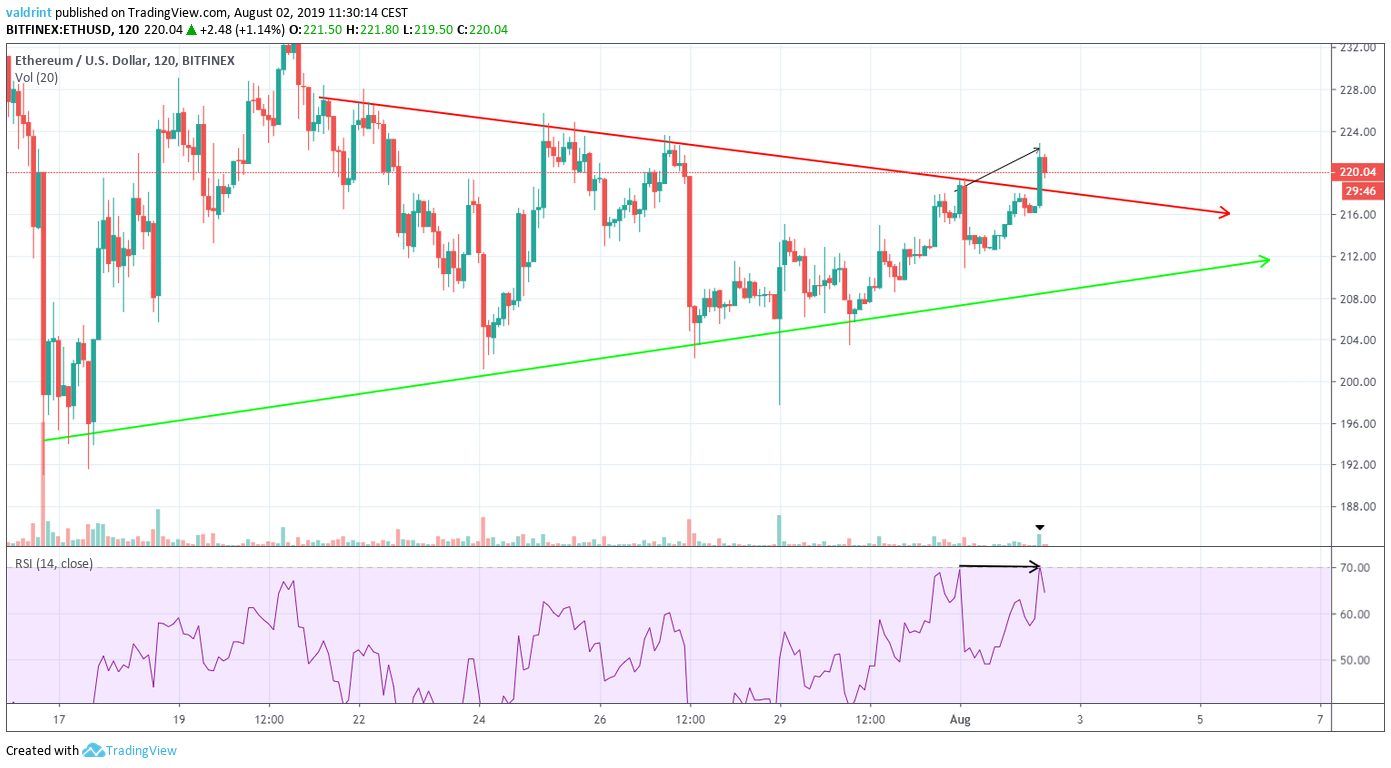
This makes us skeptical about the future prospects of the price.
Let’s take a look at a longer-term time-frame to see where ETH is headed.
Long-Term Support
A look at the daily time-frame shows that ETH has been following an ascending support line since December 2019.
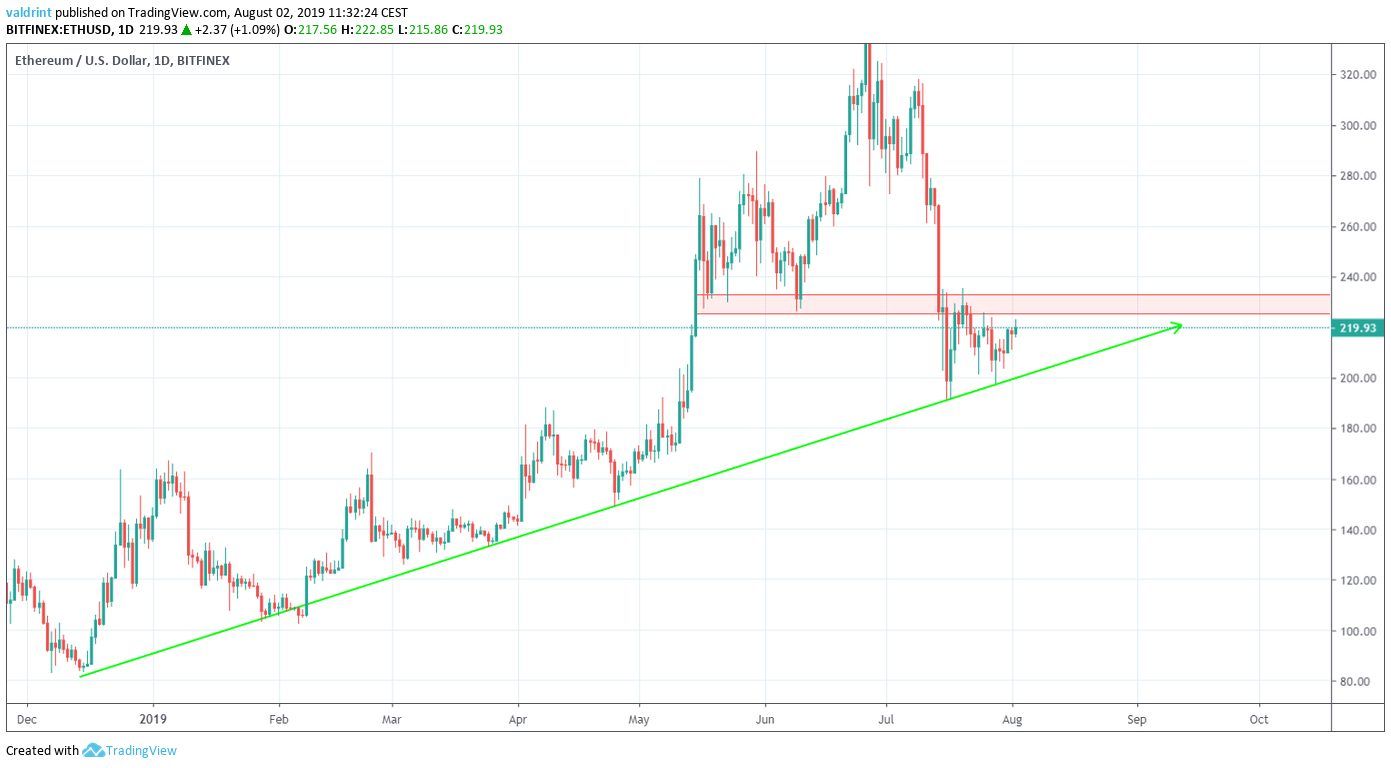
At the time of writing, it was trading very close to the support line.
This is the fifth time that the line has been touched, increasing its significance.
Additionally, we can see that there is a resistance area at $230.
A look at the moving averages (MA) and the MACD shows that the relationship between the price and MAs is at a critical point.
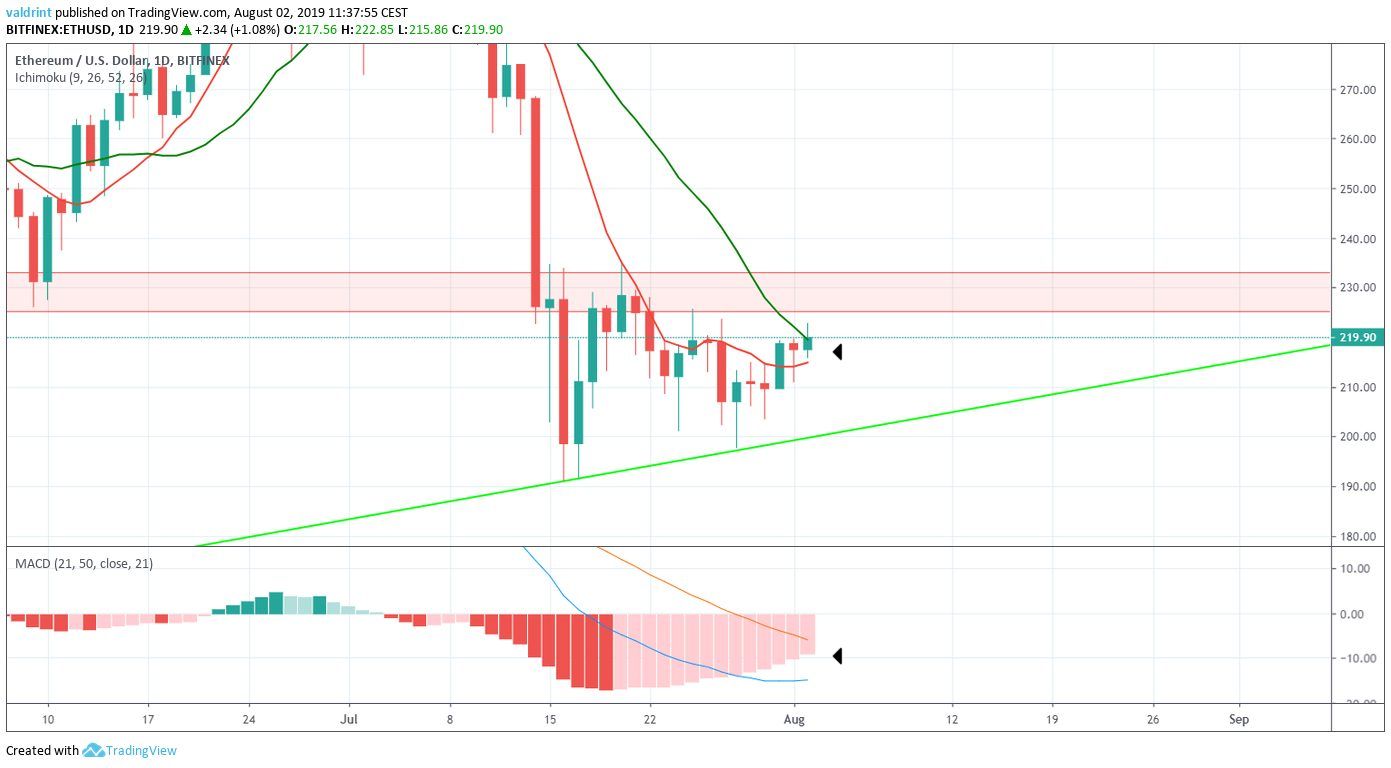
The Ethereum price is trading above the 10-day MA but below the 20-day one.
The 10-day MA is moving upward, possibly setting itself up for a bullish cross.
The MACD is doing the same.
A bullish cross in both indicators would likely confirm the uptrend.
A stronger sign would be if that were combined with a price breakout above the resistance area.
However, due to the short-term bearish divergence, we believe this is unlikely in the very near future.
Future Movement
An outline of possible future price movements is given below.
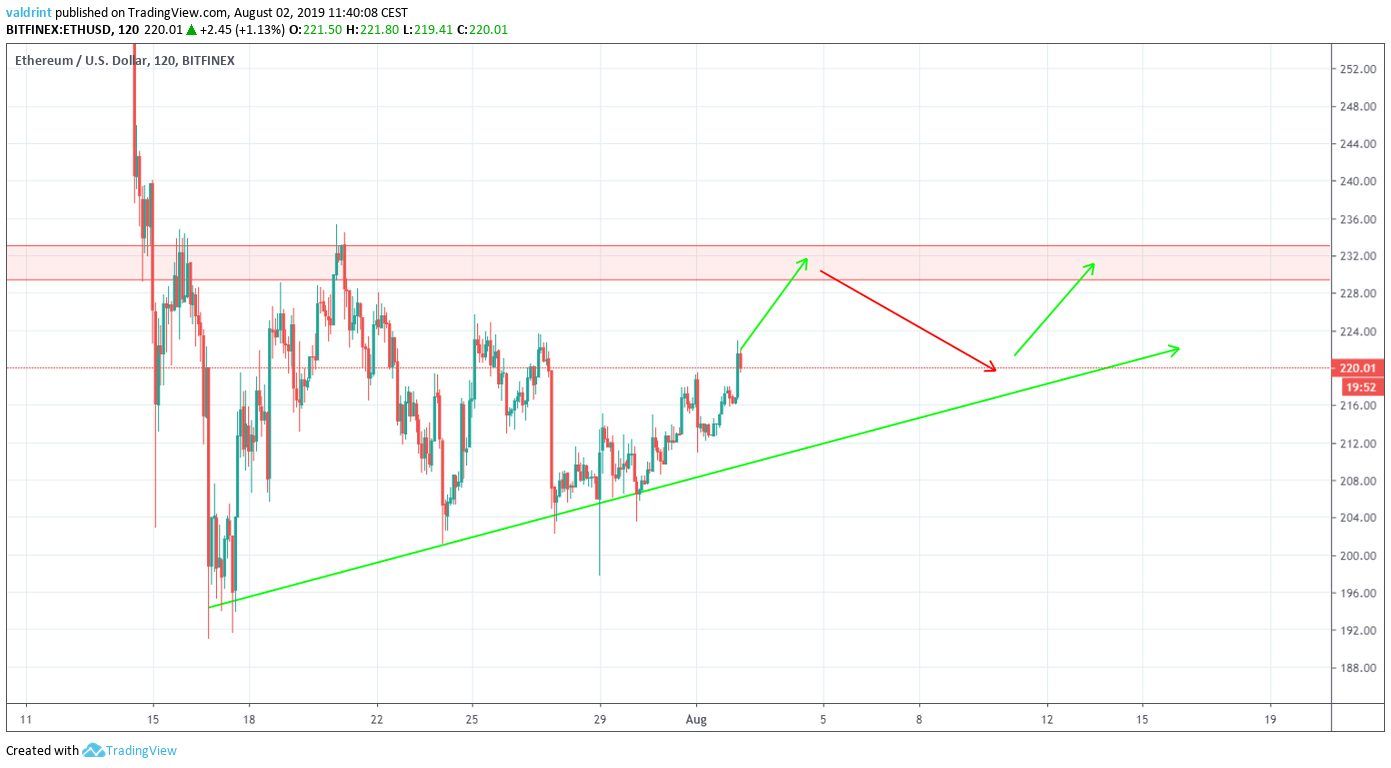
We believe that the Ethereum price is likely to reach the resistance area.
Afterward, it should decrease towards the support line of the previous triangle.
Ethereum Price Summary
The Ethereum price recently broke out from a symmetrical triangle.
The breakout was weak.
According to our analysis, it is likely to reach the resistance area outlined above before beginning to decrease.
Do you think Ethereum will reach the resistance area? Let us know in the comments below.
Disclaimer: This article is not trading advice and should not be construed as such. Always consult a trained financial professional before investing in cryptocurrencies, as the market is particularly volatile.
Images are courtesy of TradingView and Shutterstock.


