
On August 6, 2019, the Ethereum price reached a high of $240. A downtrend began the same day. On August 10, the ETH price reached a low of $201. It has been increasing since then.

At the time of writing, the ETH price was trading at $208.
Where will it go next? Continue reading if you are interested in finding out.
For our previous analysis, click here.
Buy and trade Ethereum and other assets with a 100x multiplier on our partner exchange, StormGain.

Ethereum Price: Trends and Highlights for August 14
- ETH/USD broke out above a descending resistance line.
- It is trading inside an ascending channel.
- ETH has found support above the 200-day moving average.
- Volume has been higher during bullish candlesticks.
- There is minor resistance at $216 and $224.
Previous ETH Price Movement
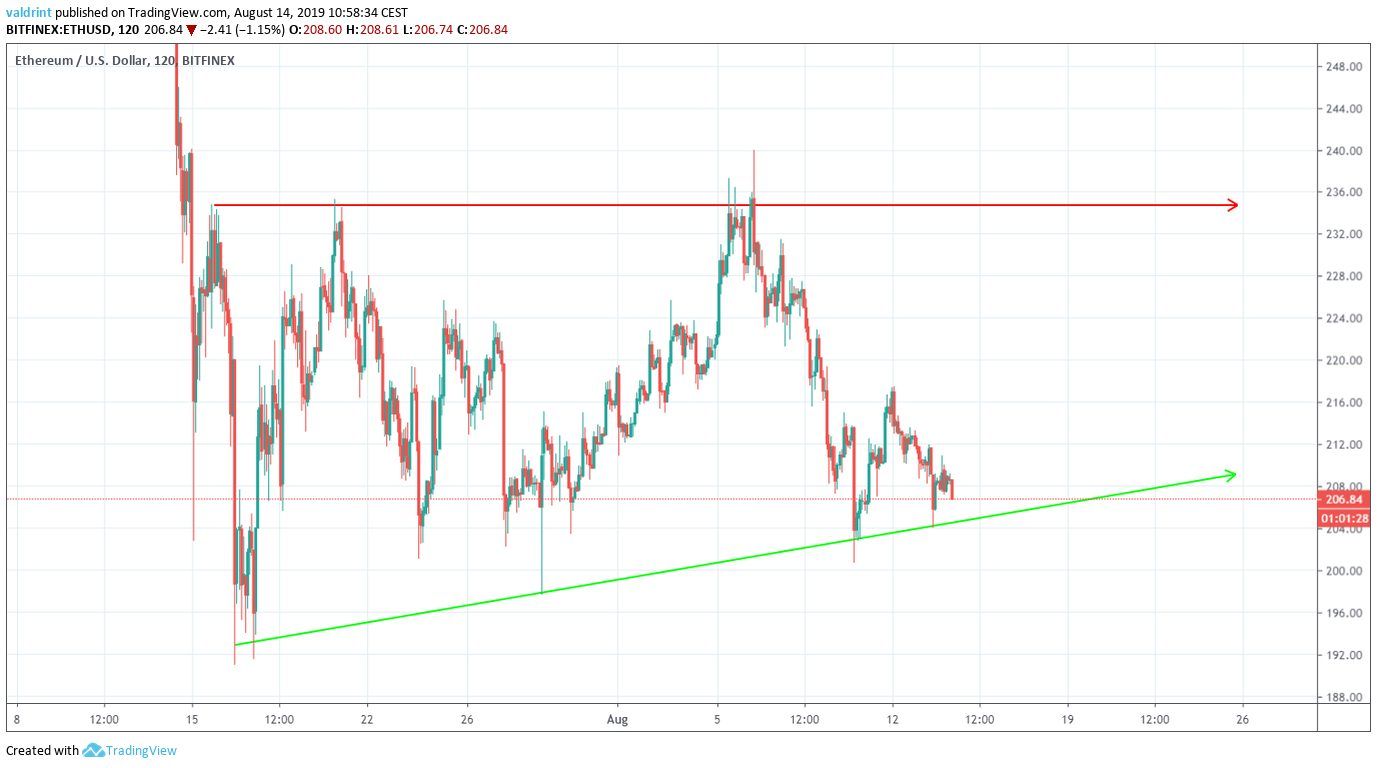
A closer look at the hourly time-frame shows that ETH has been following a descending resistance line since reaching the aforementioned high on August 6.

On August 11, ETH broke out above this line.
Afterward, it decreased and validated it as support on August 13.
Ascending Triangle
A look at a longer-term time-frame reveals that since reaching a low of $192 on August 15, the Ethereum price has been trading inside an ascending triangle.
At the time of writing, it was trading very close to the support line, which has been touched four times — increasing its validity.
Additionally, the support line gains more validity once we incorporate moving averages into the analysis.
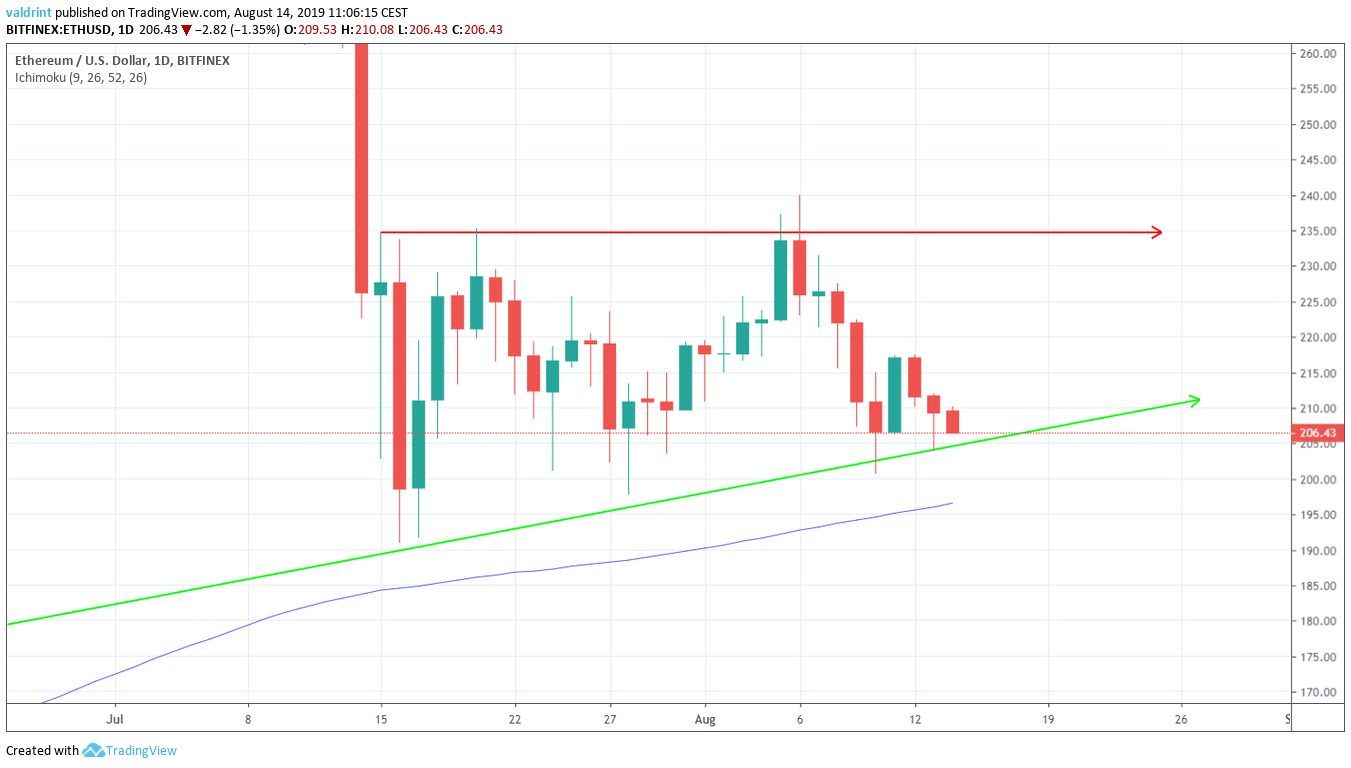
We can see that the Ethereum price is trading slightly above the 200-day moving average, which is seemingly providing support.
Combining this with the fact that the ascending triangle is a bullish pattern, an upward move that reaches at least the resistance line seems likely.
Candlestick Analysis
A closer look at daily candlesticks analysis reveals a bullish sentiment.
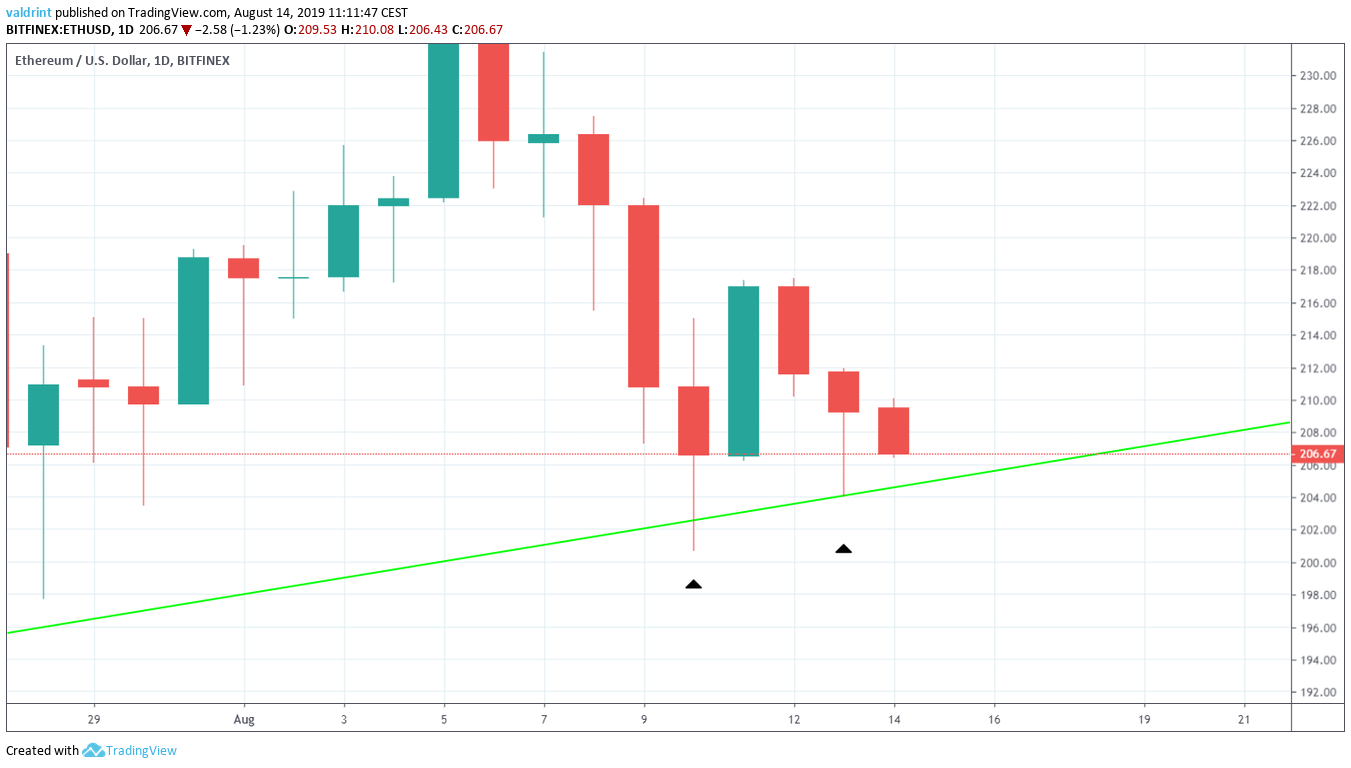
Price created a harami with a long lower wick on August 10 and followed it up with a bullish engulfing candlestick.
Afterward, it created a hammer — which likewise has a long lower wick.
This is a sign of buying pressure.
While the current daily candlestick is shaping up to be bearish, we should keep in mind that this movement is occurring while BTC has decreased significantly.
Since most alternate coins usually follow BTC, the Ethereum price has been holding up quite well.
Therefore, once BTC starts consolidating, we would expect the Ethereum price to move upward.
A similar bullish sentiment is given by an analysis of the volume.
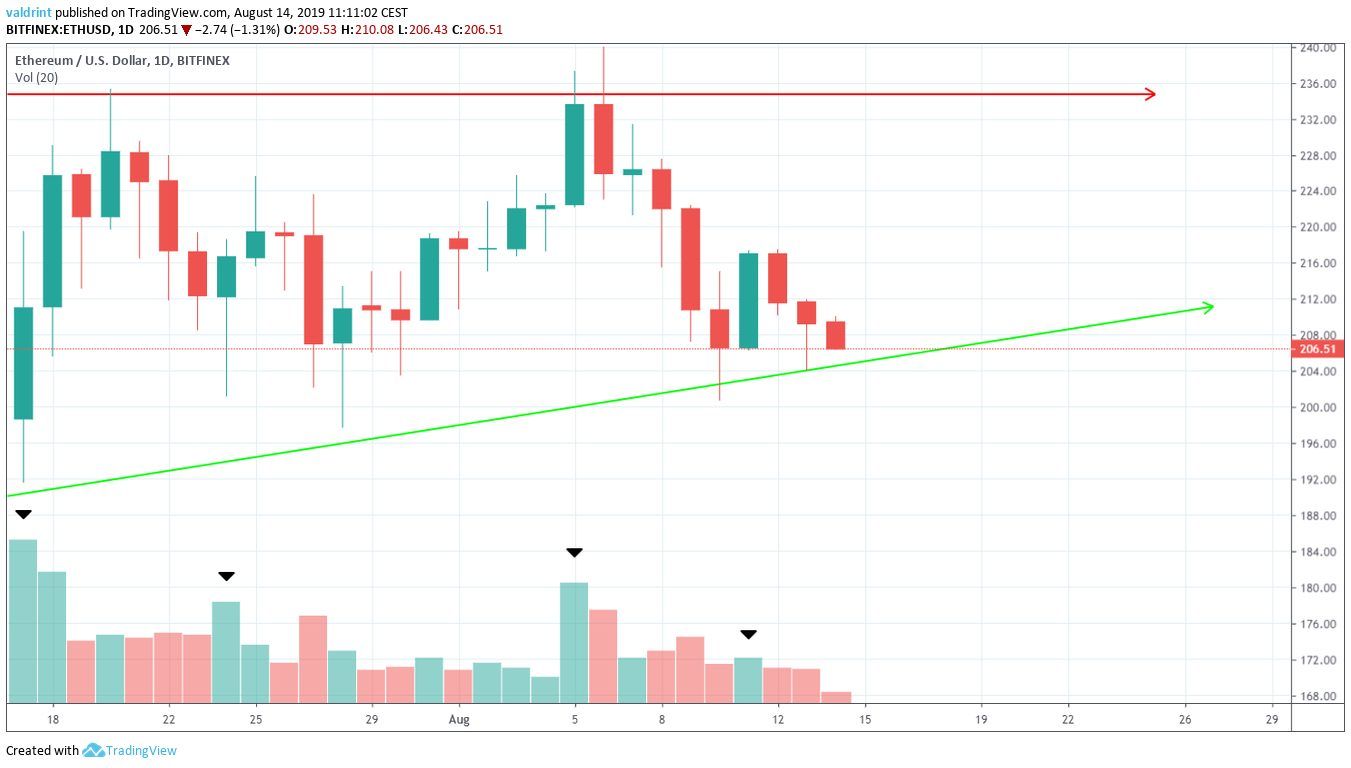
We can see that volume has been consistently higher during bullish candlesticks.
Therefore, we believe that ETH will increase towards the resistance line.
Future Movement
If the Ethereum price begins an upward move, two minor resistance areas are outlined below:
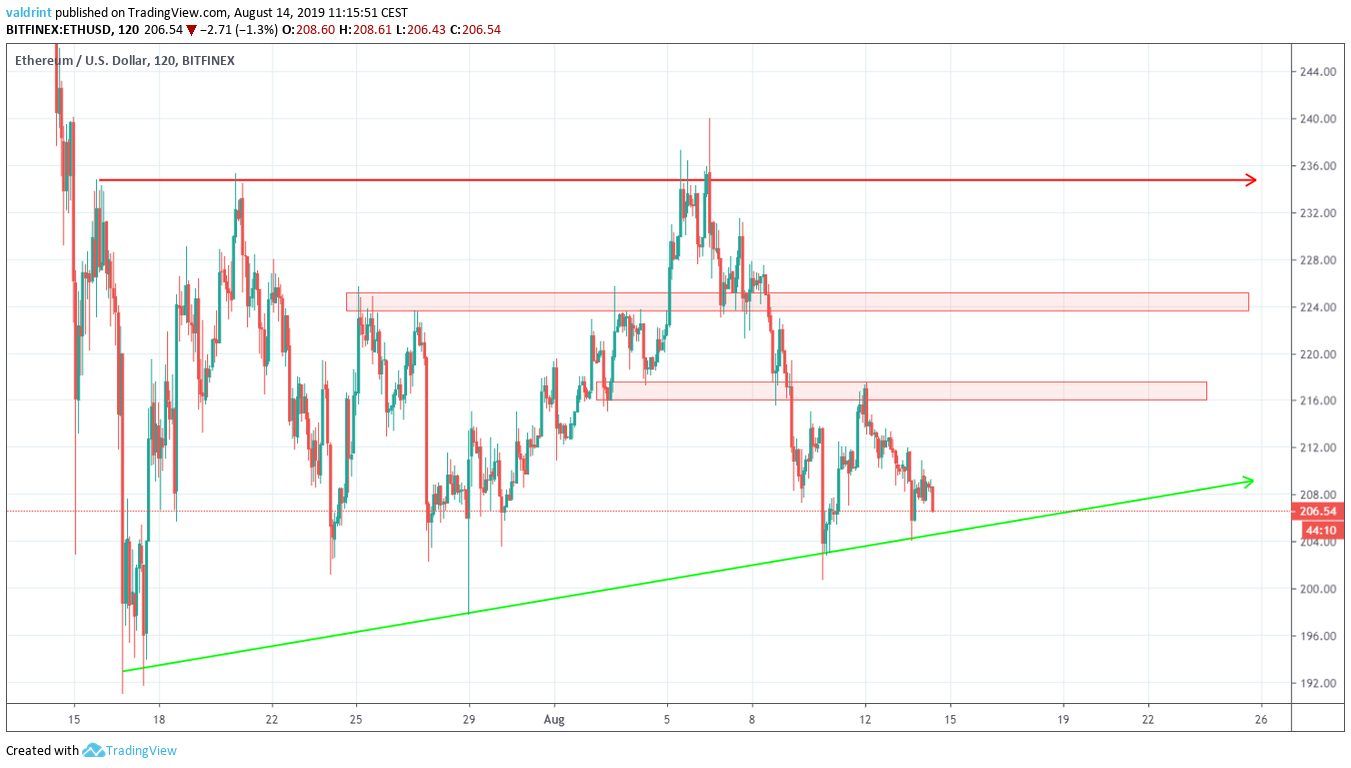
They are found at $216 and $224, respectively.
While we do not believe they will initiate a downward reversal, they should provide a short-term resistance to ETH before it reaches the resistance line at $235.
Ethereum Price Summary
The Ethereum price is trading inside an ascending triangle.
According to our analysis, it is likely to move towards the resistance line of the triangle.
Do you think Ethereum will reach the resistance line? Let us know in the comments below.
Disclaimer: This article is not trading advice and should not be construed as such. Always consult a trained financial professional before investing in cryptocurrencies, as the market is particularly volatile.
Images are courtesy of TradingView and Shutterstock.
