
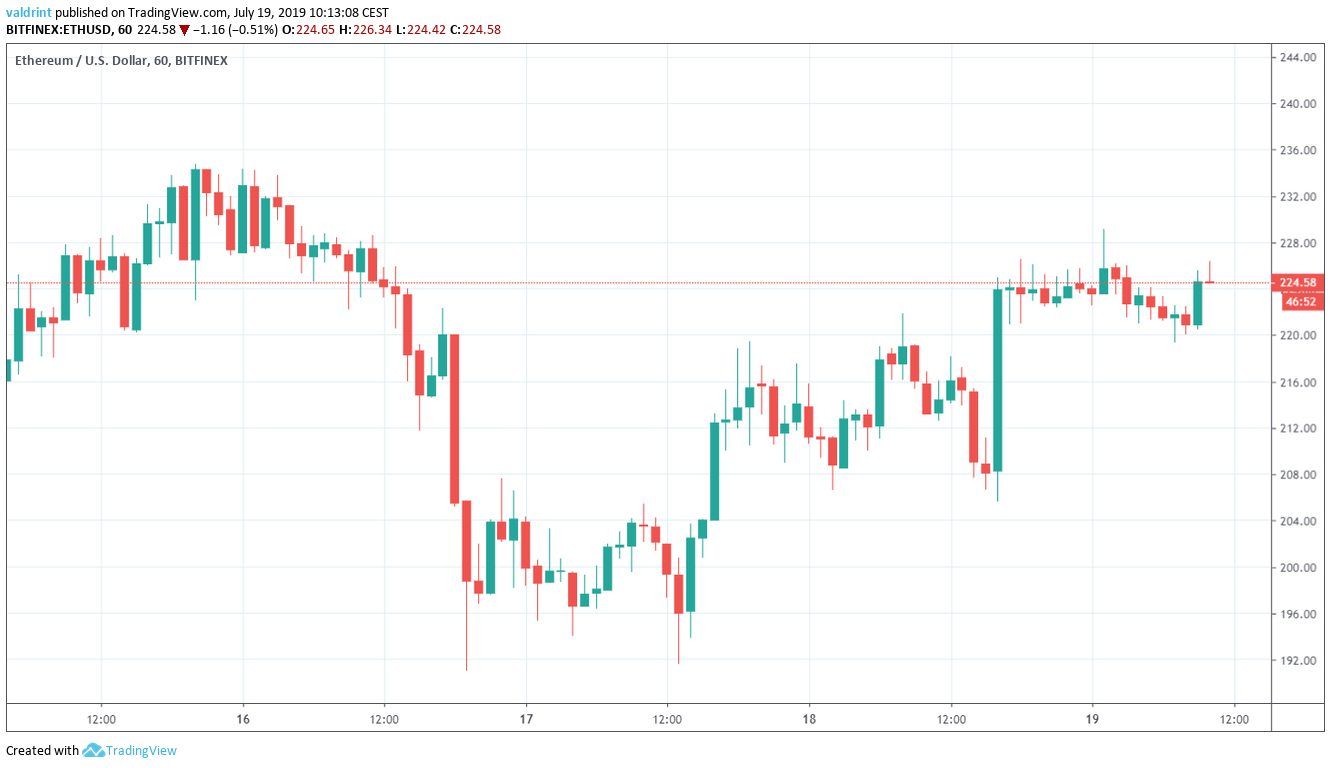
On July 15, 2019, the Ethereum price reached a high of $234,33. A decrease ensued. On July 17 and 18, the ETH price made a double bottom near $192, before beginning to increase.
How long will Ethereum continue to increase? Below, we are going to analyze the Ethereum price in different time-frames alongside technical indicators in order to answer this question.
For our previous analysis, click here.
If you are interested in trading Ethereum (ETH) with a multiplier of up to 100x on our new partner exchange with the lowest fees, follow this link to get a free StormGain account!
Ethereum Price: Trends and Highlights for July 19
- ETH/USD broke out from a descending resistance line.
- There is significant resistance near $230.
- Daily moving averages have made a bearish cross.
- ETH is following a long-term ascending support line.
- There is significant support at $160.
Previous ETH Price Movement
Since reaching a high on July 14, the Ethereum price has been following a descending resistance line.
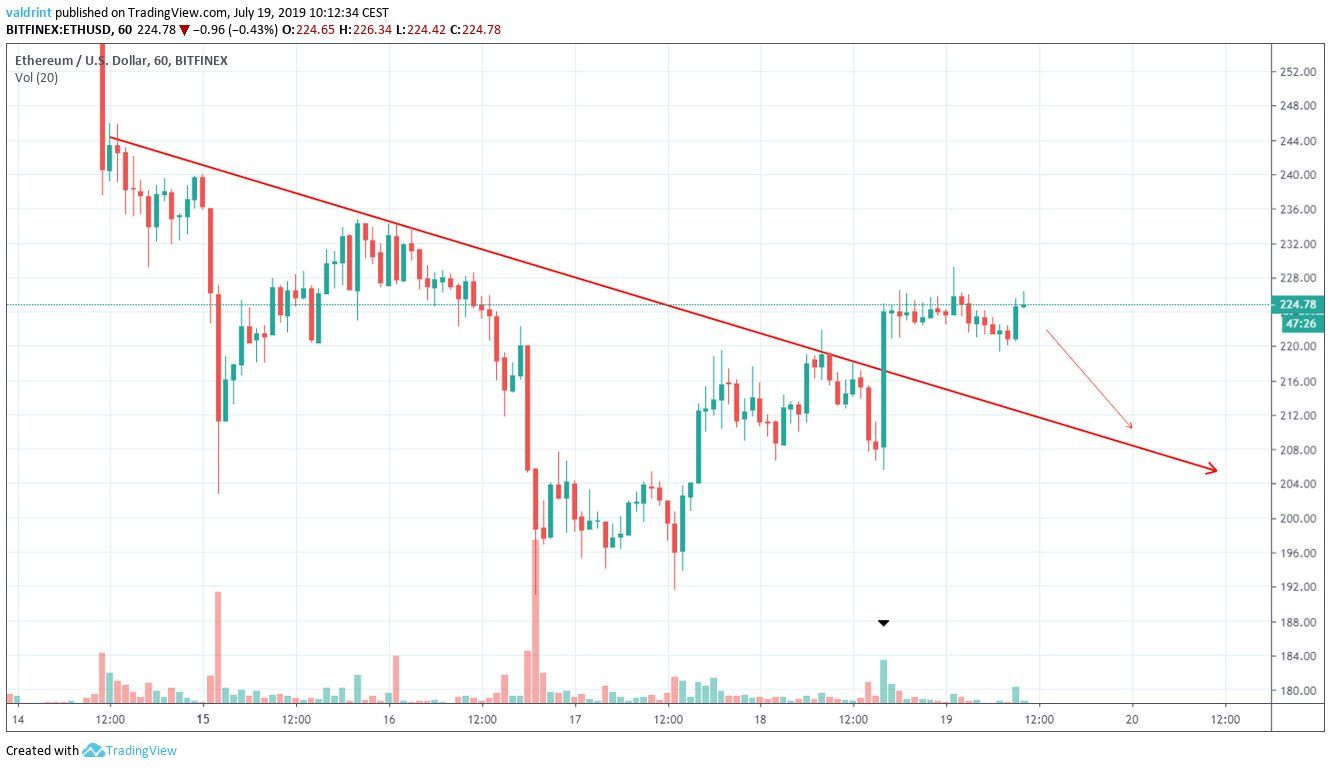
On July 18, it broke out above this line. The breakout transpired with slightly-above-average volume.
In these cases, it is customary for the price to fall back towards the resistance line before possibly resuming its upward movement.
Let’s see how likely that is.
Retracement Levels
A look at the daily time-frame shows that the ETH price is trading at a very important resistance area.
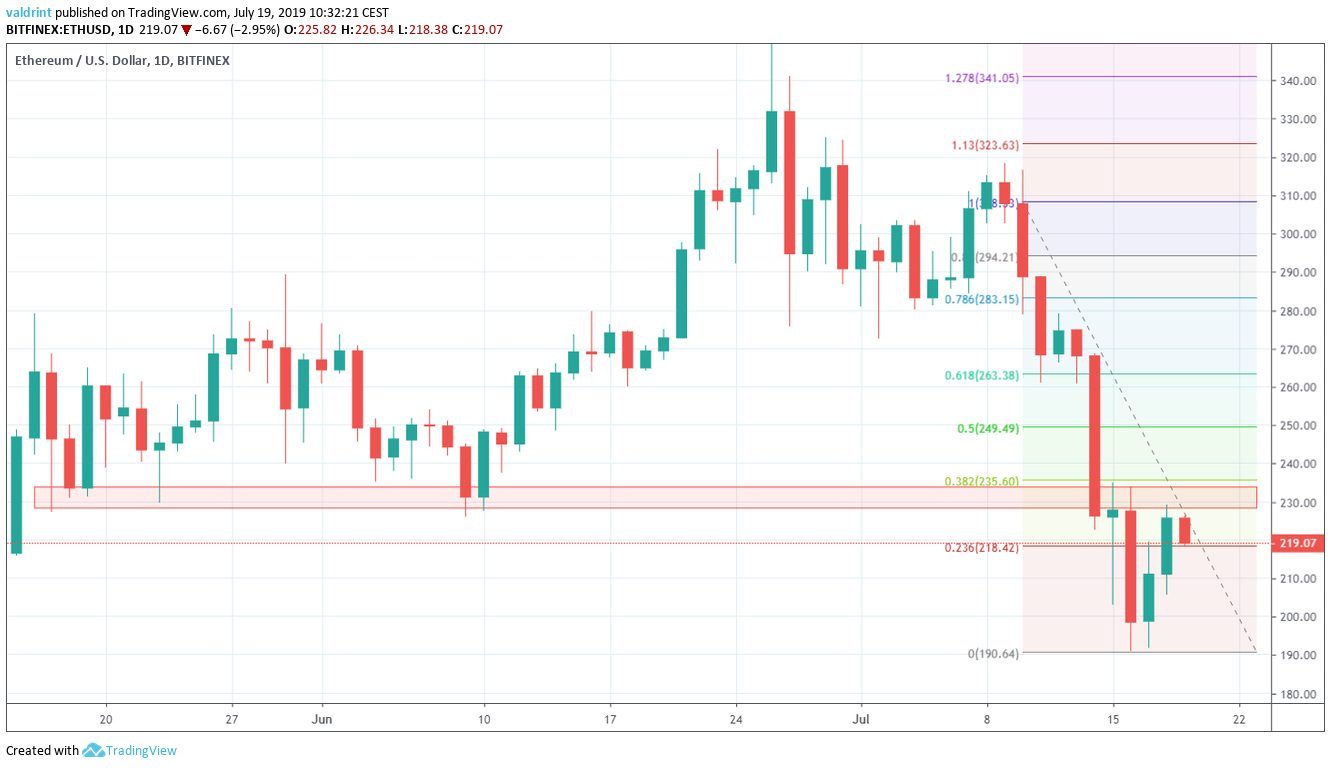
This resistance area is found near $230. It previously acted as support throughout May and June, before the Ethereum price broke down from it on July 13.
Furthermore, it coincides with the 0.382 fib area of the entire drop from around $230.
A look at the moving averages (MA) gives a similarly bearish outlook.
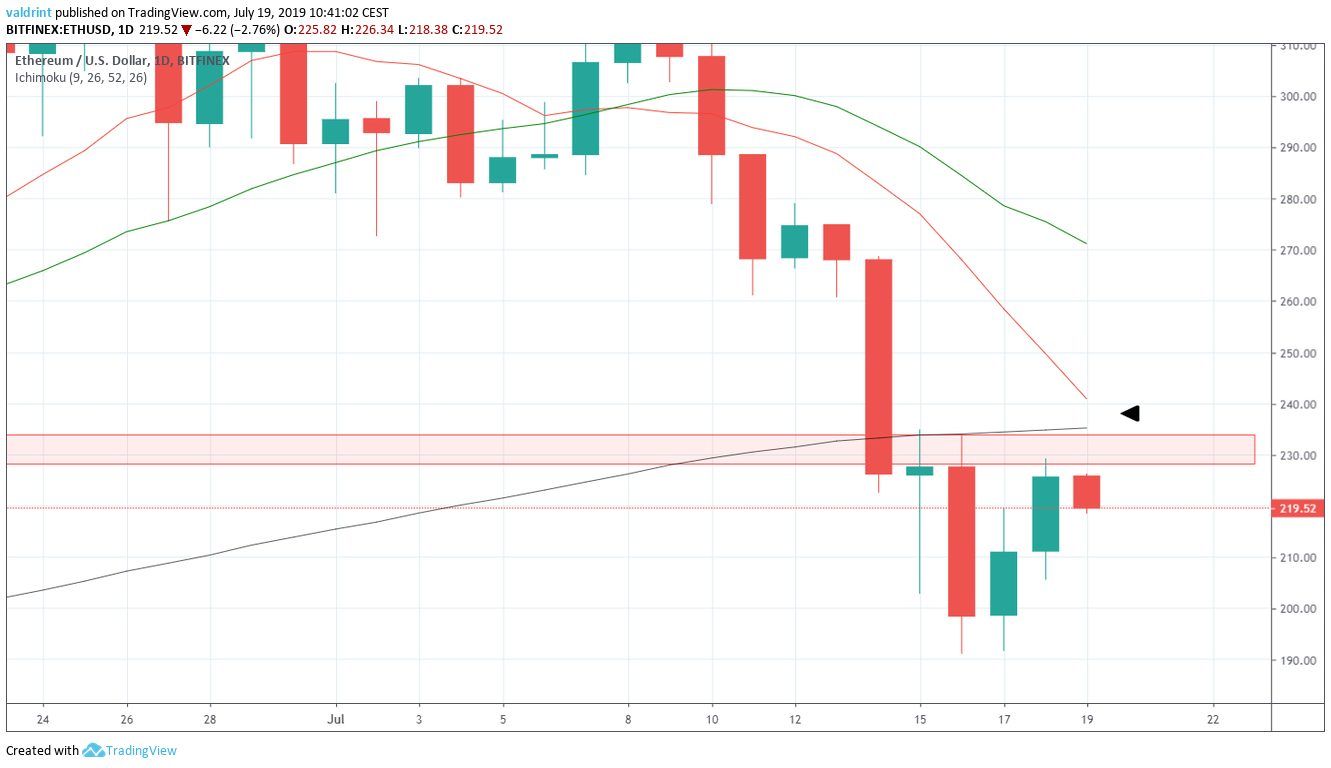
A bearish cross has already transpired between the 10- and 20-day MAs.
Additionally, the 10- and 100-day MAs are very close to making one. They are providing close resistance to the price and coincide with the previously mentioned resistance area.
While the RSI is at an oversold level, there is no divergence developing.
Therefore, we do not believe ETH will be successful in breaking out above the resistance area.
Support
Since reaching a low of $105 in February, the ETH price has been following an ascending support line.
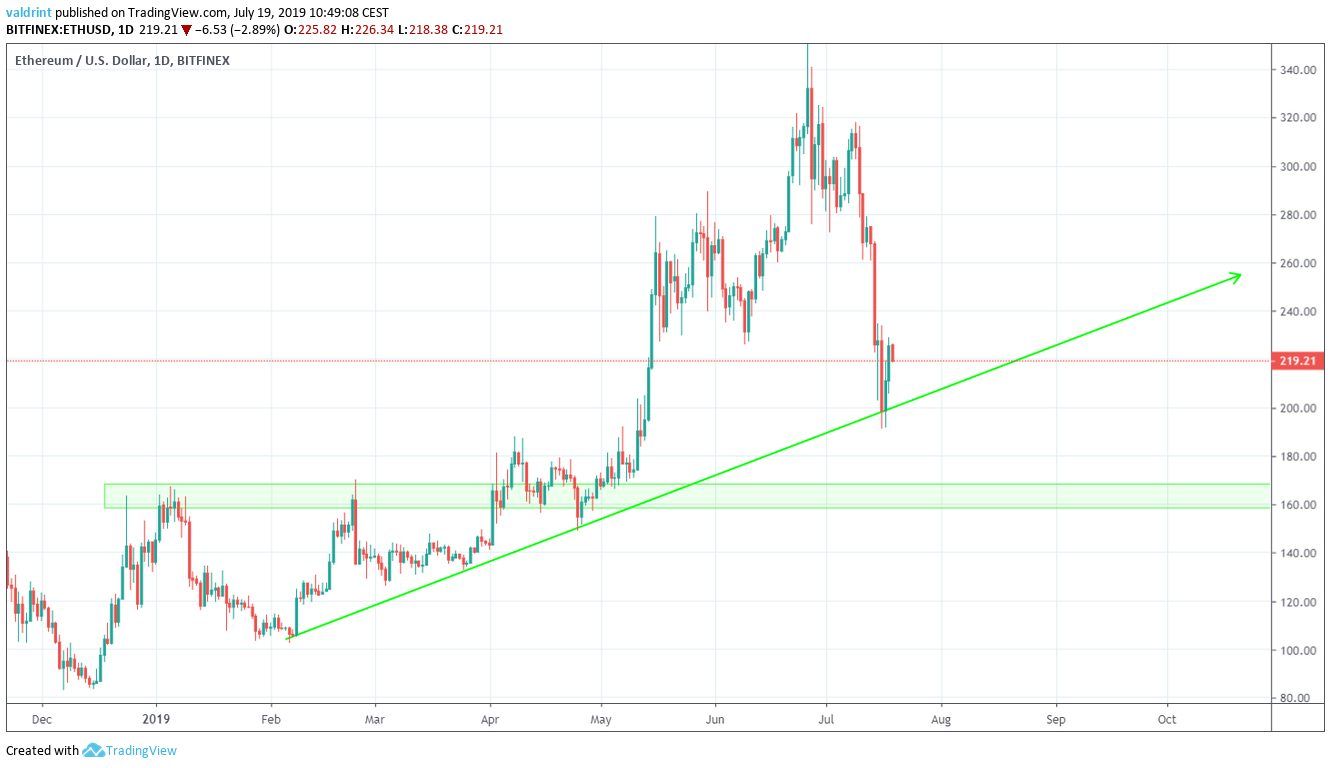
The Ethereum price touched this line for the fourth time on July 13.
Continuing the analysis from the previous section, it is likely that the price will eventually break down from this support.
If it does, the next significant support area will be found near $160.
While the decrease may not be immediate, we believe that the price will eventually reach this area.
Summary
The Ethereum price recently broke out from a short-term resistance line.
According to our analysis, the increase will be short-lived.
Ethereum is likely to break down from its current support and reach the support area outlined above.
Do you think Ethereum will break down from the support line? Let us know in the comments below.
