
On June 26, 2019, the Ethereum price reached a high of $363. A decrease ensued, which intensified on July 10. By July 15, the ETH price had reached lows close to $200.
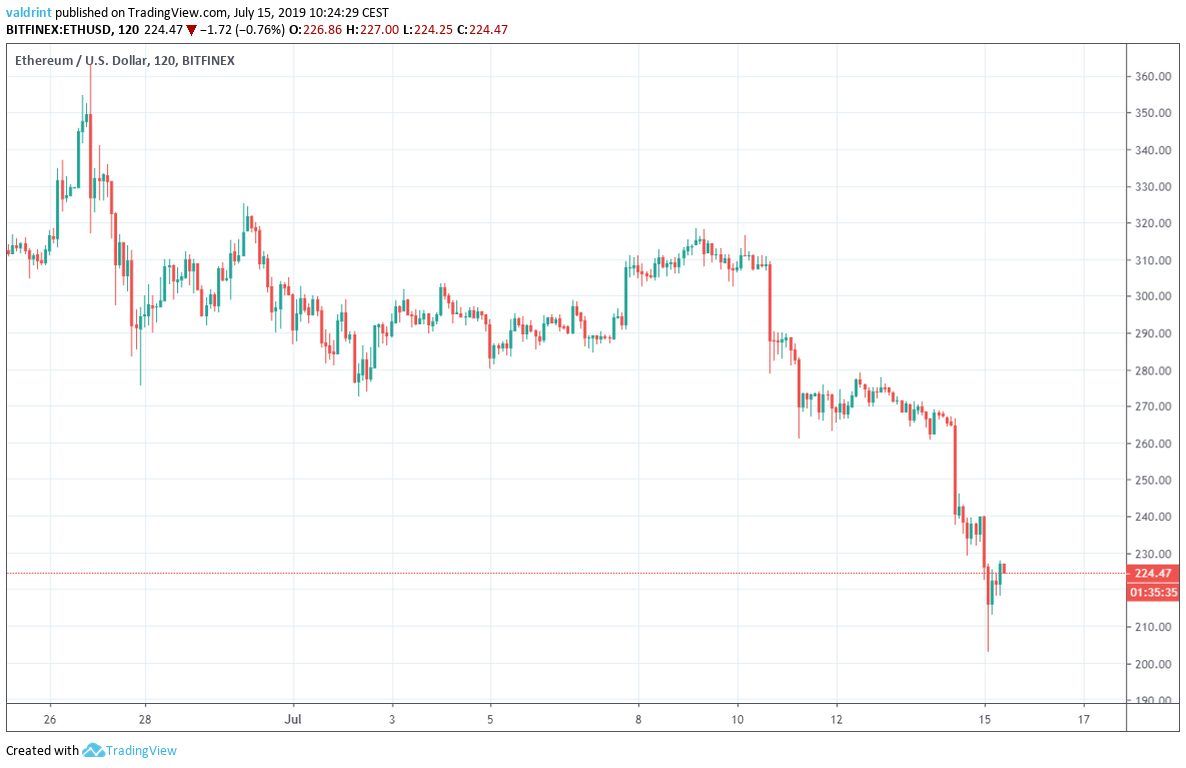
How long will this decrease continue? In this analysis, we will look at the ETH price in different time-frames alongside technical indicators in order to answer this question.
For our previous analysis, click here.
Ethereum Price: Trends and Highlights for July 15
- Ethereum is following an ascending support line.
- There is strong support near $160.
- Moving averages are bearish.
- There bullish divergence developing in the RSI up to 2-hour time-frames.
- There is resistance near $260.
ETH Price Support
A look at the daily chart shows that, since February 2019, ETH has been following the ascending support line outlined below.
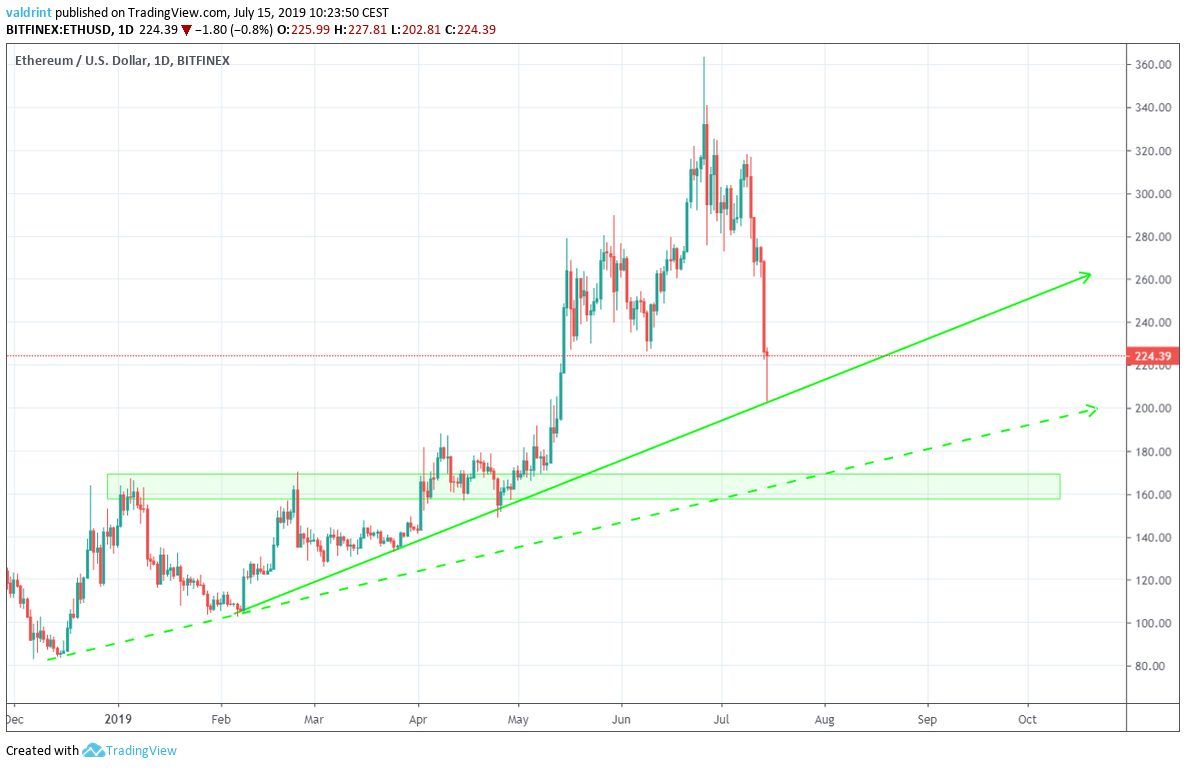
On July 15, it touched the line for the fourth time before bouncing. It created a long lower wick, which created a hammer candlestick.
If the support line fails to hold the ETH price, there is another one below it.
At the time of writing, it coincided with the significant support area at $160, created by the highs of Jan and Feb 2019.
Let’s take a look at some technical indicators and see if the price is likely to reach it.
Technical Indicators
A look at the daily time-frame shows that the 10- and 20-day moving averages (MAs) made a bearish cross on July 8.
Since then, the Ethereum price has been trading below both of them — facing very close resistance from the 10-day one.
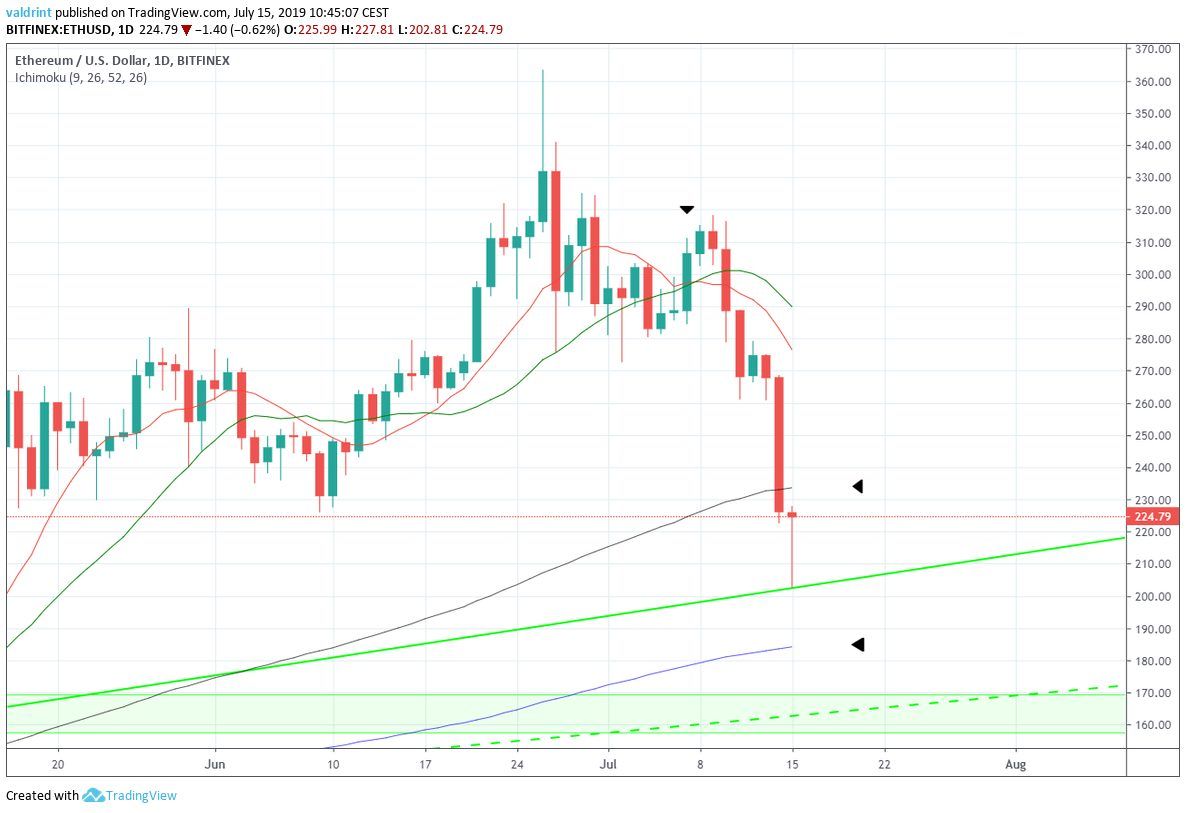
During the most recent drop, the ETH price did not react at all to the 100-day MA.
Rather, it continued its decrease until it reached the support line.
However, it is still above the 200-day MA.
As stated above, the current daily candle is shaping up to be a hammer. When found in a downtrend, it often indicates that a reversal may soon begin.
This is identified by the long lower wick that suggests that there is buying strength.
A look at the RSI also supports the beginning of an upward move.
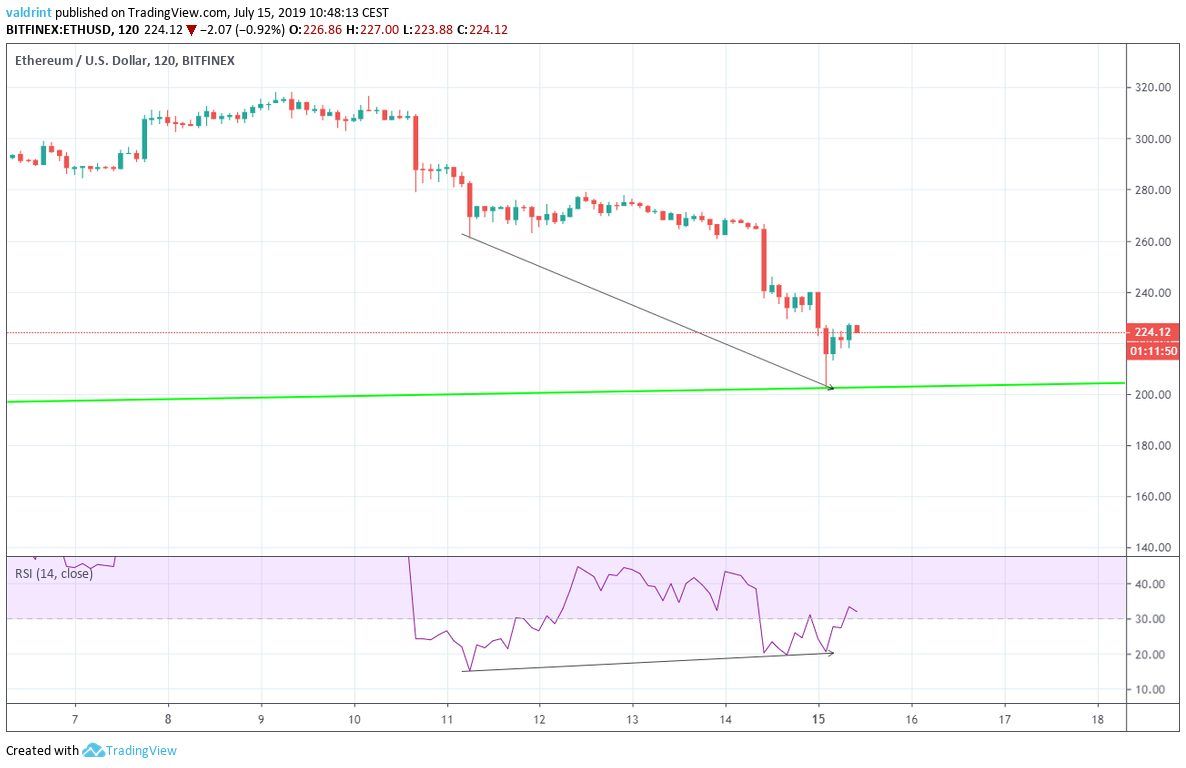
It has been generating significant bullish divergence since July 11.
Furthermore, this divergence is occurring right on the ascending support line.
The use of these indicators and price movement makes it likely that the Ethereum price will begin an upward move.
If it does, there is significant resistance above it.
Let’s see where that is.
Possible Reversal
In order to predict possible reversal areas if an upward move begins, we have used the Fibonacci retracement tool beginning from $310, the starting point of the rapid decrease.
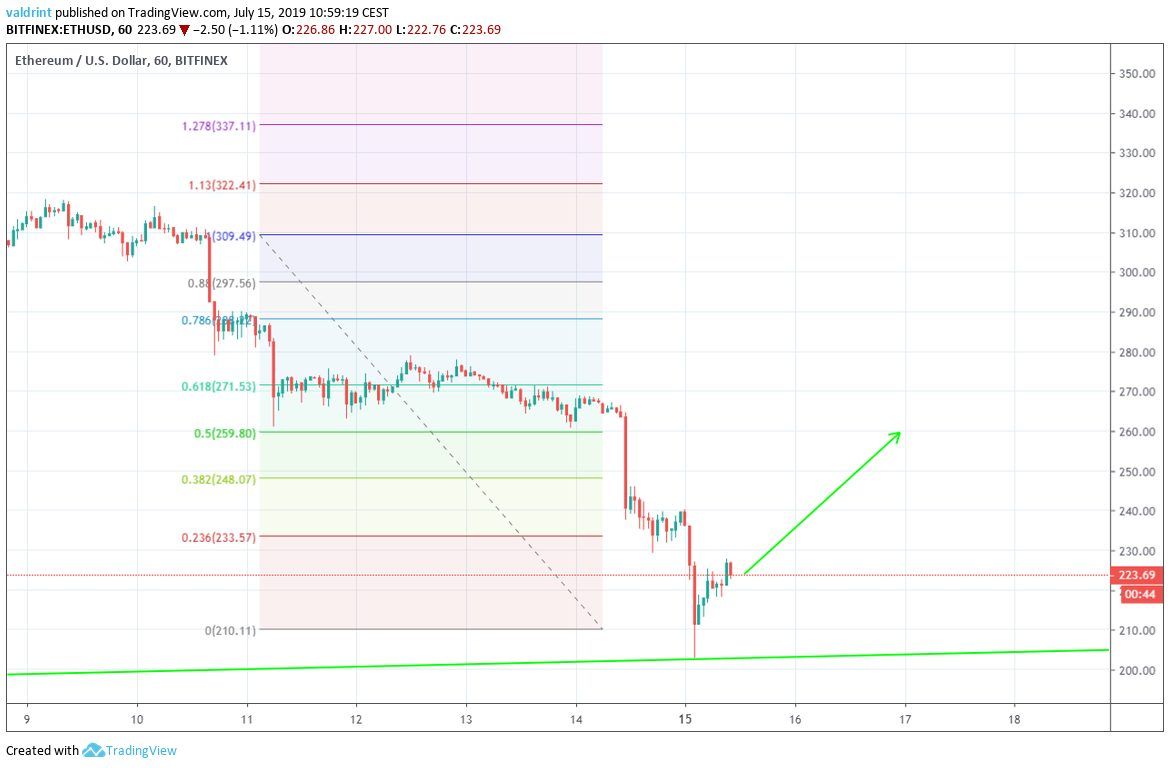
The closest resistance area is found between $250-$260.
It is created by the 0.5 and 0.618 fib levels and previous trading range.
According to our analysis, it is likely that the Ethereum price will reach this area.
Summary
The Ethereum price has been decreasing rapidly for the past two weeks.
Moving averages support a continued decrease.
However, the price is likely to initiate a bounce before resuming its downward movement.
However, since the ETH price usually follows Bitcoin during rapid decreases, a decrease in the Bitcoin (BTC) price would likely cause the same for ETH.
Do you think the Ethereum price will initiate a bounce? Let us know in the comments below.
Disclaimer: This article is not trading advice and should not be construed as such. Always consult a trained financial professional before investing in cryptocurrencies, as the market is particularly volatile.
Images are courtesy of Shutterstock, TradingView.
