


On June 26, 2019, the Ethereum price reached a high of $363.3. A rapid decrease ensued. The price of ETH reached lows below $285 the next day.
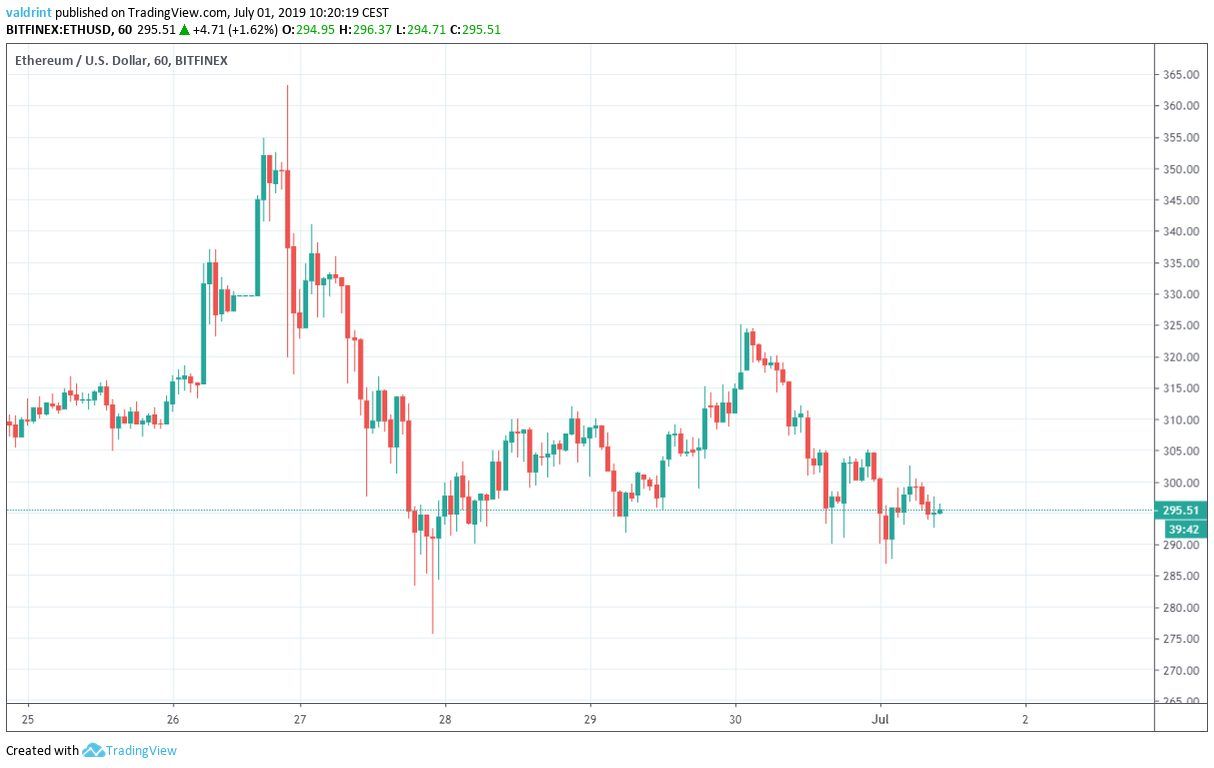
After a small increase, the Ethereum price dropped to the same level on June 1.
Where will ETH go next? Keep reading below and find out.
For our previous analysis, click here.
If you’re interested in trading Ethereum (ETH) on our partner exchange, follow this link to get all set up on XCOEX.
Ethereum Price: Trends and Highlights for June 1
- ETH/USD is trading inside a short-term descending triangle.
- The Ethereum price is trading inside a long-term ascending wedge.
- There is bearish divergence developing in the RSI and the MACD.
- The moving averages are undecided.
- The price reached a strong resistance in the weekly time-frame.
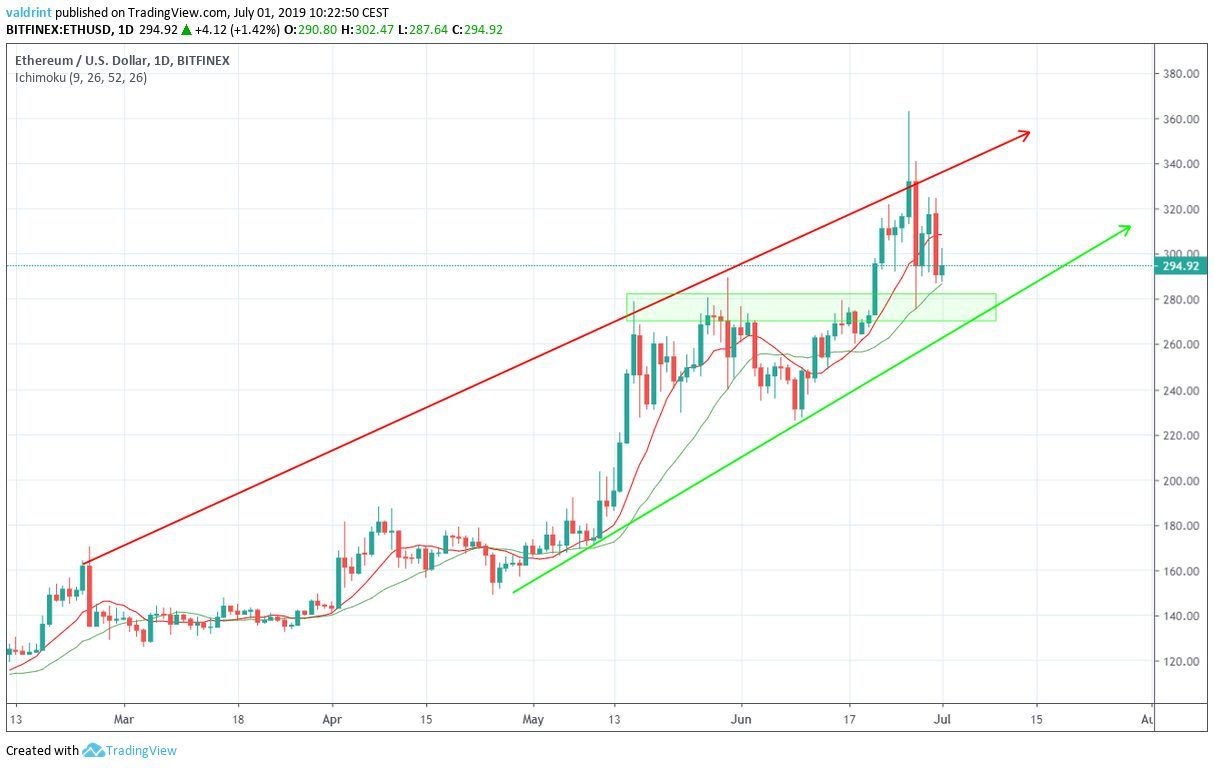
Ethereum Price in a Short-Term Triangle
The descending triangle is a bearish pattern, making a price breakdown more likely.
Let’s take a look at a longer time-frame in order to see if that is likely.
Ascending Wedge
Since reaching a high of $160 on Feb 23, the ETH price has been trading inside the ascending wedge outlined below.
Similar to the descending triangle, the ascending wedge is a bearish pattern, making price breakdowns more likely.
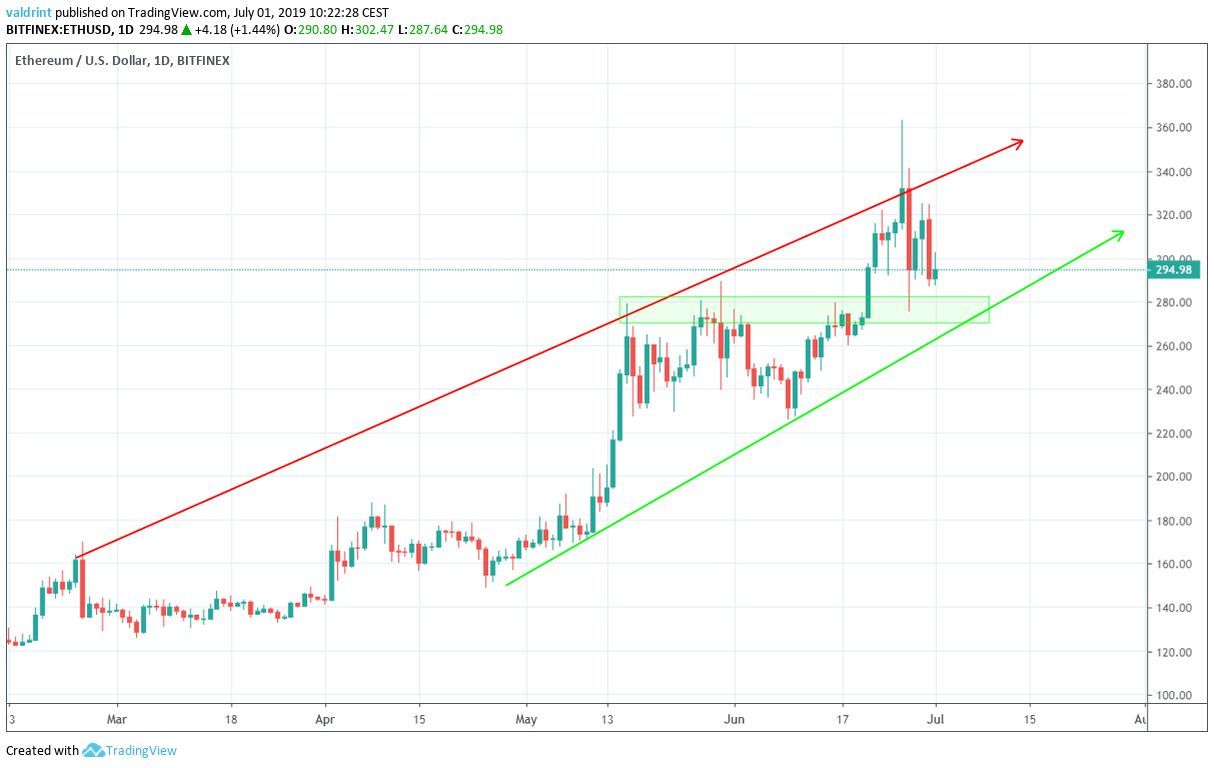
A breakdown from the triangle in the previous section would likely take the Ethereum price to the lower limits of the support area near $270.
Furthermore, this coincides with the ascending support line of the wedge. Therefore, it is likely that it will not allow the ETH price to immediately drop below it.
Technical Indicators
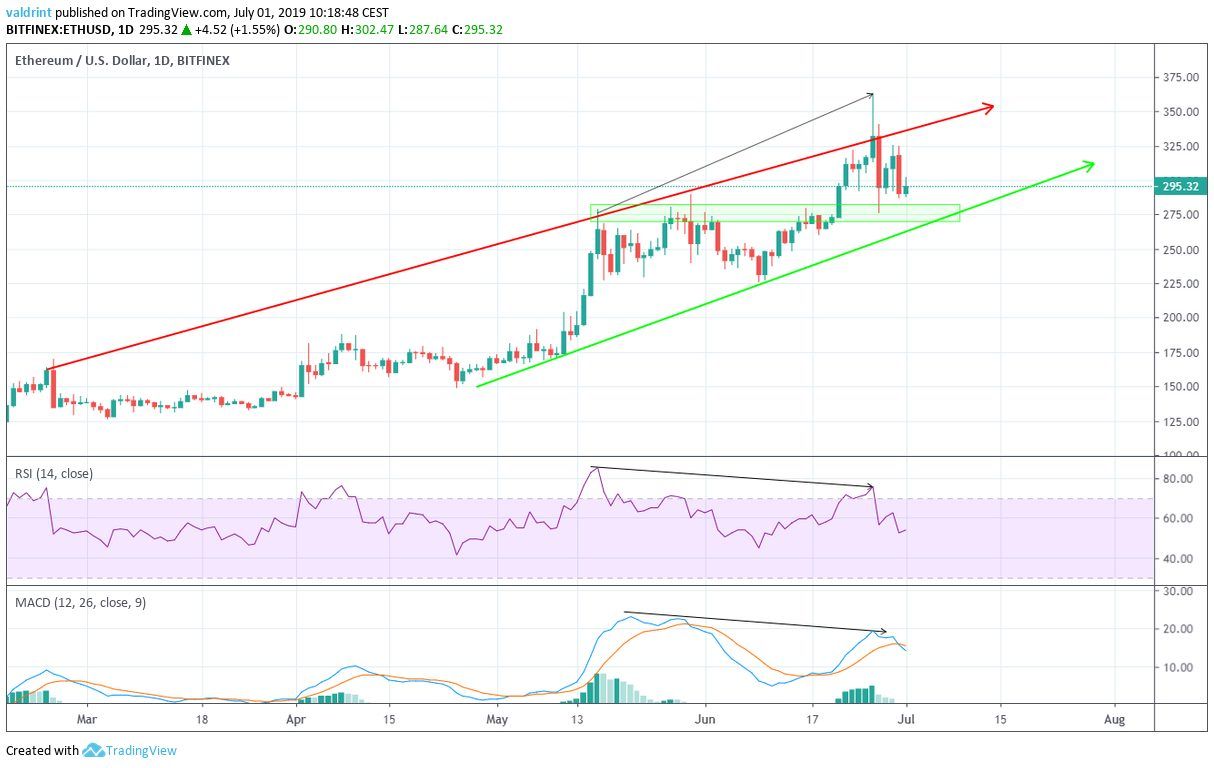
The divergence is very significant in value. Furthermore, it is occurring in both indicators and close to the resistance line of a bearish pattern.
The moving averages, however, have yet to turn bearish.
The decrease on June 20 took the ETH price below the 10-day MA. However, the price found support above the 20-day one, which coincides with our support area.
While the 10-day MA has begun to turn downward, a bearish cross has yet to occur. If it were to do so, it would be a likely sign that a downtrend has begun.
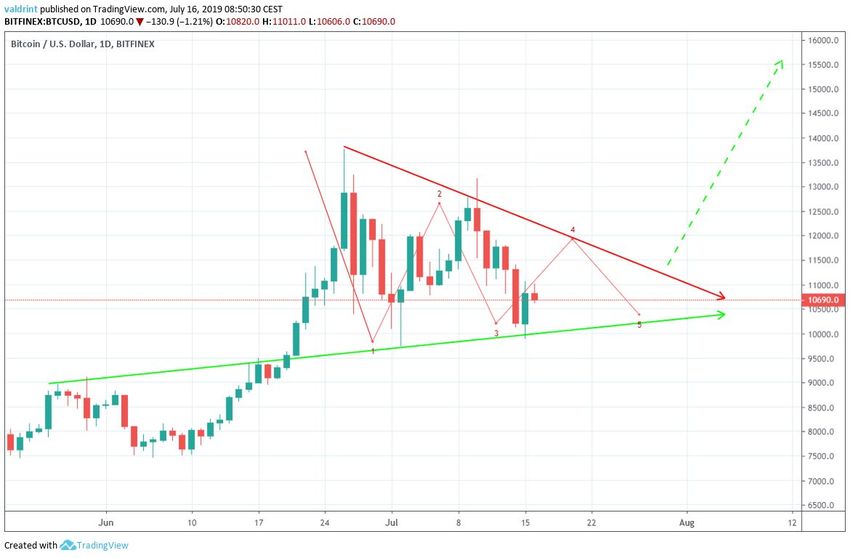
Weekly Resistance
In a weekly time-frame, we can see that the price has not yet retraced to the 0.236 fib level of the entire drop measuring from January 2018.
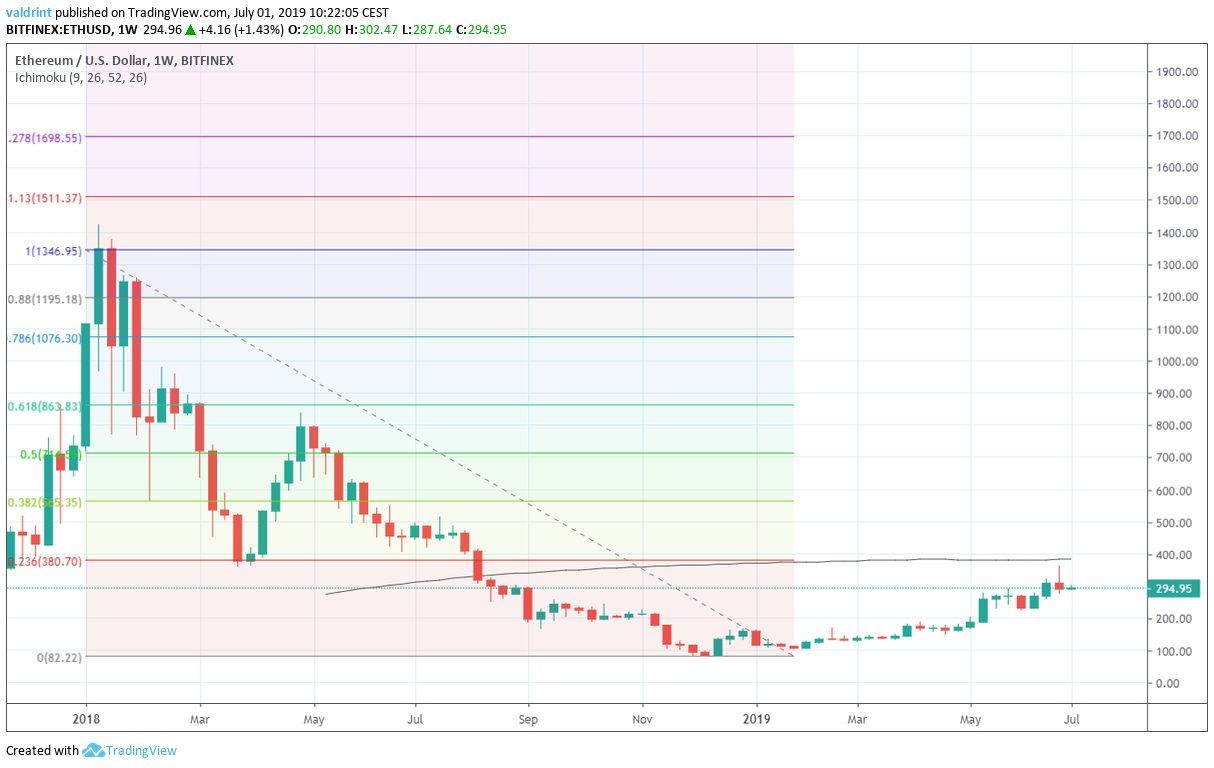
Furthermore, the fib level coincides with the 100-week MA.
After reaching the MA last week, the price retraced sharply, creating a bearish doji candle in the process.
This significant resistance level makes it unlikely that the price will move above it.
Summary
The price of Ethereum has been decreasing since reaching a high on June 26. It is trading in bearish patterns in both the short and the long-term.
According to our analysis, it is likely to initiate a short-term drop, before continuing to trade inside the ascending wedge.
An eventual breakdown from the wedge is likely in the future.
Do you think the Ethereum price will break down from the triangle? Let us know your thoughts in the comments below.
Disclaimer: This article is not trading advice and should not be construed as such. Always consult a trained financial professional before investing in cryptocurrencies, as the market is particularly volatile.
Images are courtesy of TradingView.


