
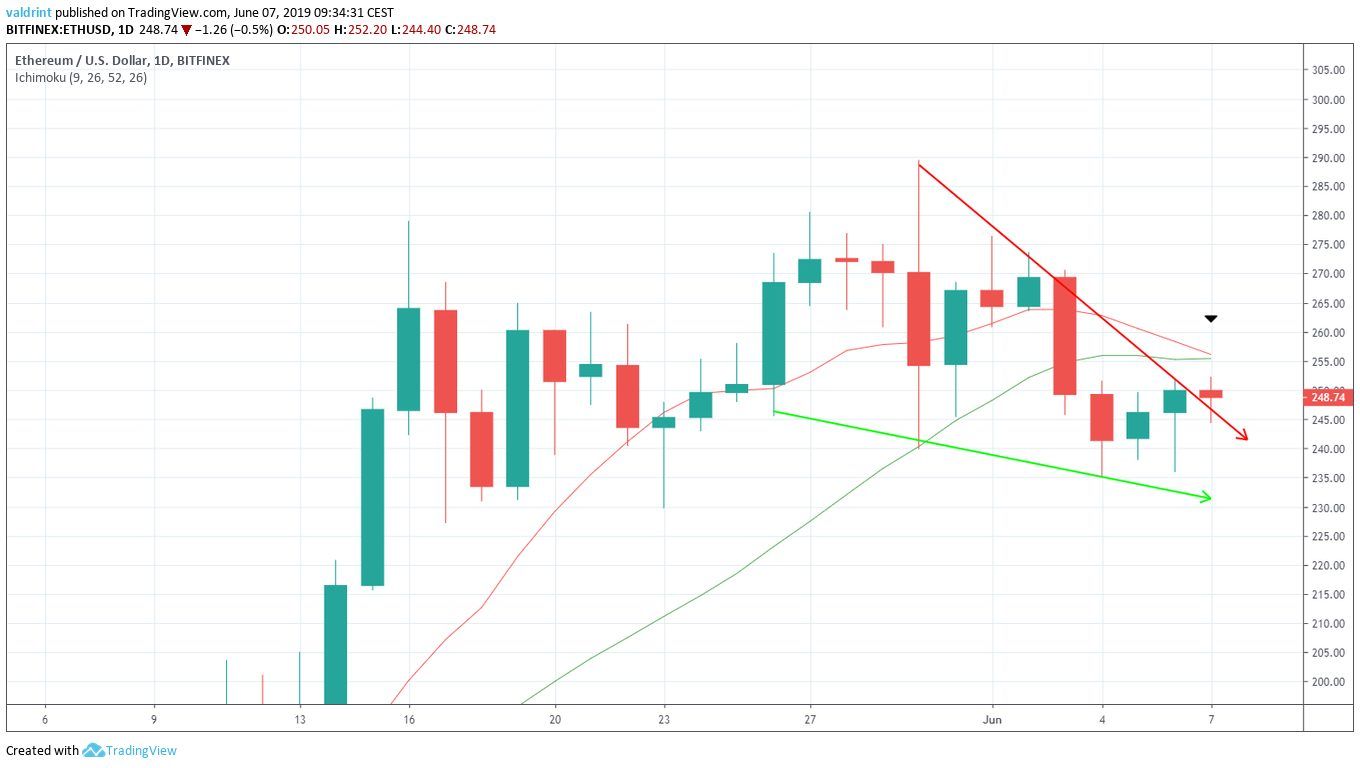
On May 30, the Ethereum price reached a high of $289.42. A rapid decrease was followed by a gradual increase. A high slightly above $272 was reached on Jun 2. Since then, the ETH price has been on a downward trend.
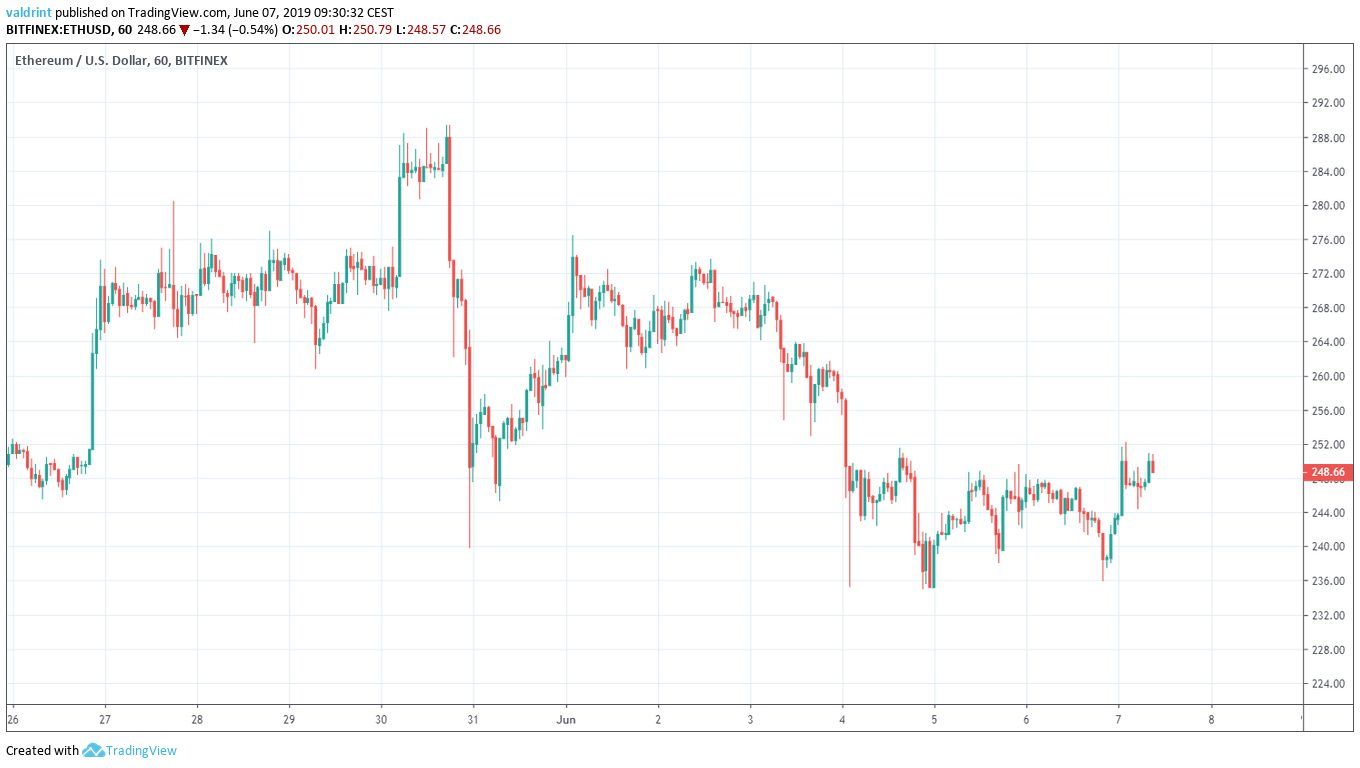
Three lows near $236 were reached on June 4, 5 and 6.
Below, we are going to analyze the Ethereum price in different time-frames, alongside technical indicators, in order to try and predict future movement.
Ethereum Price (ETH): Trends and Highlights for June 7
- The Ethereum price reached a high of $289 on May 30.
- It is trading inside a descending wedge and a short-term horizontal channel.
- The moving averages are very close to making a bearish cross.
- There is support near $230.
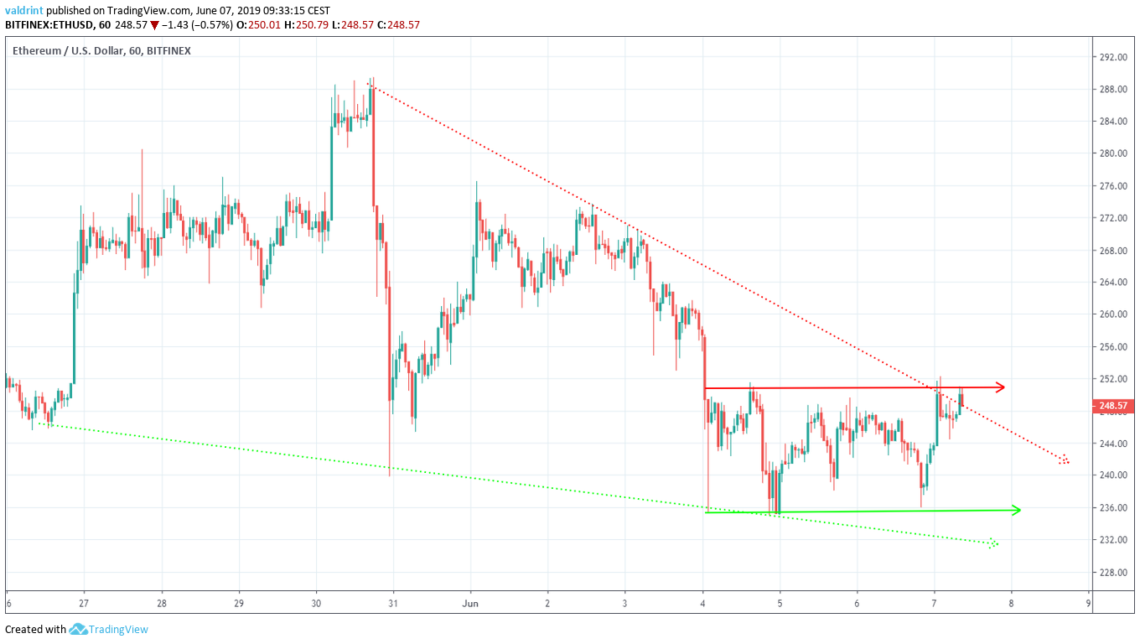
ETH Price: Horizontal channel
On Jun 4, ETH/USD reached a low of $225.22. A gradual upward move ensued and the ETH price reached a high of $251.51 the same day. Since then, it has been trading between these two levels, creating the horizontal channel outlined below:
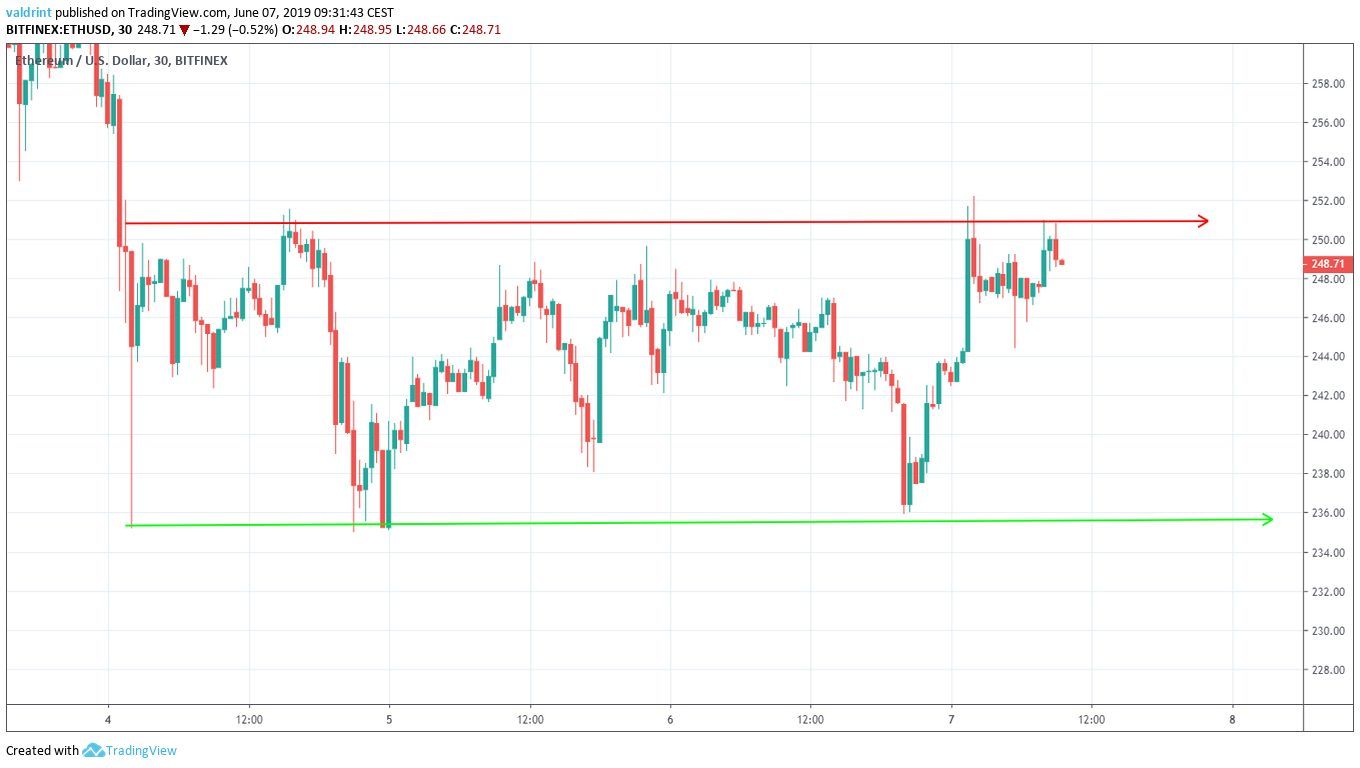
At the time of writing, the Ethereum price was trading close to the resistance line of the channel.
Furthermore, this resistance line coincides with the resistance of the slightly longer-term descending wedge it has been trading in since May 30.
Will the ETH price break out or are there more decreases in store?
A look at technical indicators is required in order to answer that question.
Ethereum Price: RSI and Moving Averages
The Ethereum price is analyzed alongside the RSI below:
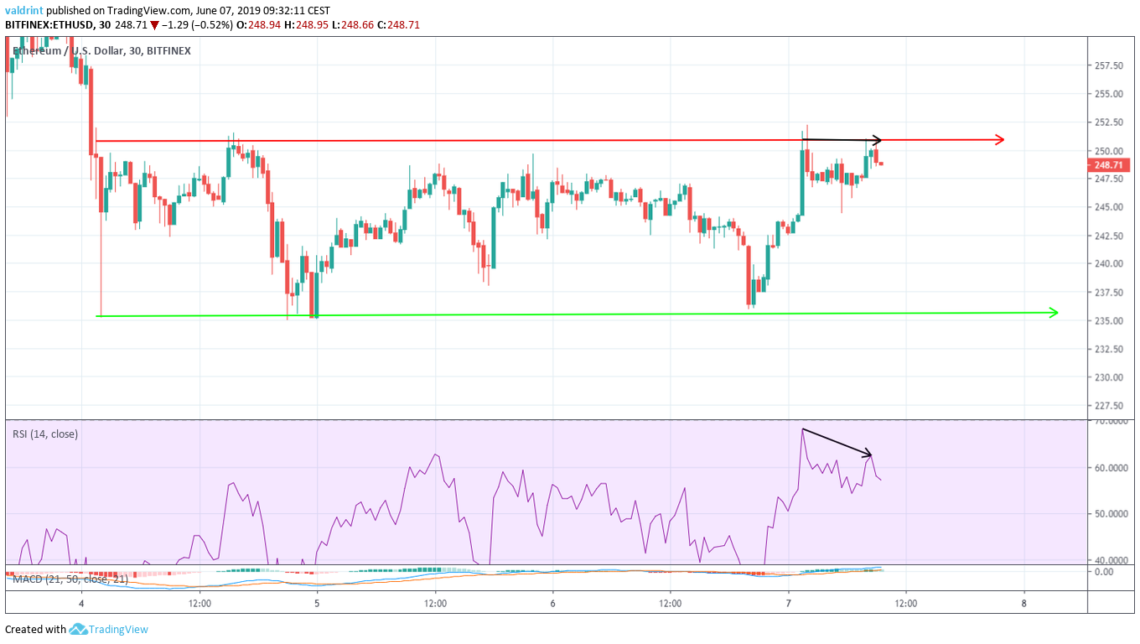
On Jun 7, the ETH price made two highs near $251. During the same time, the RSI generated lower values.
This is known as bearish divergence and often precedes price decreases. Furthermore, it is occurring in a double top, which is a bearish reversal pattern.
However, the divergence is only present in very short-term time-frames.
Therefore, we have outlined the price alongside the 10- and 20-day moving averages (MA) below:
The Ethereum price is trading below the 10- and 20-day MAs, which are providing resistance to the price.
Furthermore, they are very close to making a bearish cross.
The use of these indicators makes it unlikely that the price will break out of the wedge. A decrease is likely.
Where will the price find support?
Reversal Areas
A support area is traced for ETH/USD below:
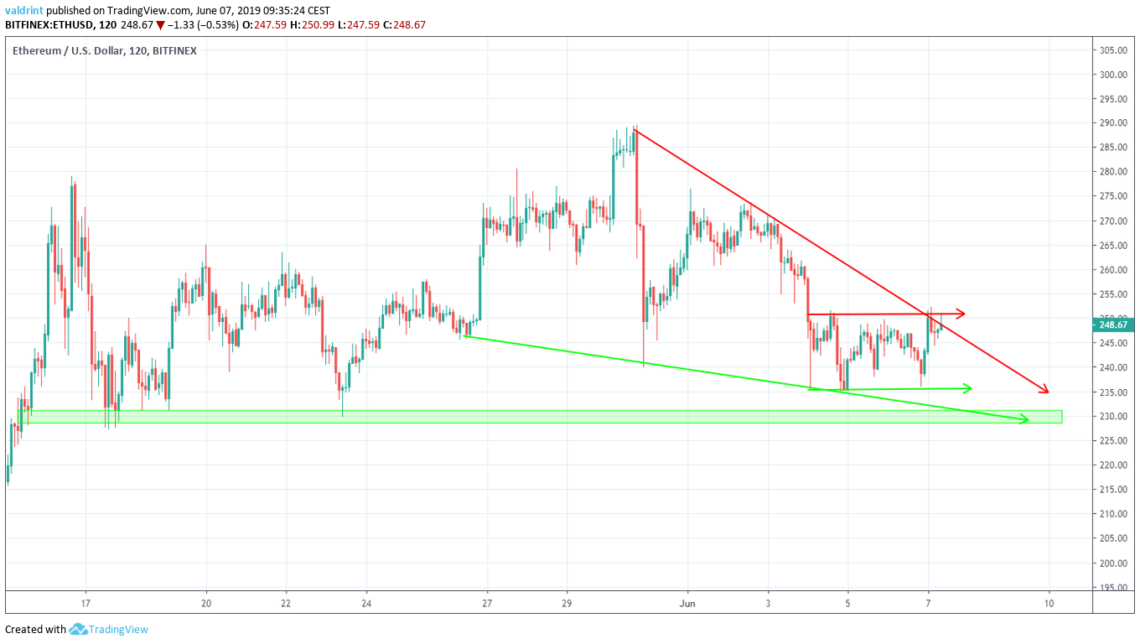
The closest support area is found near $230. If the ETH price continues to decrease at the rate predicted by the wedge, it should reach this area on Jun 8-10.
Summary
To conclude, the price of Ethereum (ETH) has recently experienced significant decreases. It is currently trading in a short-term horizontal channel and a longer-term descending wedge. The technical indicators make a breakout unlikely.
What do you think about the future outlook for the price of Ethereum (ETH)? Let us know your thoughts in the comments below!
Disclaimer: This article is not trading advice and should not be construed as such. Always consult a trained financial professional before investing in cryptocurrencies, as the market is particularly volatile.
