


On May 30, the Ethereum price reached a high of $289.42. A rapid decrease was followed by a gradual increase. A high near $272 was reached on Jun 2. Since then, the ETH price has been decreasing.
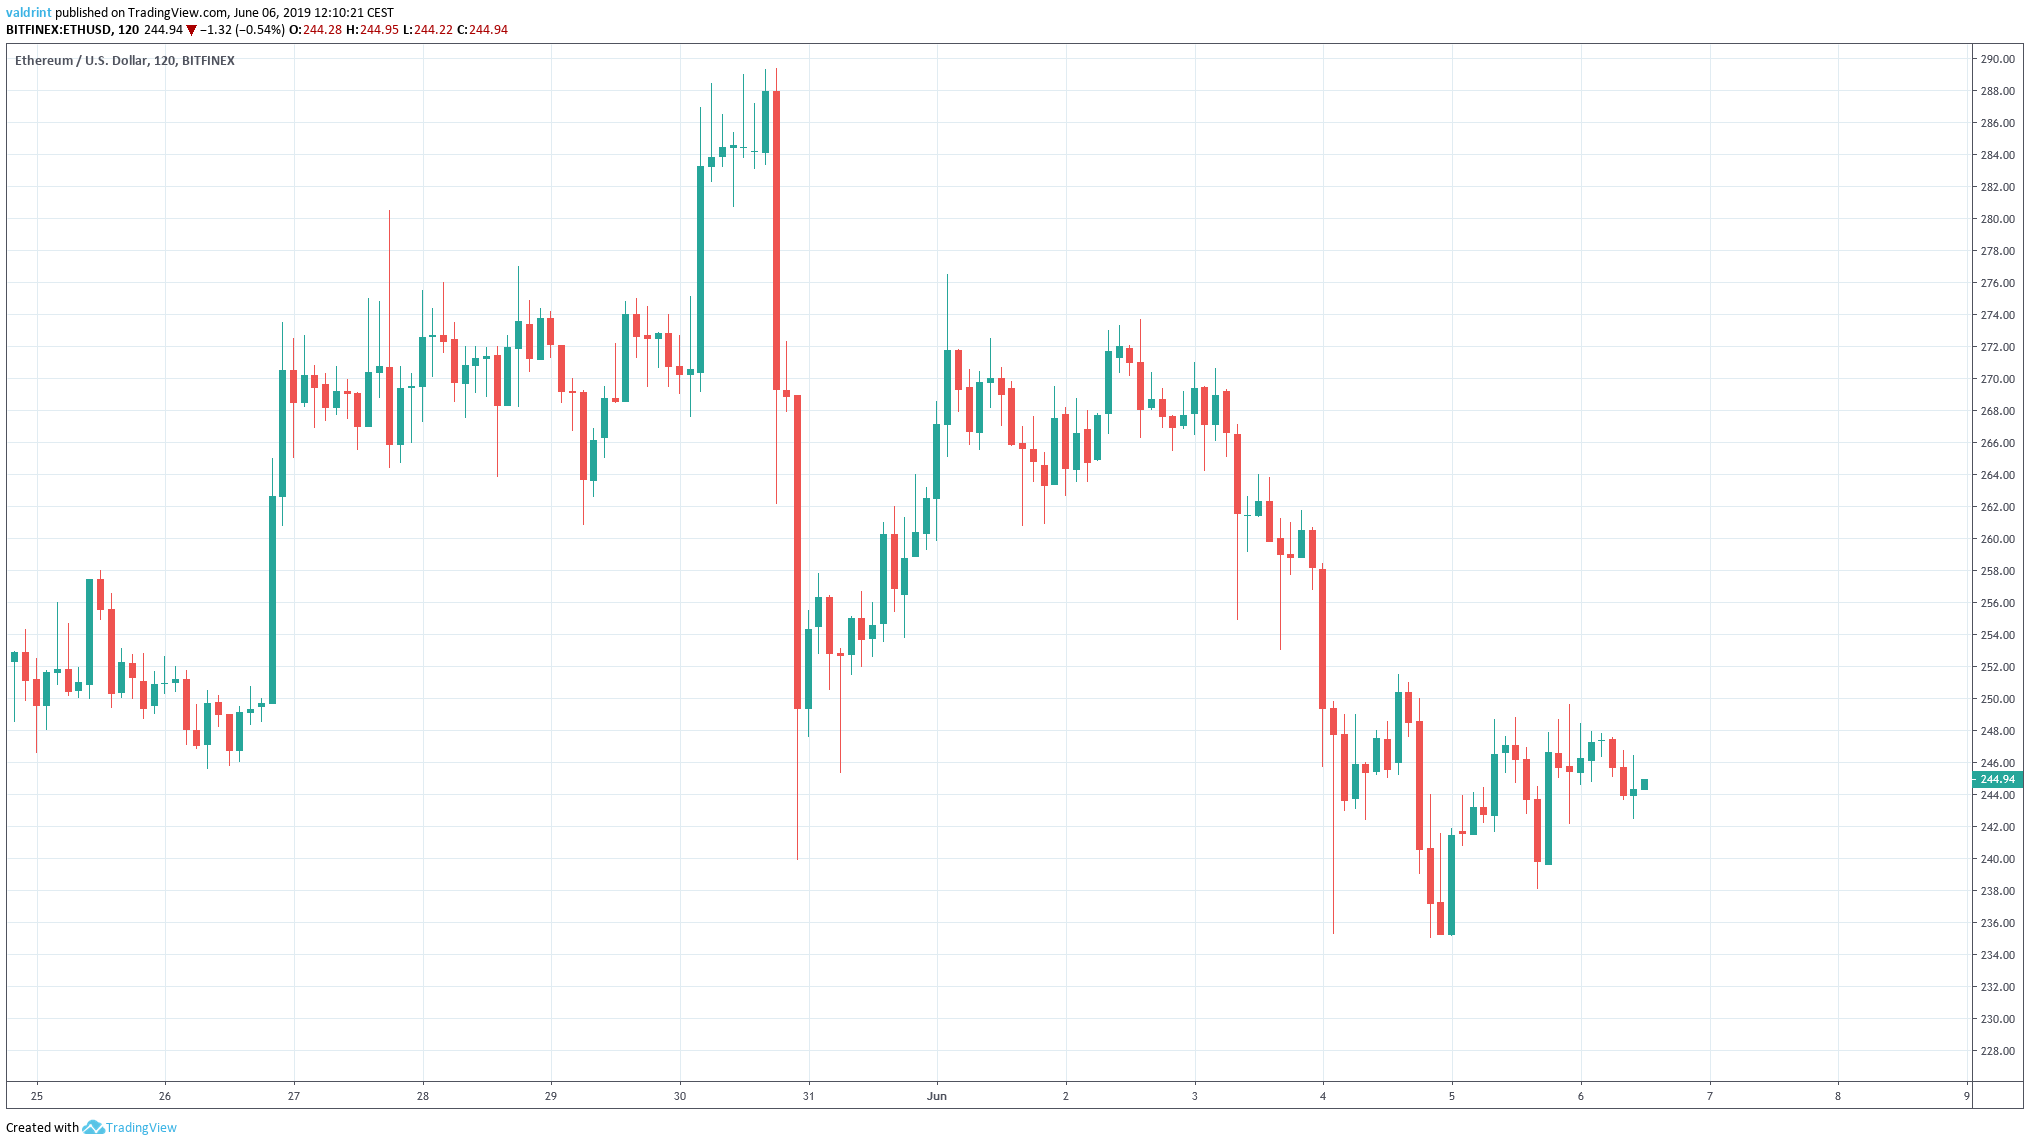
Lows below $240 were reached on Jun 5, before a short-term upward move began.
Where will the Ethereum price head to next? Keep scrolling in order to find out.
Ethereum Price (ETH): Trends and Highlights for June 6
- The Ethereum price reached a high of $289 on May 30.
- It is trading inside a descending wedge and a short-term symmetrical triangle.
- The moving averages have made a bearish cross
- There is bearish divergence developing in the RSI.
- There is support near $230.
- There is resistance near $265.
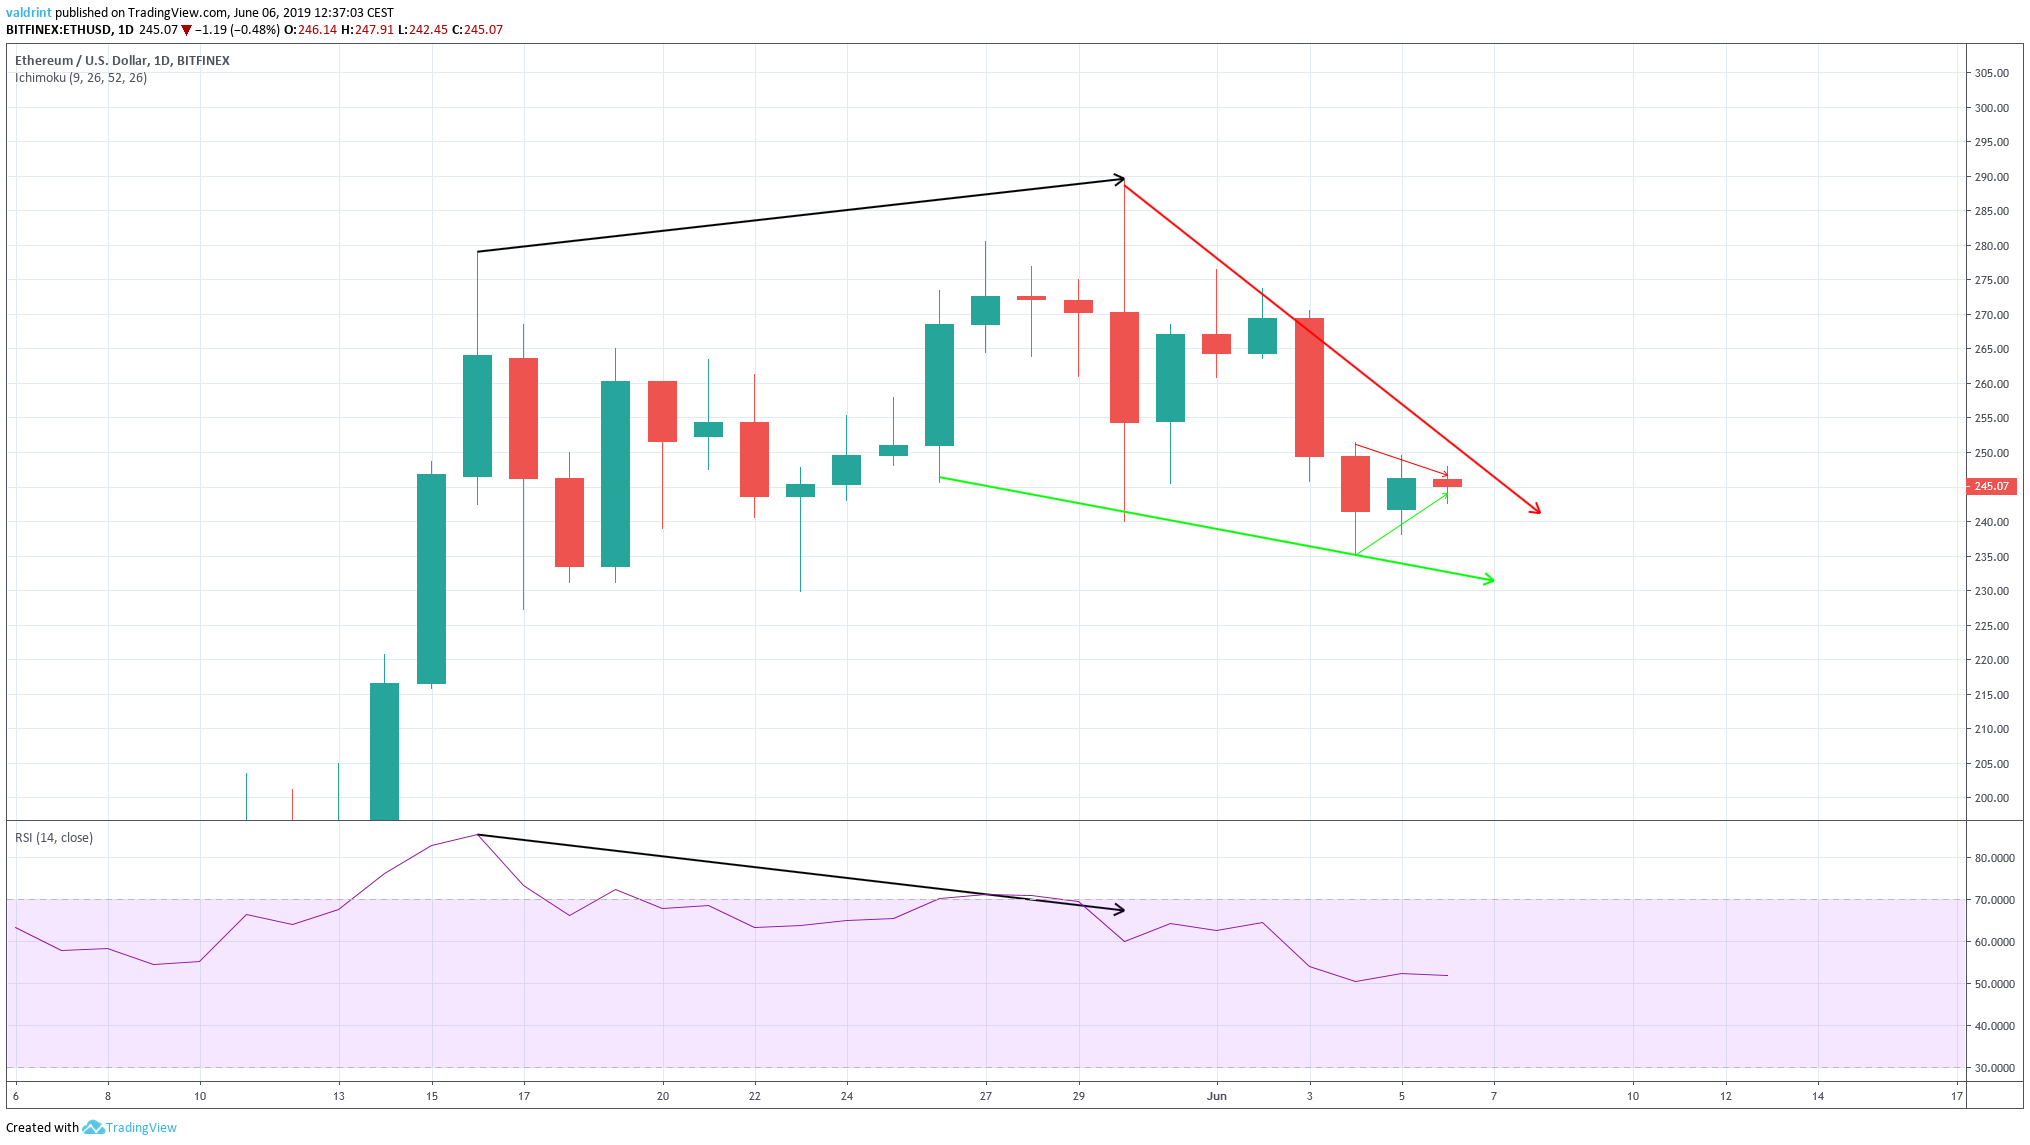
ETH Price: Descending Wedge
On May 26, ETH/USD reached a low of $245.55. A gradual upward move ensued and the ETH price reached a high of $289.42 on May 30. A rapid decrease ensued.
Several market cycles have been completed and the price has reached several lower highs and lows. Tracing them gives us a descending wedge:
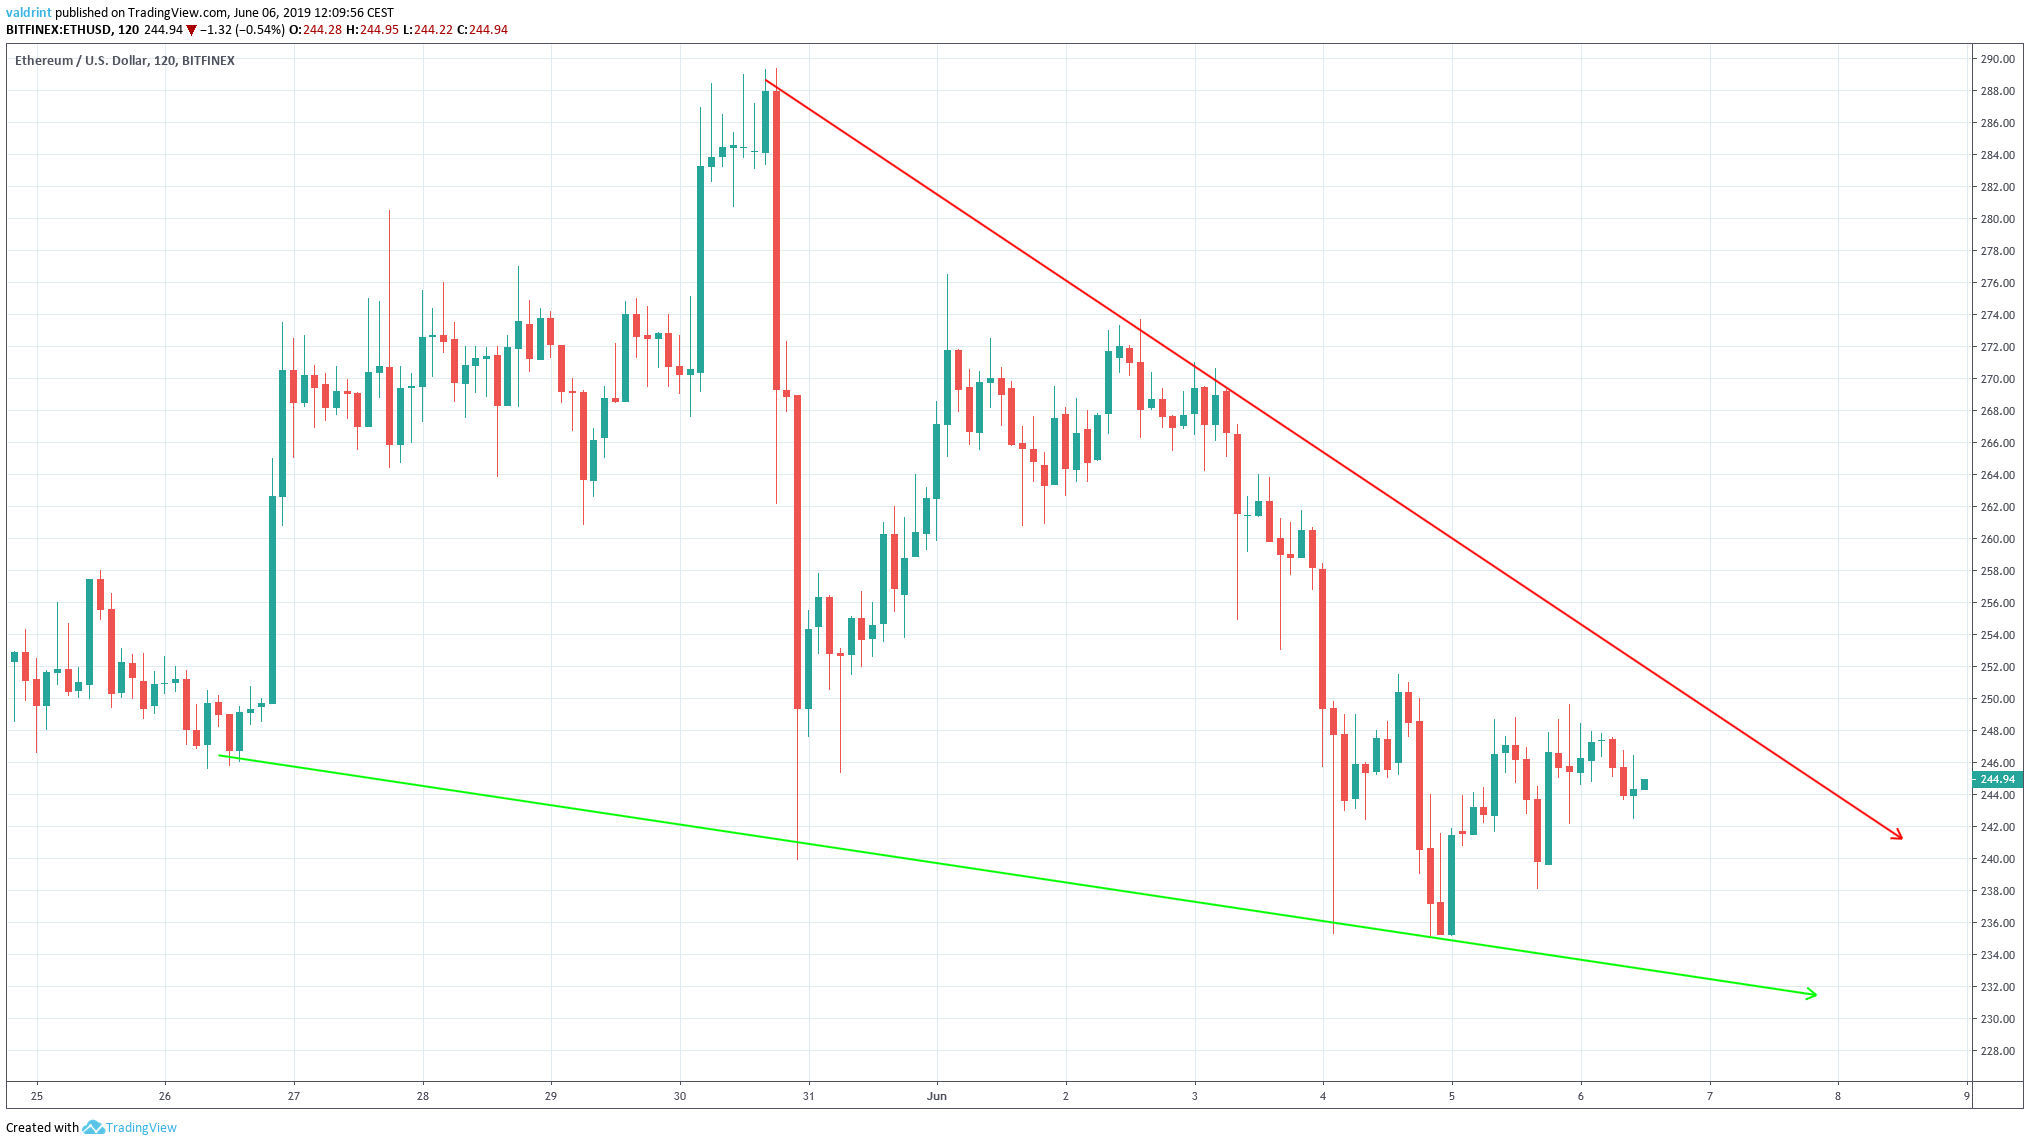
At the time of writing, the Ethereum price was trading near the middle of the wedge.
Furthermore, it is trading inside a short-term symmetrical triangle.
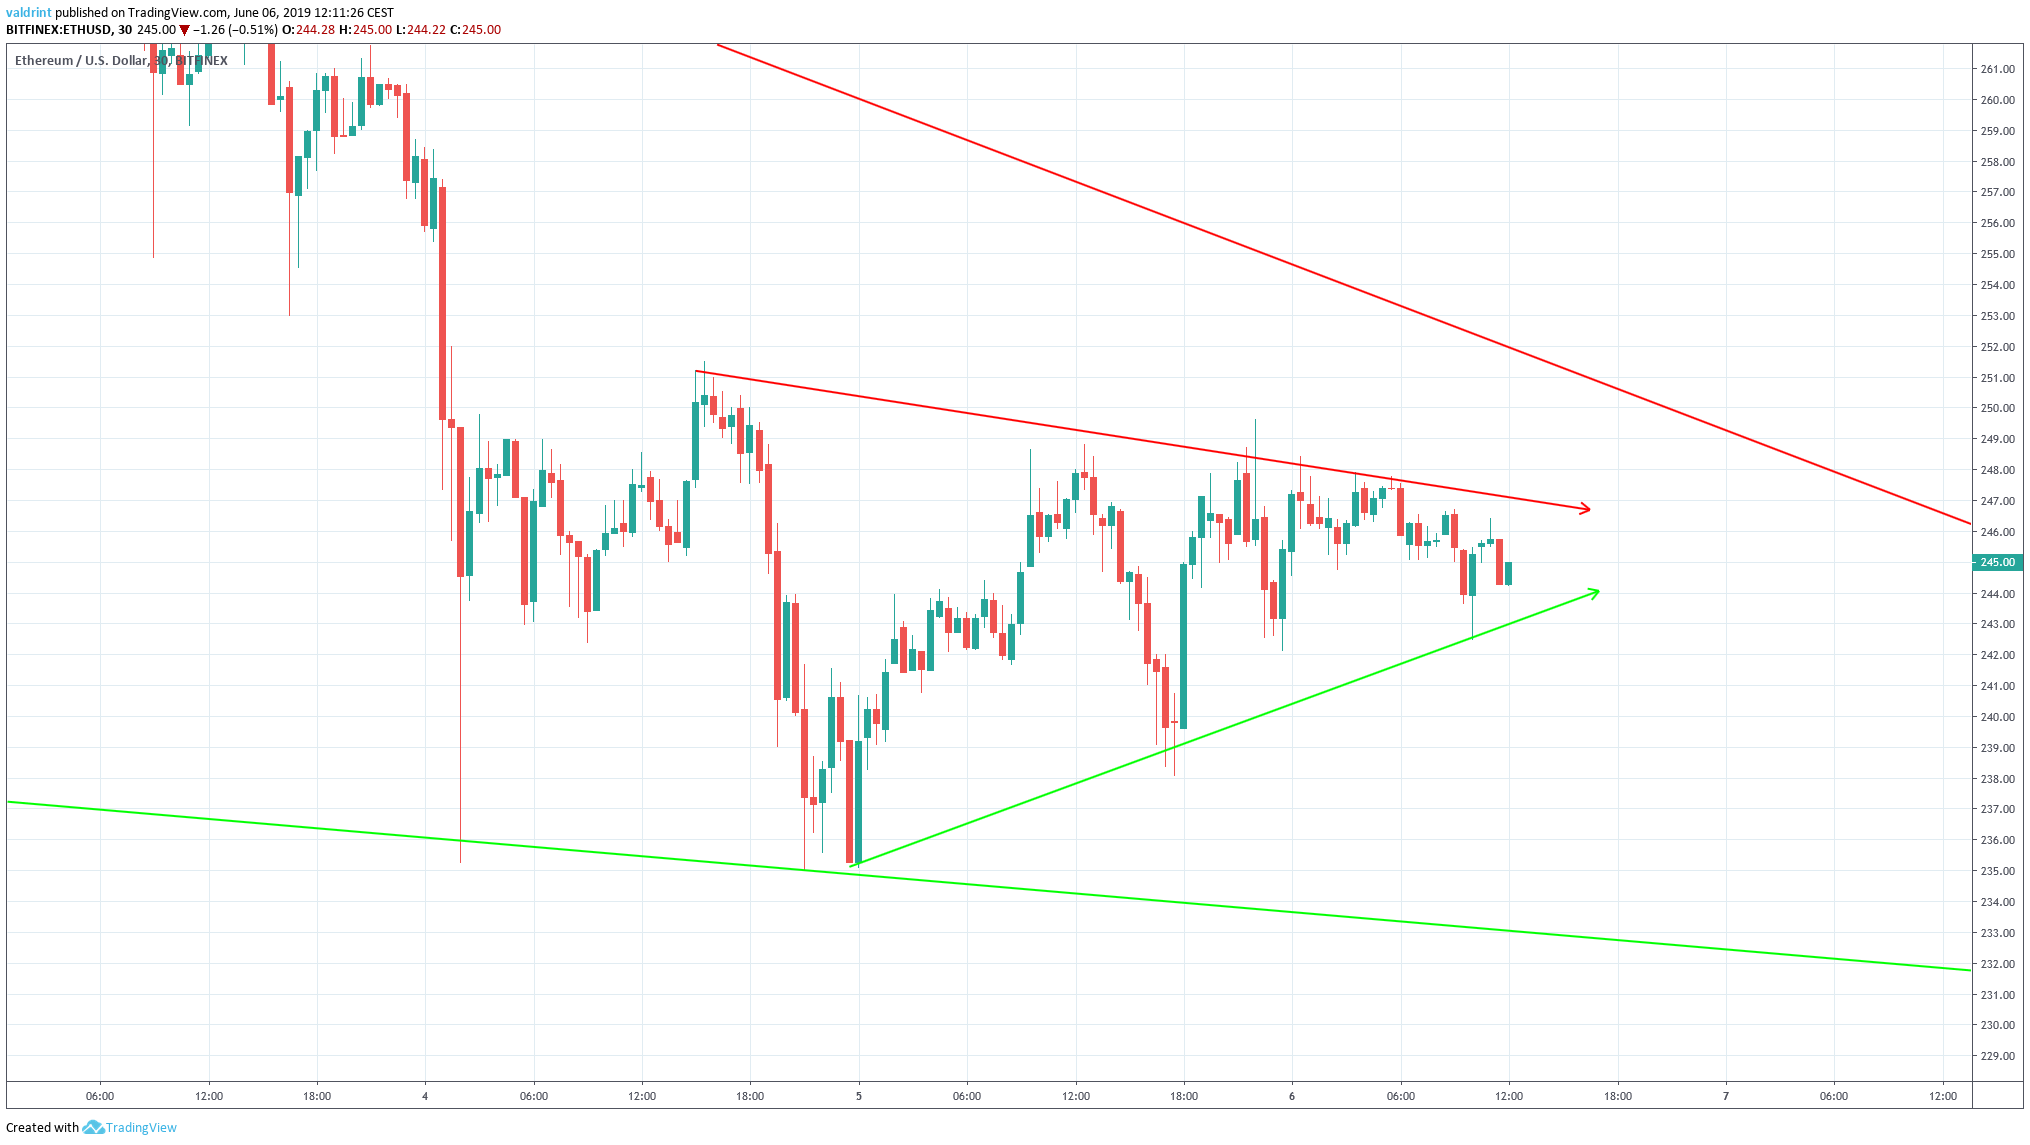
The resistance line of the triangle has been touched five times and the price is very close to breaking out.
However, a breakout from the triangle would likely indicate a breakout from the descending wedge, since their resistance lines are very close to each other.
Is that likely to occur? In order to answer that, a look at technical indicators in a long-term time-frame is required.
Ethereum Price: Moving Averages
The Ethereum (ETH) price is analyzed alongside the 100- and 150-period moving averages (MA) below:
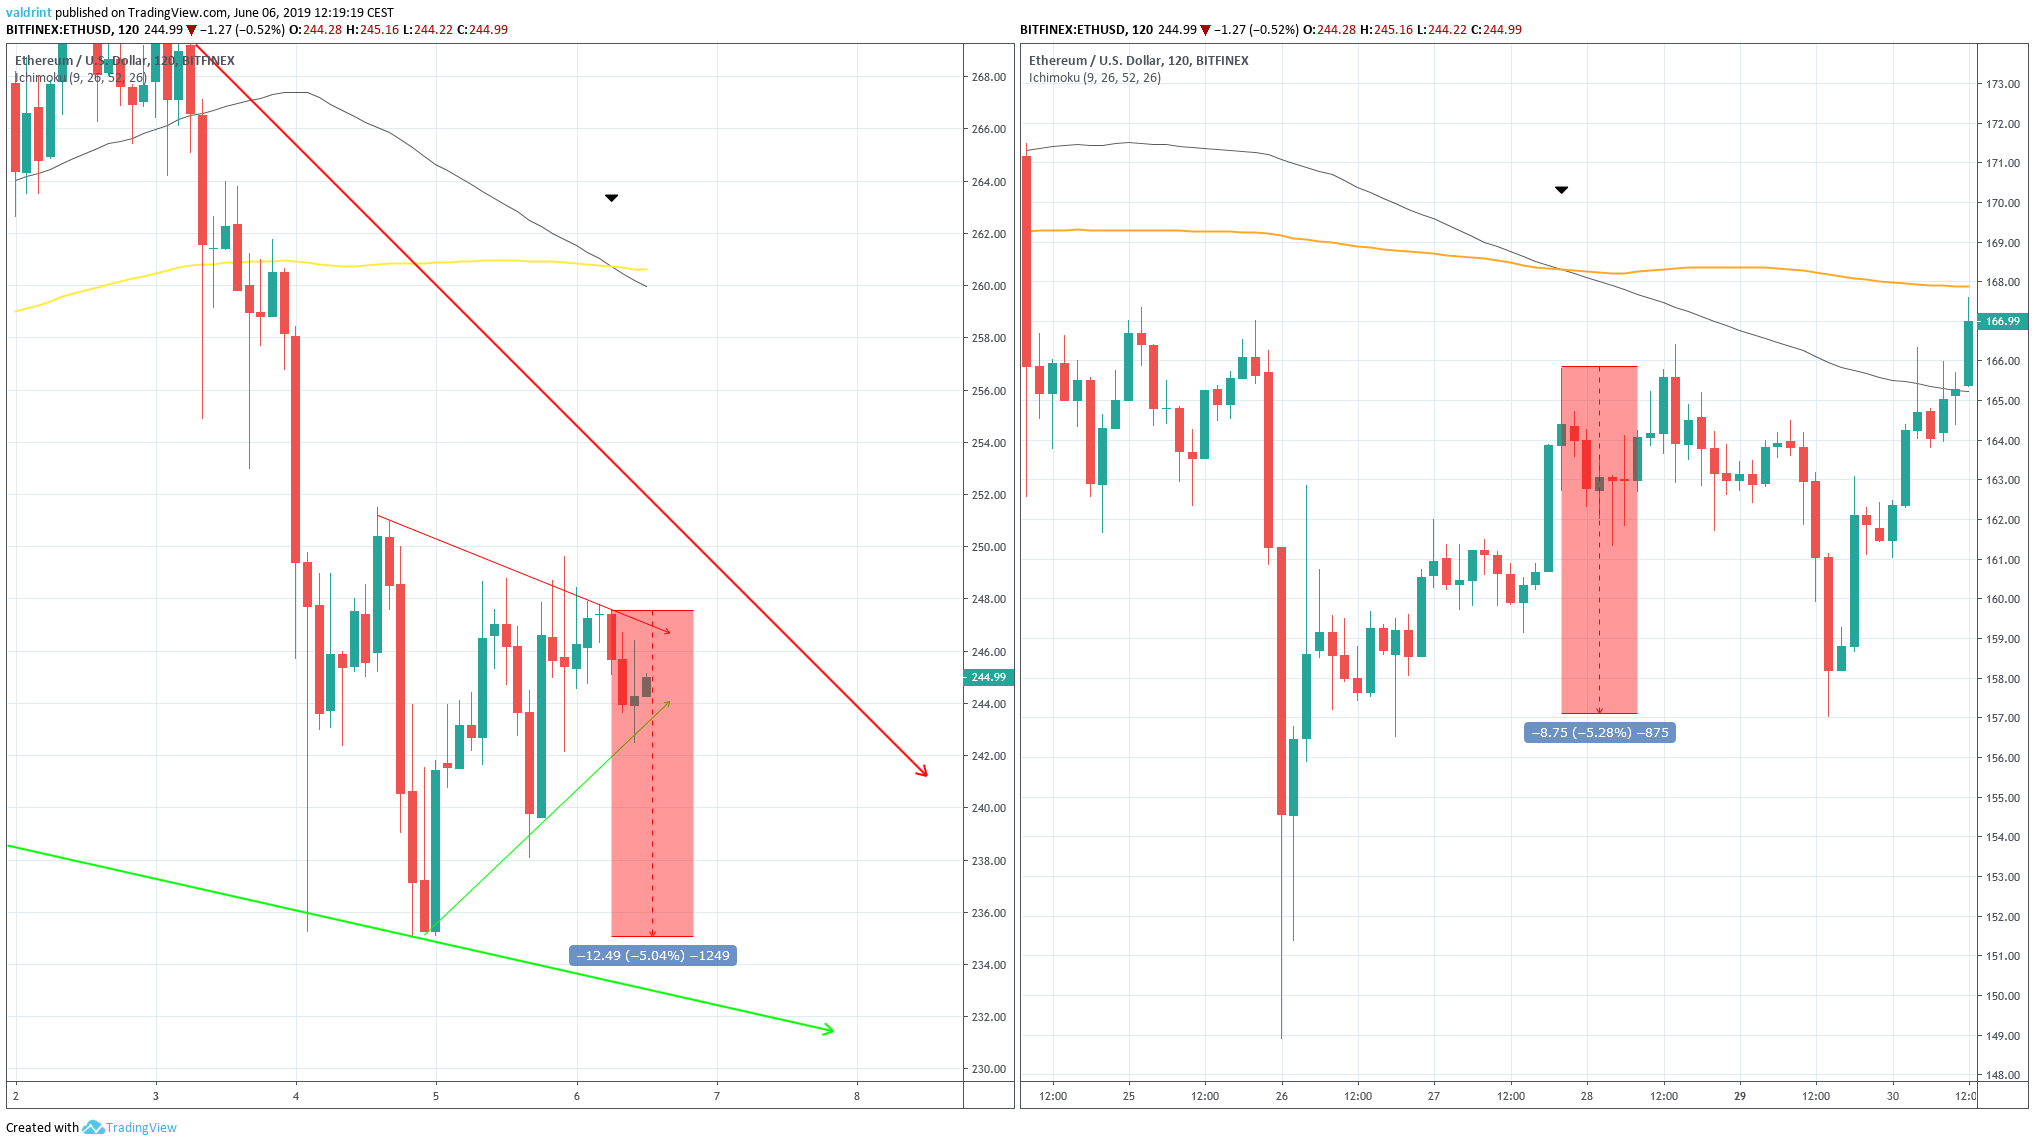
On Jun 6, a bearish cross occurred between the 100- and 150- period moving averages. This often indicates that a downtrend has begun.
The previous time this occurred was on May 28. It preceded a 5.2 percent decrease in a period of two days. If the same were to occur, it would cause a decrease towards the previous lows at $235.
A look at a longer timeframe alongside the RSI provides a similar outlook:
In our previous analysis, we stated that :
The ETH price reached higher highs on May 16 and 30. The candlesticks were characterized with long upper wicks. This indicates that there is selling pressure in the market.
During this period, the RSI generated lower highs. This is known as bearish divergence and often precedes price decreases.
Since the divergence occurred in a period of 15 days, it is likely that the downward has not yet finished and further decreases are in store. However, a short-term increase cannot be ruled out.
When a decisive move occurs, where will the price begin to reverse?
Reversal Areas
One support and one resistance area is traced for ETH/USD below:
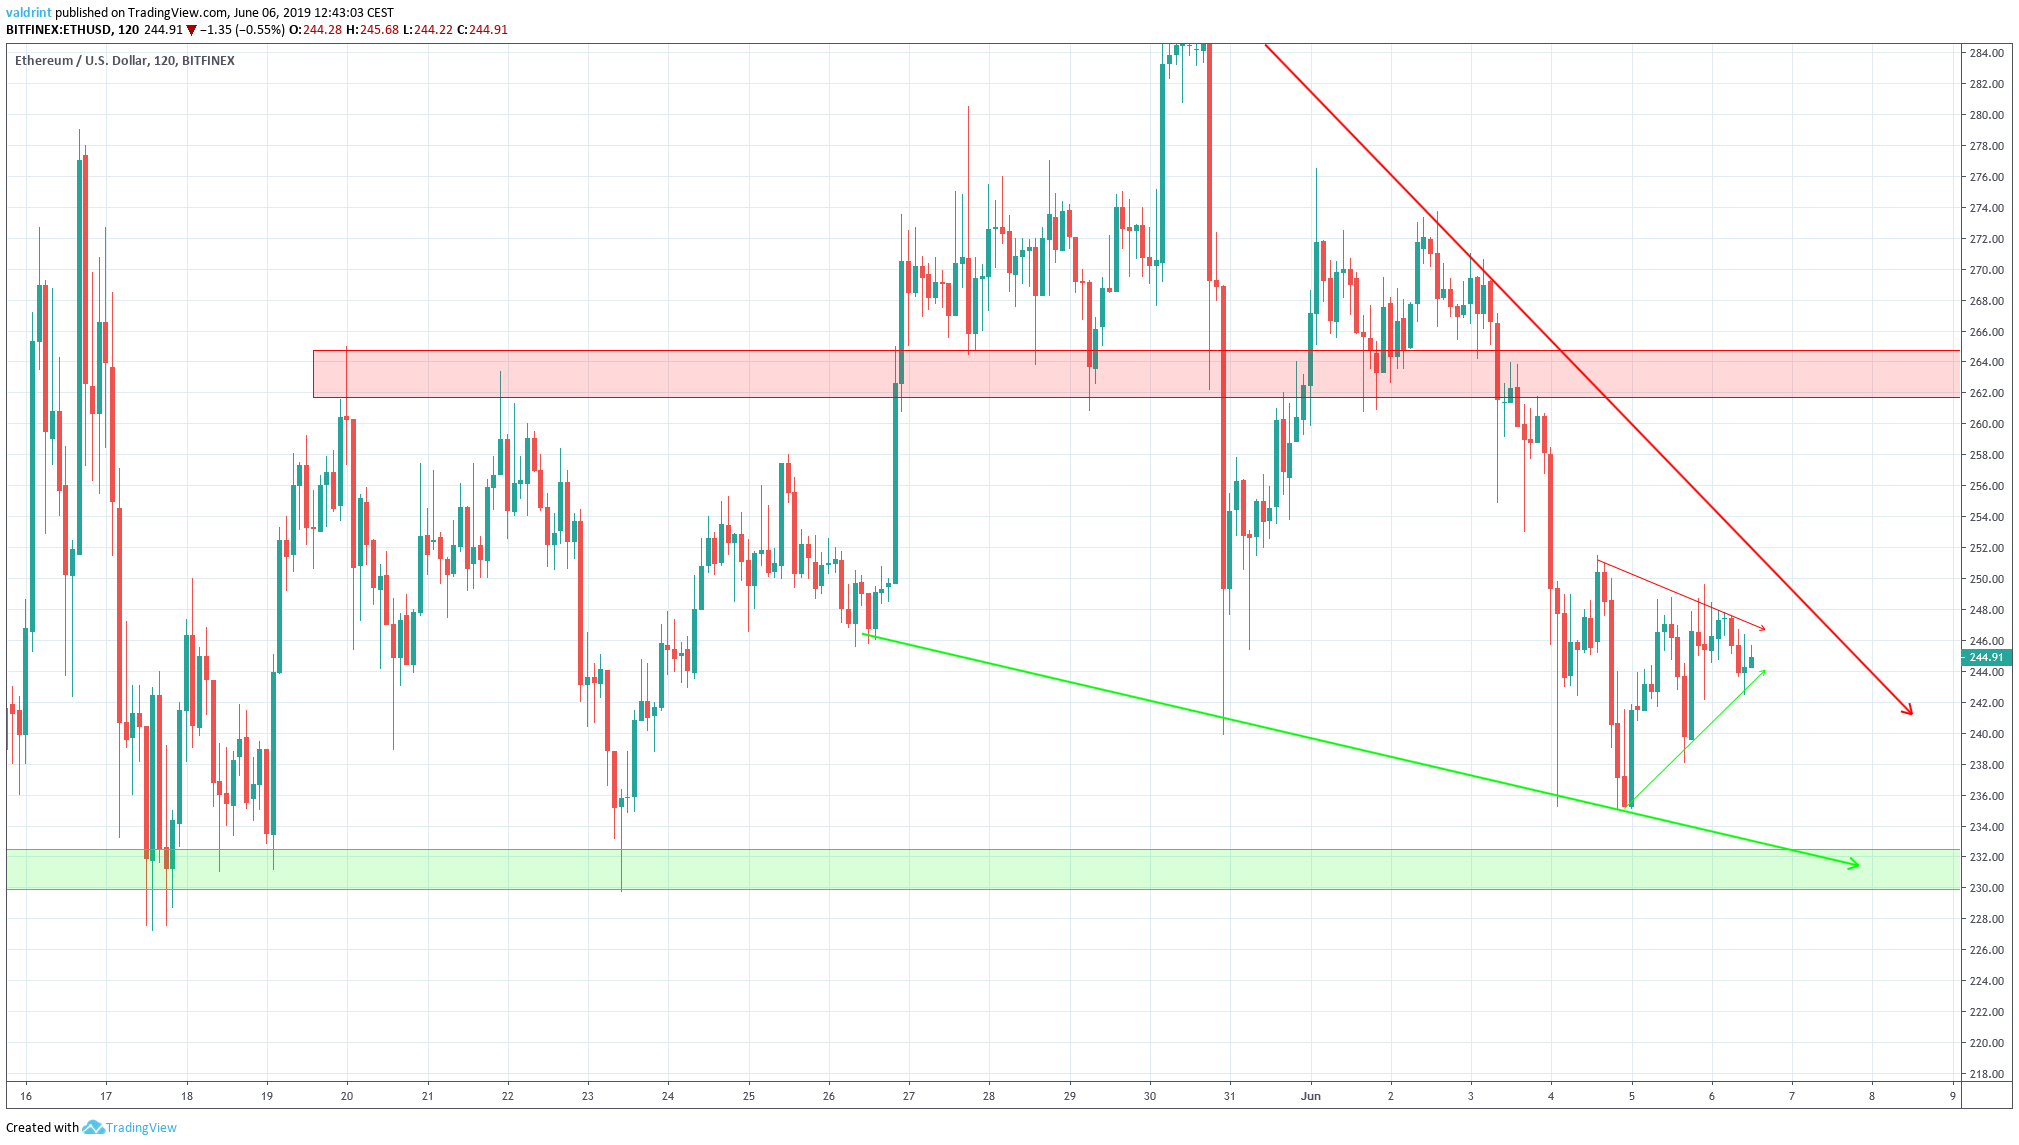
The closest support area is found near $230. If the ETH price breaks down from the triangle and continues to decrease at the rate predicted by the wedge, it should reach this area on Jun 8-10.
The closest resistance area is found near $263. A breakout from the wedge would be required for the Ethereum price to reach this target.
Summary
To conclude, the Ethereum price (ETH) has recently experienced significant decreases. It is currently trading in a short-term symmetrical triangle and is nearing its convergence point. The technical indicators paint a bearish picture in the long-term.
What do you think about the future outlook for the price of Ethereum (ETH)? Let us know your thoughts in the comments below!
Disclaimer: This article is not trading advice and should not be construed as such. Always consult a trained financial professional before investing in cryptocurrencies, as the market is particularly volatile.


