


On September 6, 2019, the Ethereum price reached a low of ₿0.0161. A rapid upward move followed, and the price reached a high of ₿0.0171 the next day. Since then, it has been on a gradual uptrend, making successively higher highs.
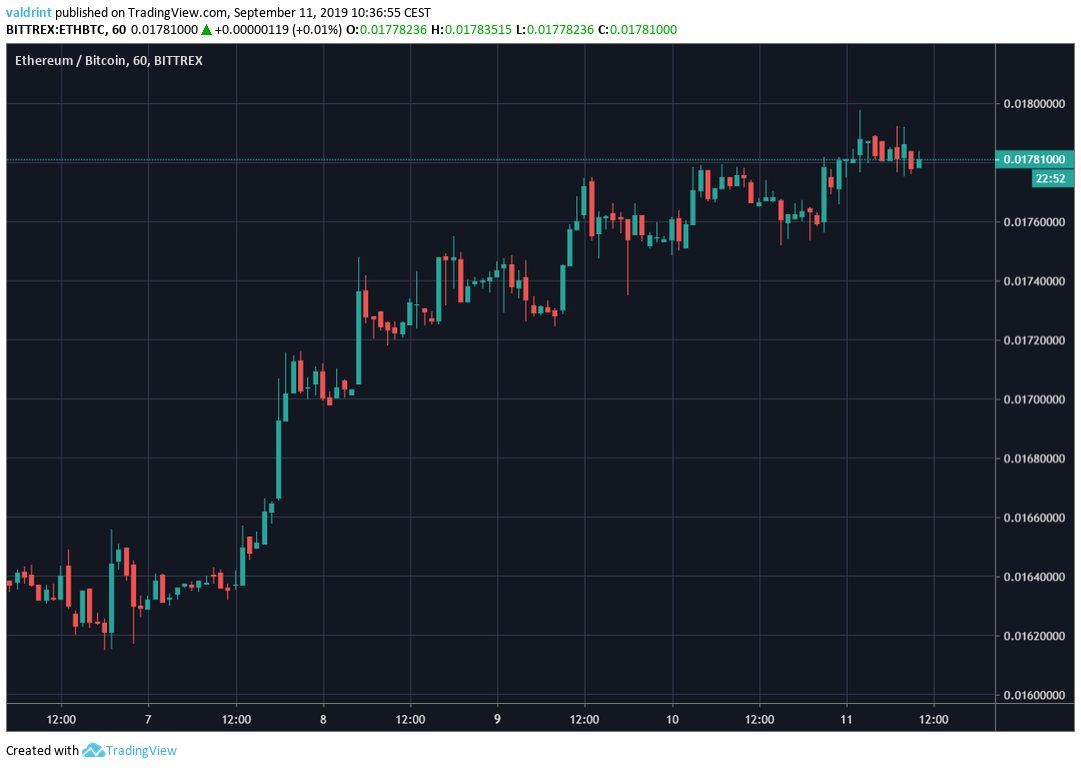
At the time of writing, ETH was trading close to ₿0.018.
How long will ETH continue to increase? Keep reading below if you want to find out.
For our previous analysis, click here.
Ethereum Price: Trends and Highlights for September 11
- ETH/BTC is following a short-term ascending support line.
- The hourly RSI & MACD have developed bearish divergence.
- There is resistance at ₿0.018 and ₿0.019.
- There is support at ₿0.017.
Tracing Support
Looking at the two-hour time-frame reveals that ETH has been following an ascending support line since September 8.
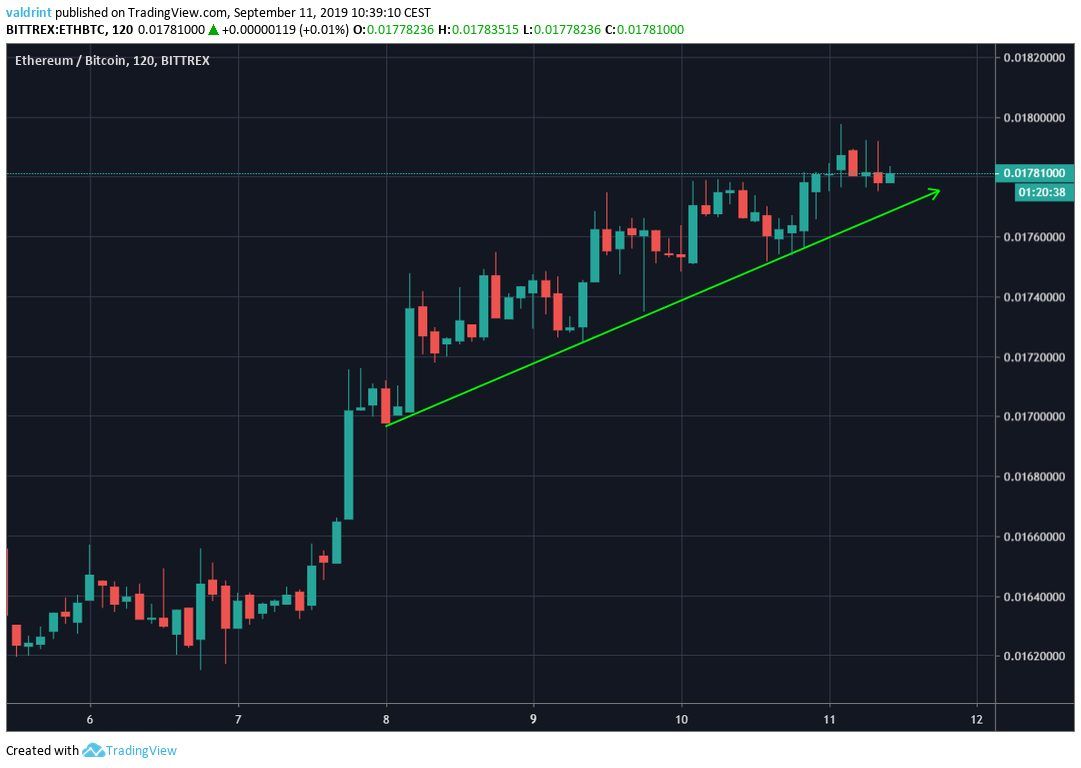
The support line has been validated several times.
ETH is not following any clear resistance lines.
Possible Reversal
In order to determine the strength of the move, we have incorporated both the MACD & RSI in the analysis.
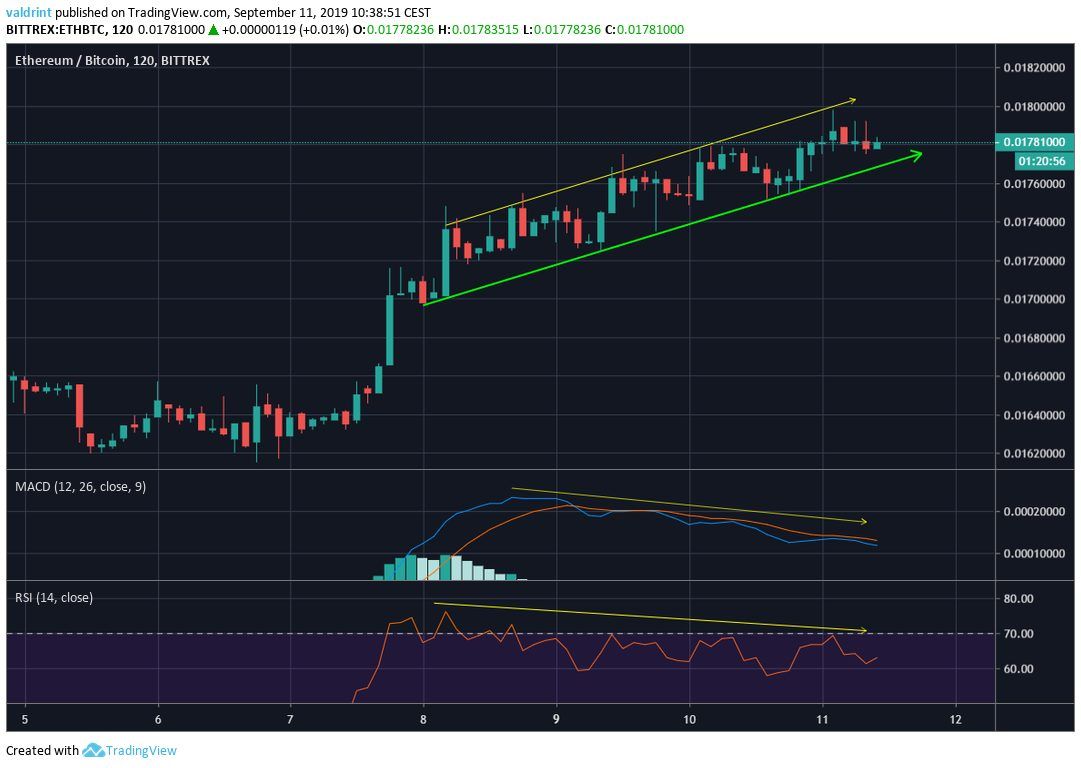
Both have been generating bearish divergence since the beginning of the support line.
The divergence is significant and its trend line has not been broken.
Additionally, we can see that this the price has reached a minor resistance area.
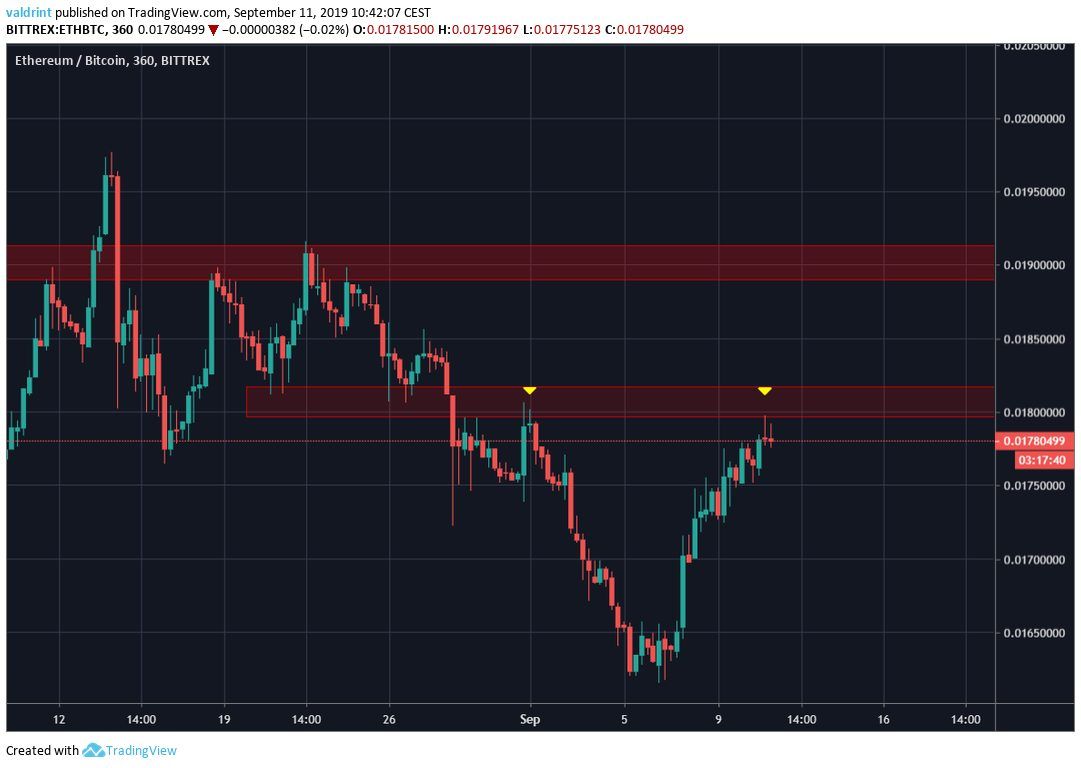
The price has created long upper wicks every time it has reached it.
Combined with the divergence, this makes us believe that ETH will soon decrease.
Furthermore, there is another resistance area at ₿0.019.
This reduces the chances of a very rapid upward move since even if one occurs, it is likely to stop once it reaches this area.
Future Movement
An outline of possible future price movement is given below:
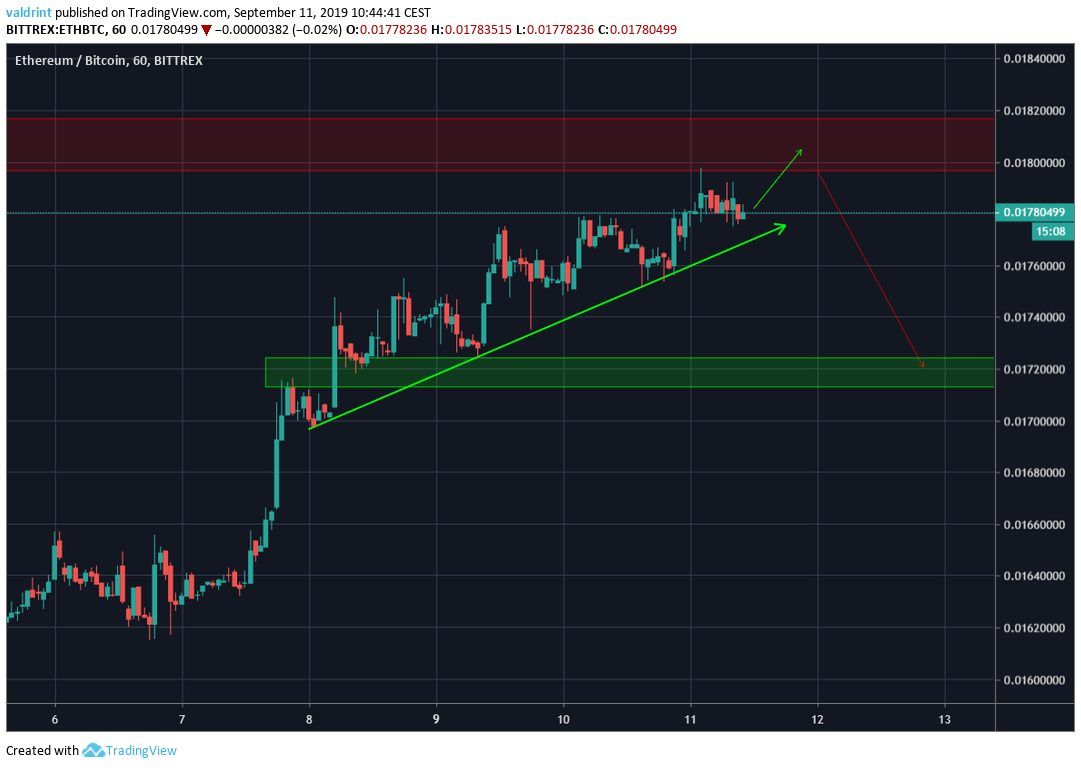
ETH is likely to reach the resistance area before breaking down from the ascending support line.
If it does so, the closest support area is found at ₿0.0172.
We believe ETH is likely to reach it.
Ethereum Price Summary
The Ethereum price is following an ascending support line.
According to our analysis, it is likely to break down and reach the support area outlined above.
For trading purposes, we consider Ethereum a sell in levels close to ₿0.018.
Do you think ETH will break down in the short-term? Let us know in the comments below.
Disclaimer: This article is not trading advice and should not be construed as such. It is for educational purposes only and represents the typical trades the author would make himself. Always consult a trained financial professional before investing in cryptocurrencies, as the market is particularly volatile.
Images are courtesy of Shutterstock, TradingView.


