


On September 7, 2019, the Ethereum price reached a low of ₿0.0164. A gradual uptrend followed, and ETH reached a high of ₿0.0179 on September 11. It traded around this level until September 14, when another more rapid upward move ensued. ETH reached a high of ₿0.022 on September 19.
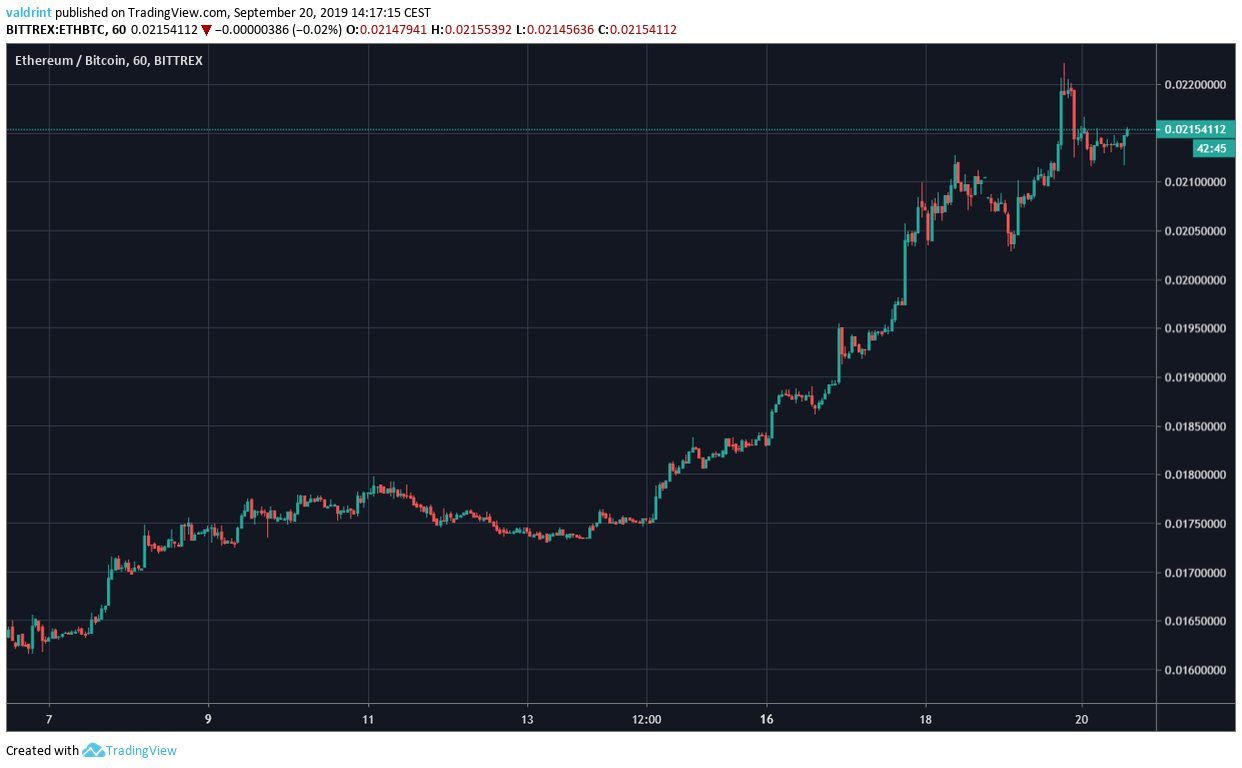
At the time of writing, ETH was trading near ₿0.0215.
Where will the price go to next? Keep reading below if you want to find out.
For our previous analysis click here.
Ethereum Price: Trends and Highlights for September 20
- ETH/BTC is trading inside a long-term descending wedge.
- It is following a very steep short-term ascending support line.
- There is resistance at ₿0.0215.
- A bearish divergence has developed in the RSI.
- There is support at ₿0.0198.
Descending Wedge
A look at the daily time-frame shows that ETH has been trading inside a long-term descending wedge since October 2018.
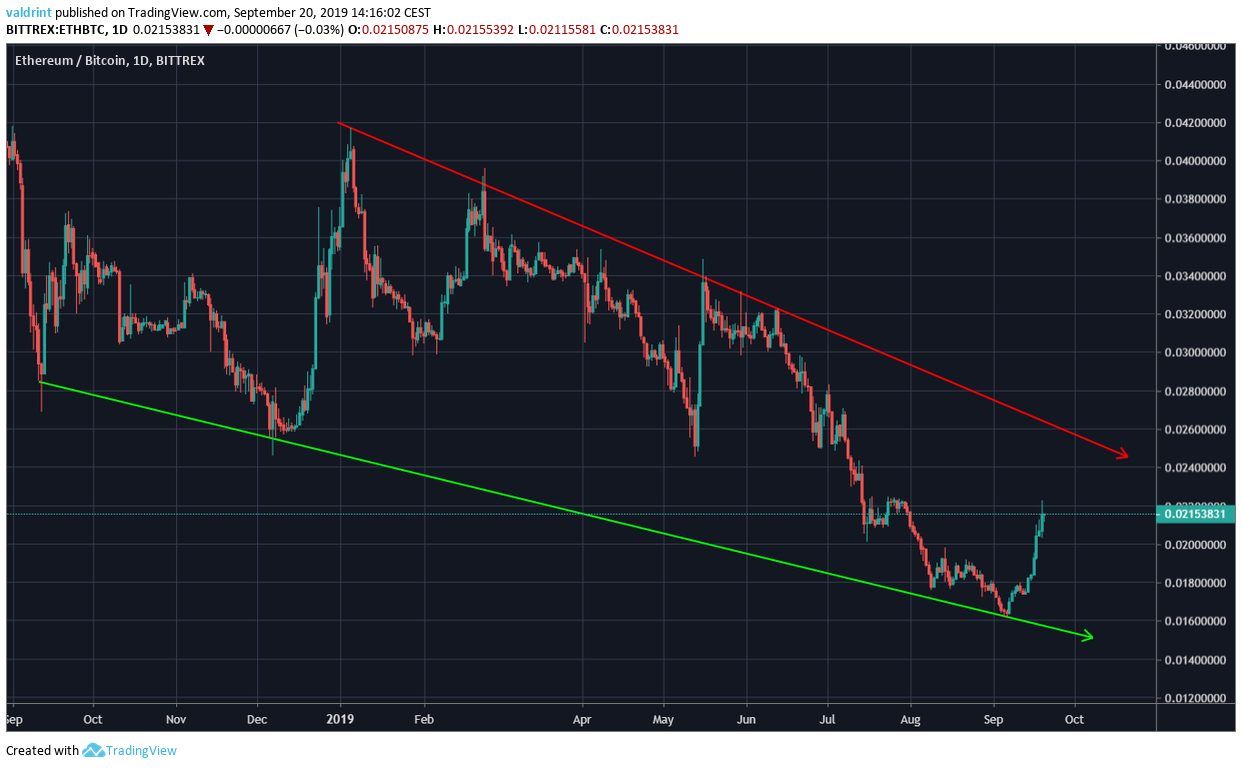
Once the price reached the support line on September 5, it began the upward move discussed in the introduction.
At the time of writing, it was trading in the middle of the wedge, moving towards the resistance line.
Will it reach it?
Moving Averages
Looking at the daily moving averages (MA), we can see that the short-term MAs have confirmed the uptrend.
However, the price is facing resistance from its 100-day MA.
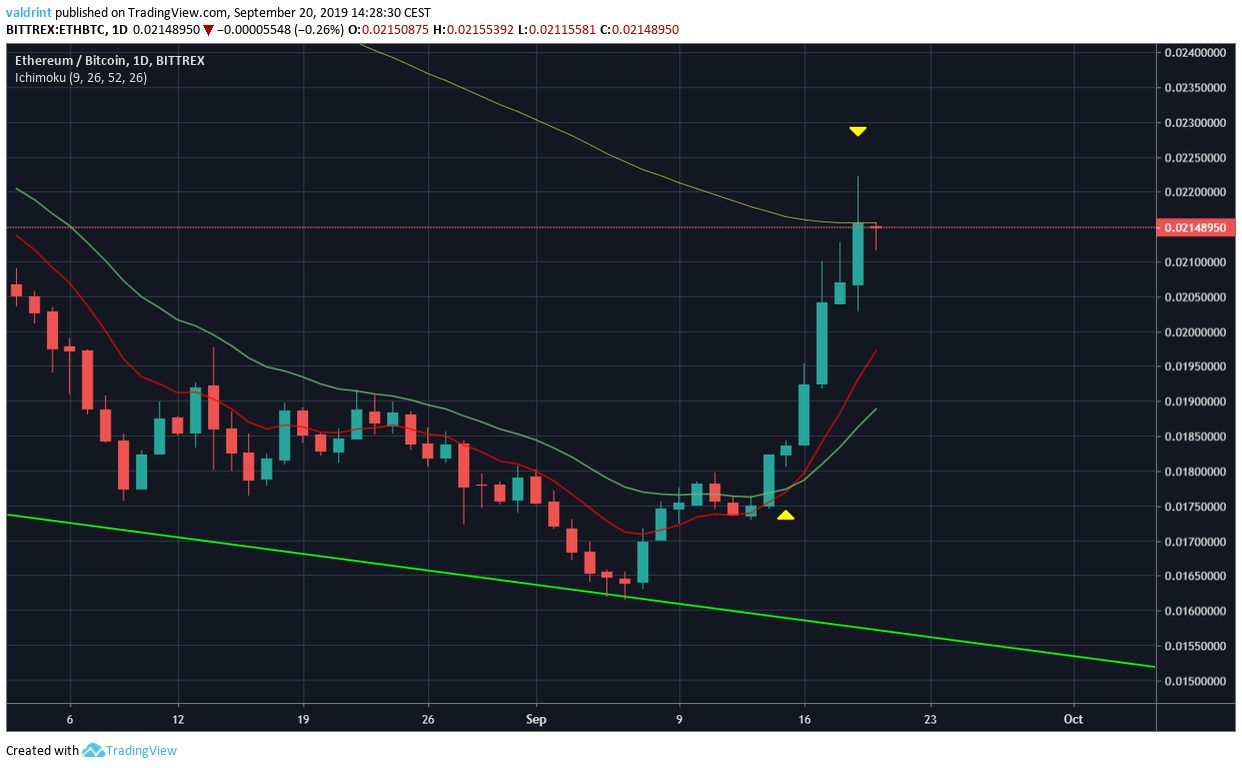
Once the upward move began, the 10- and 20-day MAs made a bullish cross on September 15.
ETH has been trading above them since.
However, once the price reached the 100-day MA, it began to decrease.
It created a long upper wick and has failed to reach a close above the MA.
Let’s take a closer look and see if the price will be successful in doing so.
Steep Support
Looking at the 4-hour time-frame, we can see that Ethereum has reached a significant support area and is following a very steep ascending support line.
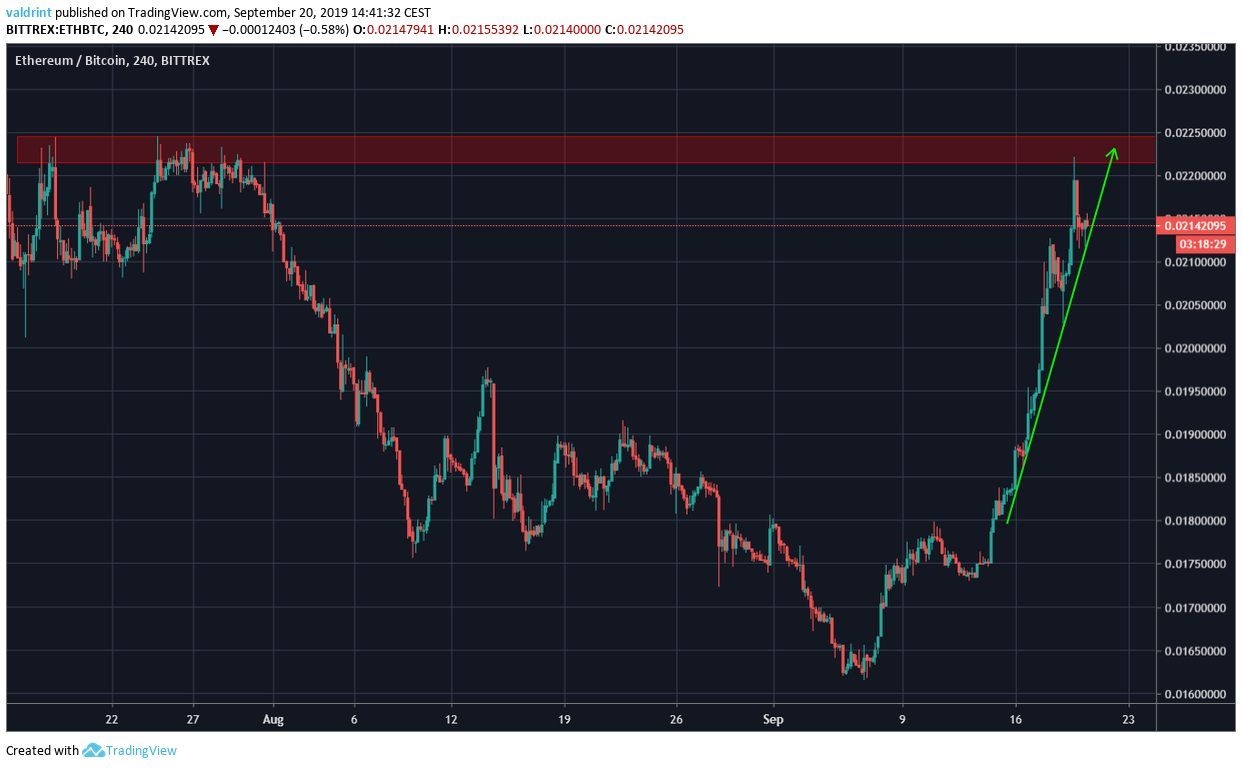
The significance of the resistance area is strengthened since it coincides with the previously discussed 100-day MA.
Additionally, incorporating the RSI shows a developing bearish divergence.
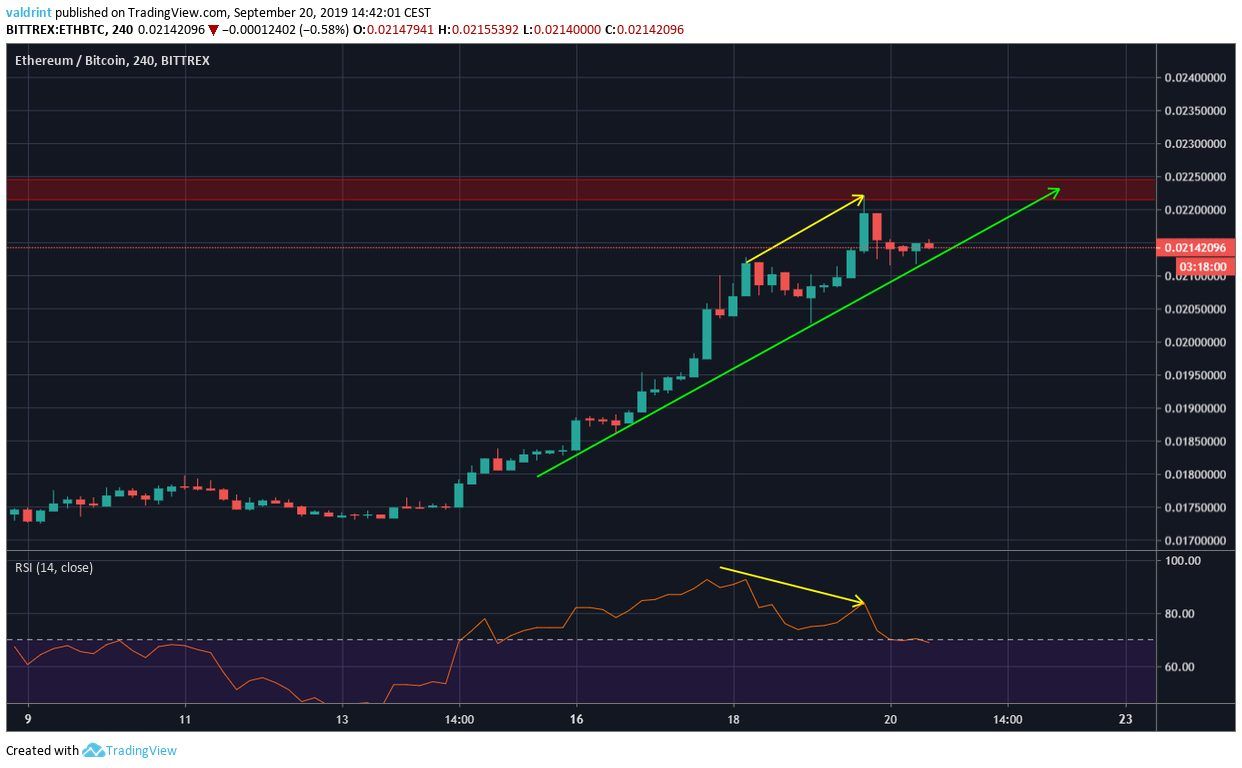
The divergence is visible in the higher highs of September 18 and 19.
This makes us believe that the price will eventually break down from the support line.
Future Movement
An outline of possible future price movement is given below:
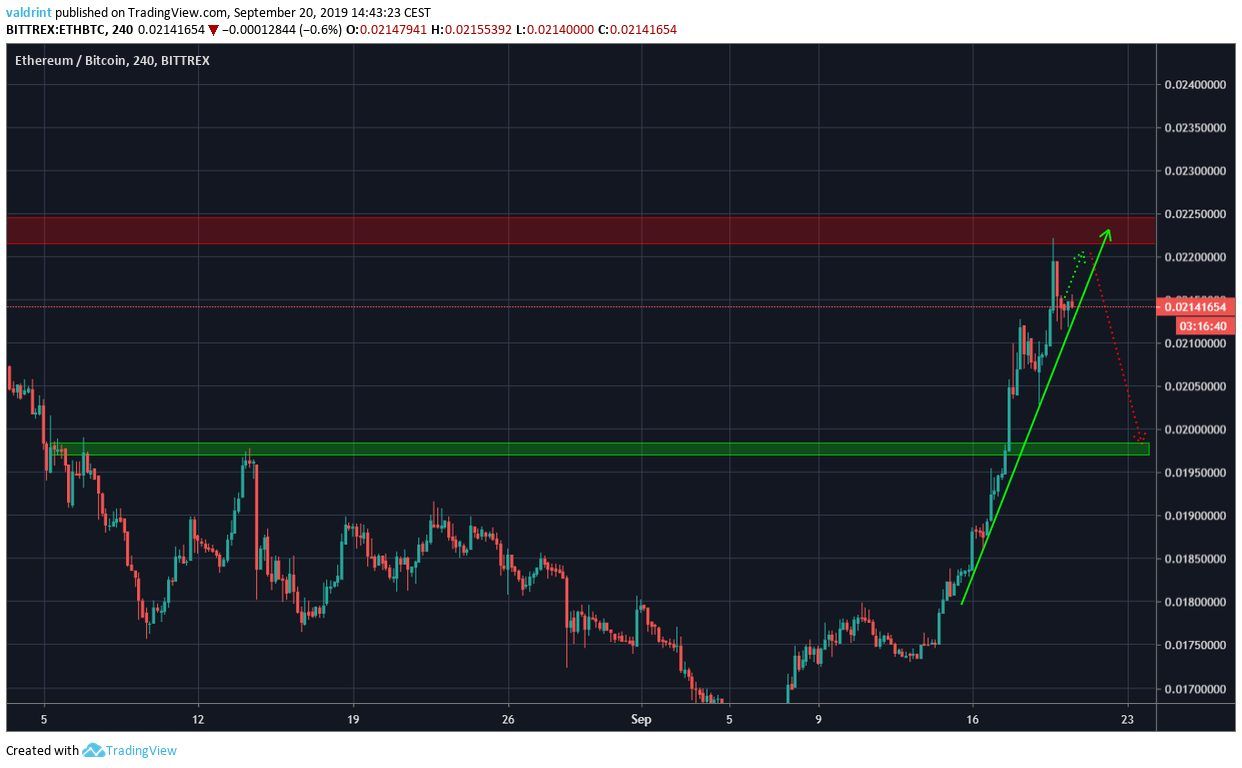
ETH is likely to reach the resistance area again, before creating a reversal pattern and breaking down.
Afterward, it is likely to reach the support area at ₿0.0198.
Ethereum Price Summary
The Ethereum price is following a very steep ascending support line.
According to our analysis, it is likely to break down and reach the support area at ₿0.0198.
For hypothetical trading purposes, we consider ETH a sell near ₿0.022.
Do you think the Ethereum price break down from the support line? Let us know in the comments below.

Disclaimer: This article is not trading advice and should not be construed as such. Always consult a trained financial professional before investing in cryptocurrencies, as the market is particularly volatile.
Images are courtesy of Shutterstock, Tradingview


