
On September 7, 2019, the Ethereum price reached a low of ₿0.0162. It began a slow upward move, reaching a high of ₿0.0179 on September 11. After trading near that level for the next four days, ETH accelerated its rate of increase. Another upward move began, which is still ongoing.
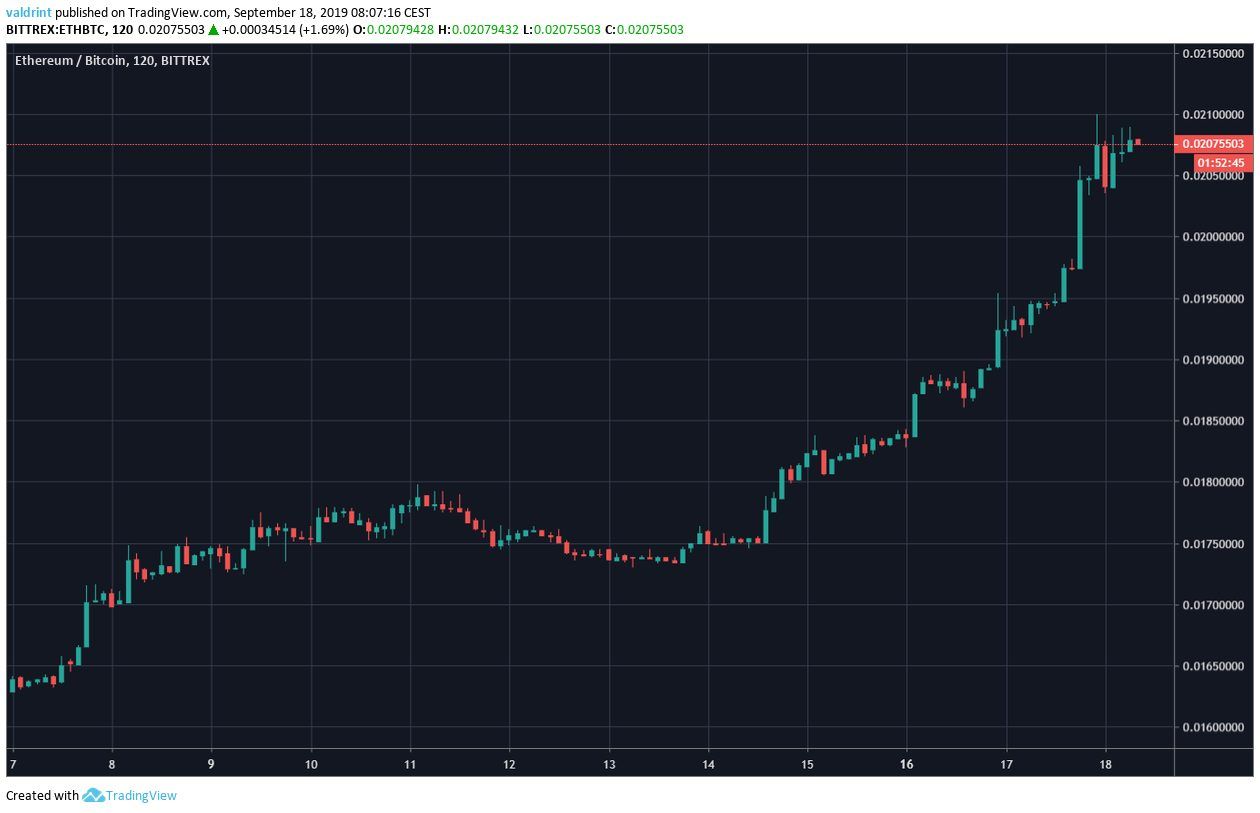
Where will the Ethereum price go to next? Continue reading below if you want to find out.
For our previous analysis, click here.
Ethereum Price: Trends and Highlights for September 18
- ETH/BTC is trading inside a descending wedge.
- Bullish divergence preceded the current upward move.
- There is resistance near ₿0.021 and ₿0.023.
- The 10- and 20-day moving averages have made a bullish cross.
- ETH is likely in the third wave of a five wave Elliott formation.
Long-Term Ethereum Price Pattern
A look at the weekly chart shows that ETH has been trading inside a descending wedge since September 2018.
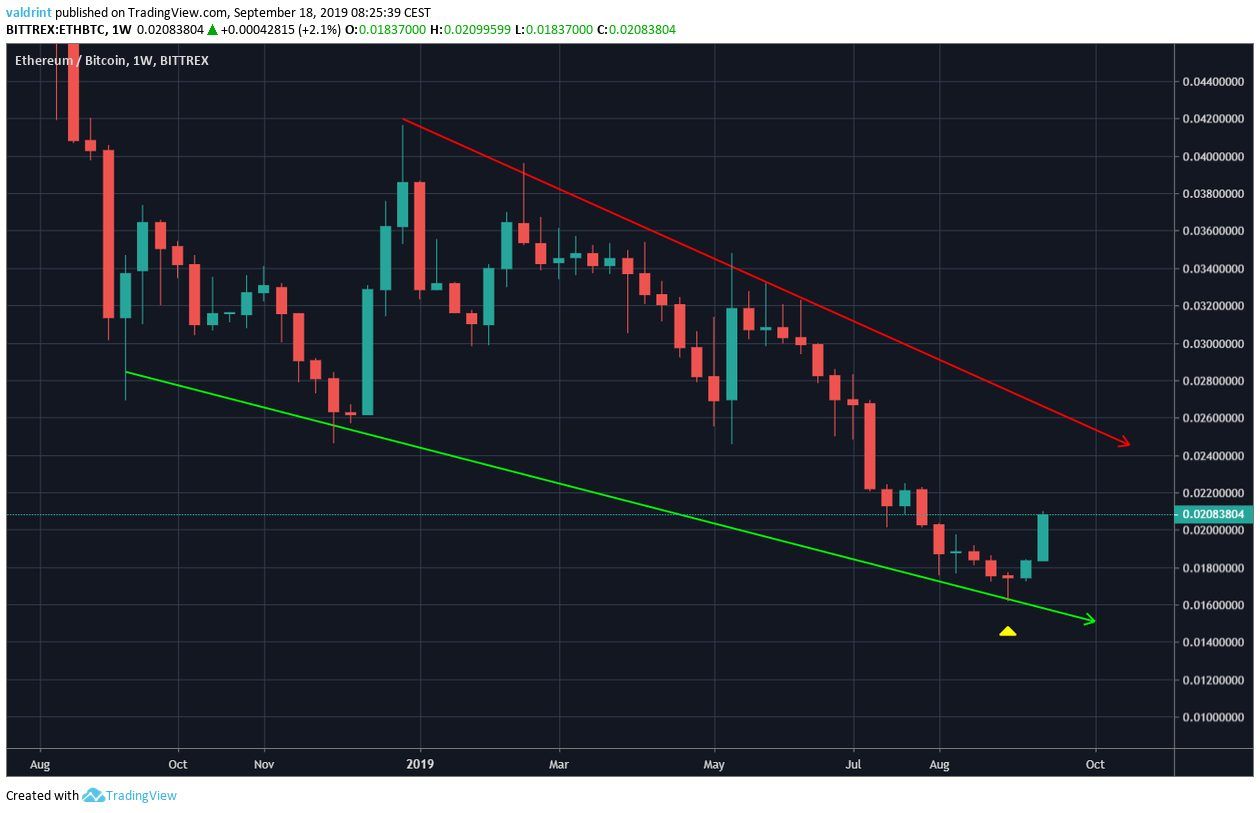
On September 2019, the Ethereum price reached the support line and began the upward move discussed in the introduction.
The resistance line is currently at ₿0.026. Will ETH reach it?
Technical Indicators
A look at the daily RSI & MACD shows that the upward move was preceded by a very significant bullish divergence.
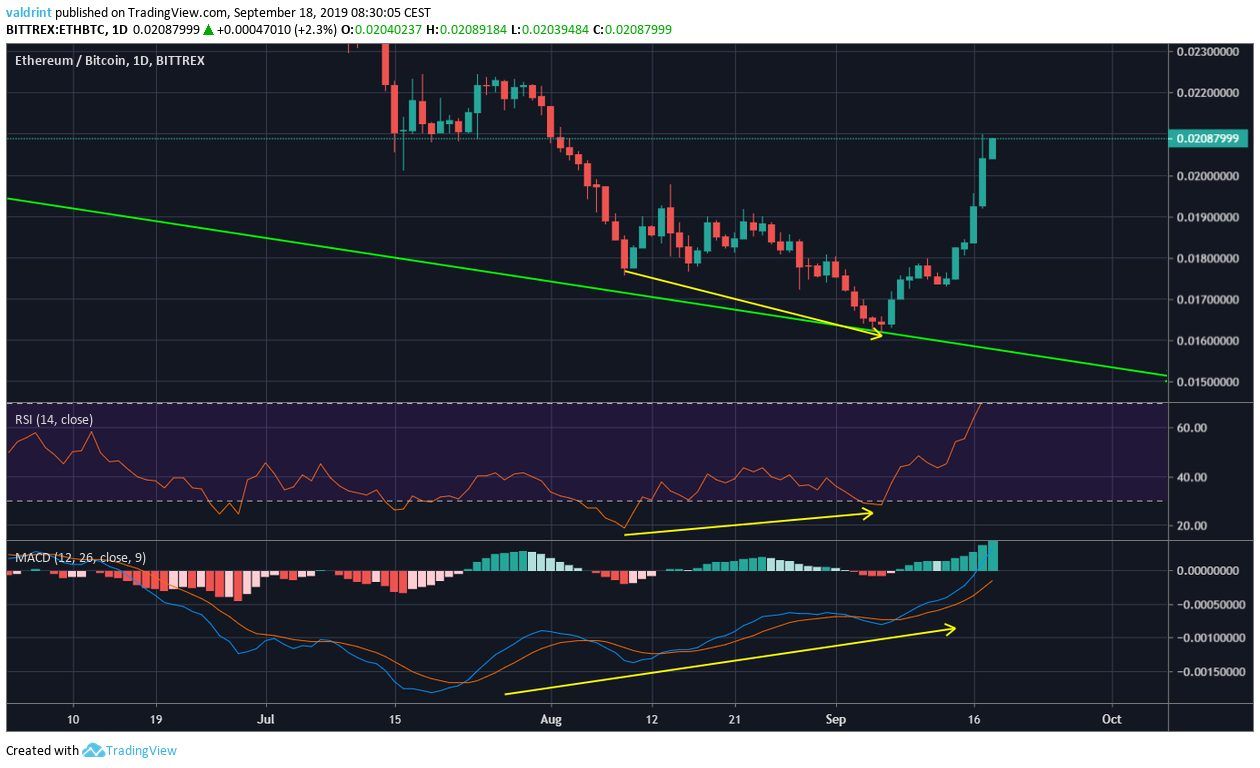
The divergence is especially visible in the lower lows of August 10 and September 6.
Additionally, the MACD has crossed into positive territory.
After initiating the upward move, ETH moved above its 10- and 20-day moving averages (MA).
The MAs made a bullish cross on September 14.
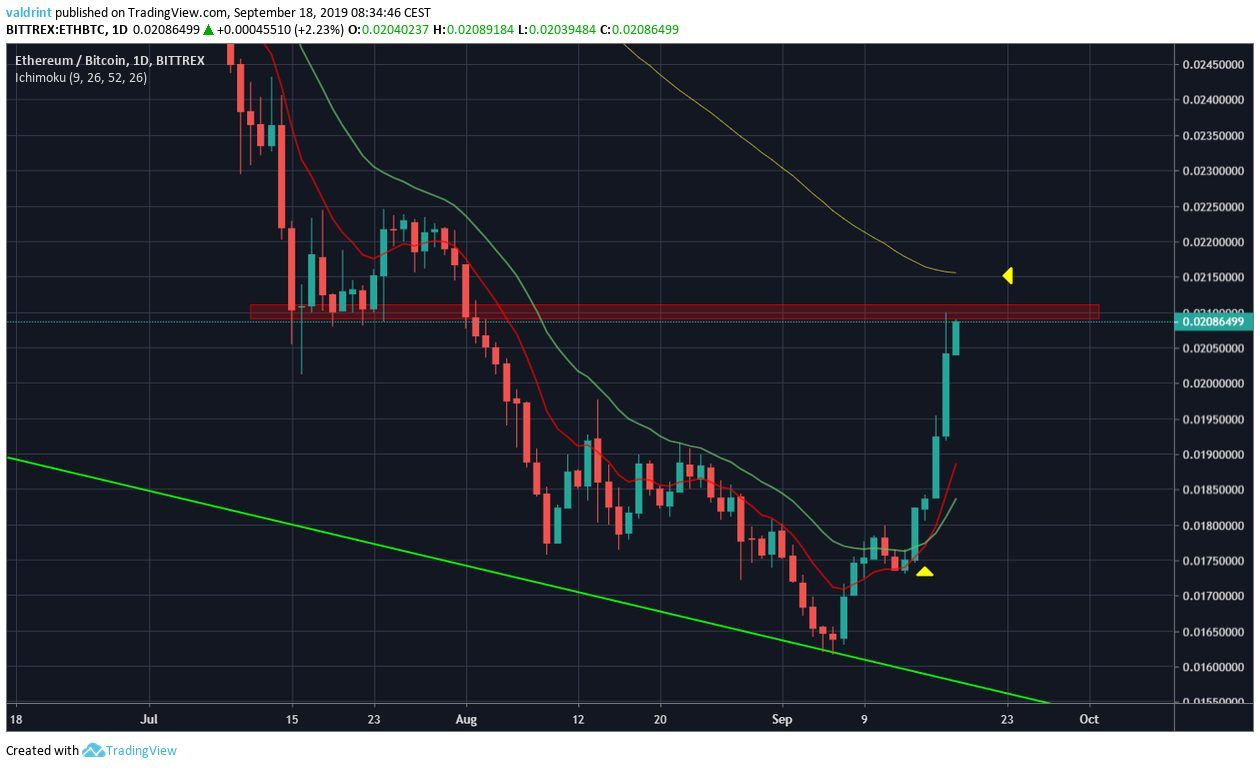
Currently, the Ethereum price is trading inside a resistance area at ₿0.021.
The significance of this area is strengthened by the 100-day MA, which is also likely to provide resistance.
Therefore, while ETH has initiated an upward move, it has already reached a significant resistance area.
Let’s take a look at the short-term and see if it is likely to move above it.
Wave Count & Future Resistance
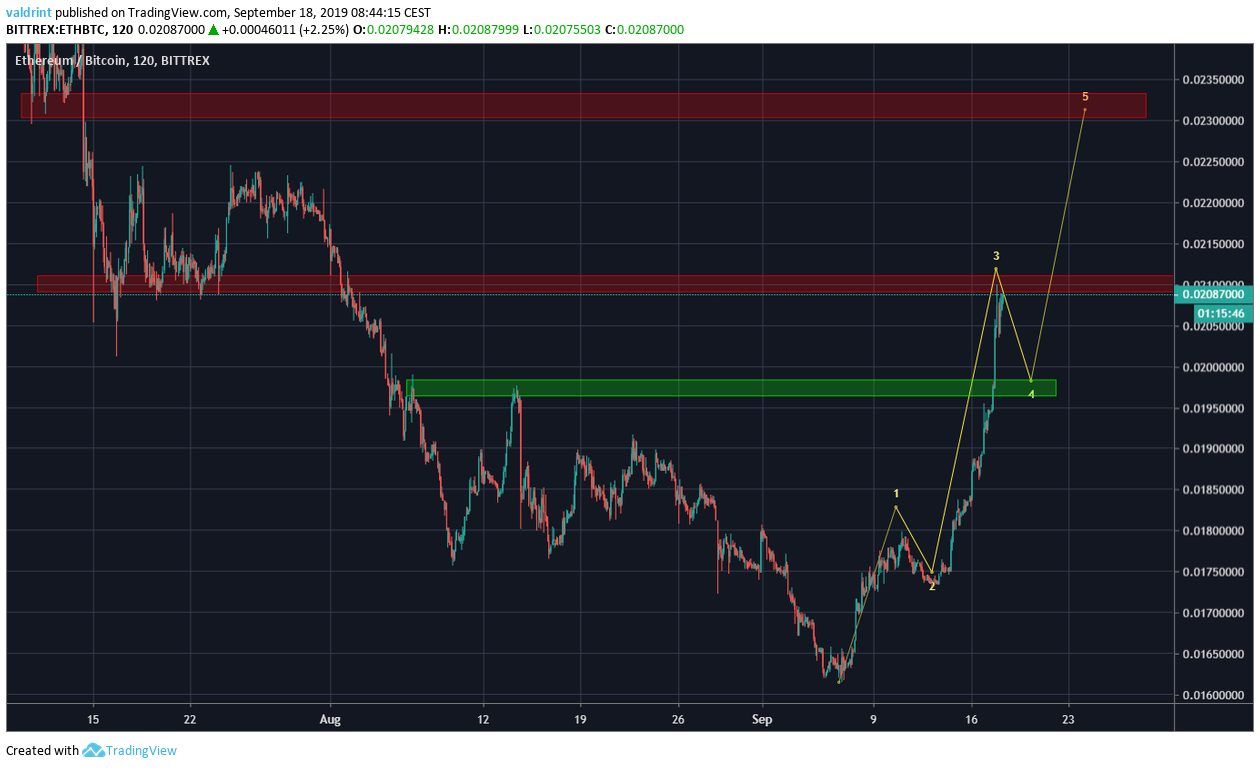
Looking at the hourly time-frame, we can see that ETH is likely in the third wave of a five wave Elliott formation.
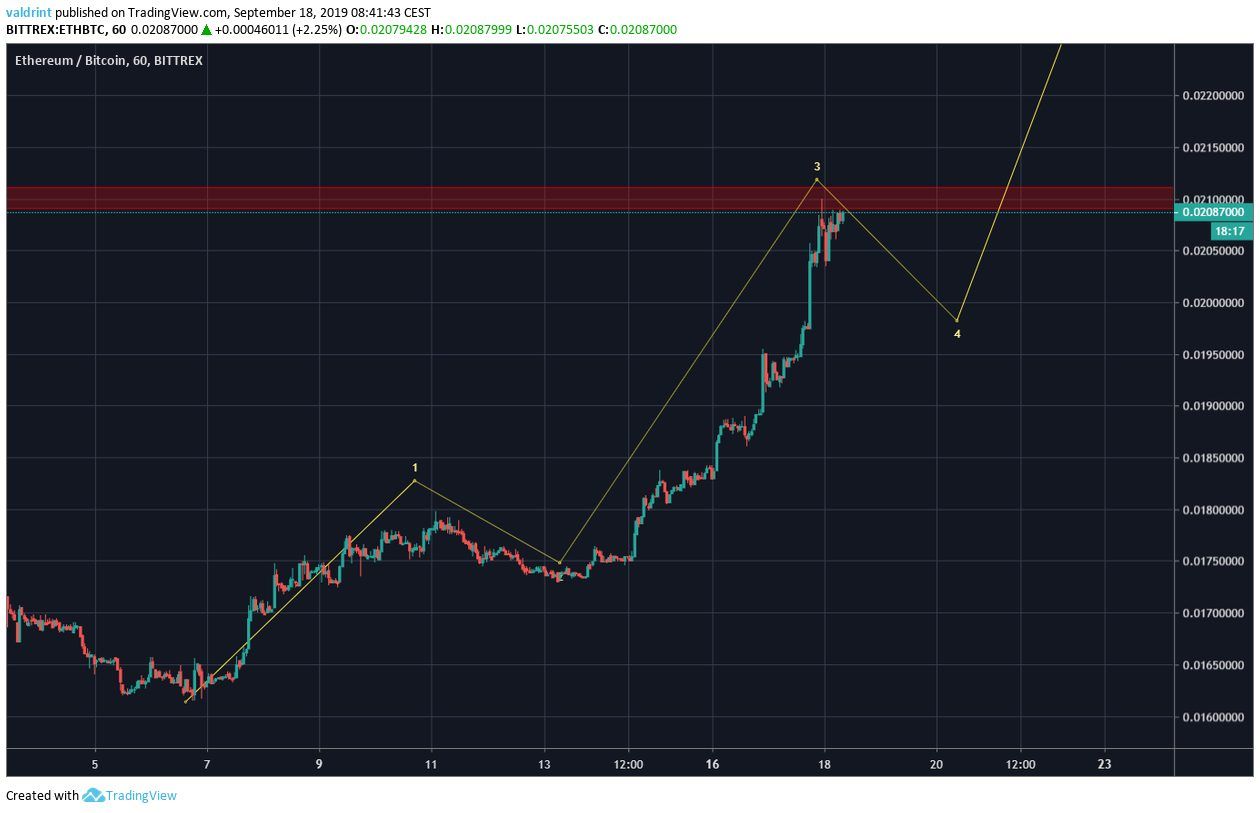
One resistance area which could act as a target for the fifth wave is found at ₿0.023.
However, this resistance area is significantly below the resistance line of the wedge, which is found at ₿0.026.
The strong levels of resistance between it and the current price make us uncertain as to whether ETH will reach it, especially in the short-term.
Ethereum Price Summary
The Ethereum price is trading inside a descending wedge.
According to our analysis, it is likely to move towards the resistance line of the wedge.
For hypothetical trading purposes, due to the fact that the current upward move resembles a parabola, not allowing for the placement of a stop loss, we could not identify any potentially-profitable trading purposes.
Do you think Ethereum will reach the resistance line of the wedge? Let us know in the comments below.

Do you think the Ethereum price will reach the resistance area? Let us know in the comments below.
Disclaimer: This article is not trading advice and should not be construed as such. Always consult a trained financial professional before investing in cryptocurrencies, as the market is particularly volatile.
Images are courtesy of Shutterstock, Trading
